You can query and analyze collected logs in real time to understand network activity and identify traffic anomalies. This capability enhances security monitoring and improves incident response efficiency. This topic describes how to use search and analytic statements to query logs and interpret the results.
Prerequisites
Your assets have been connected. For more information, see Access management.
Enable log delivery
Log on to the Agentic NDR console.
In the left-side navigation pane, choose Logs.
Log Delivery: In the upper-right corner of the Log Analysis page, click Delivery Settings. Turn on both Alert Logs and Protocol Log.
Set log delivery rules: In the upper-right corner of the Log Analysis page, click Log Settings. The following operations are supported:
Modify the log storage region.
Modify the log storage duration.
Expand log storage space.
For specific operations and precautions, see Modify Log Storage Configurations.
Configure filter rules and delivery fields
In the upper-right corner of the Log Analysis page, click Log Settings.
Configure the settings on the Custom Filter Rules and Custom Delivery Fields tabs.
Custom filter rules
Create a filter rule
On the Custom Filter Rules tab, click Create Rule.
In the Protocol Log Filter Rule panel, configure the Filter Logic and Stream Information, and then click OK.
ImportantWhen multiple log filter rules exist:
Multiple rules in an allowlist or a denylist are combined with OR logic.
Denylist rules override allowlist rules. If a conflict occurs, the denylist rule is applied.
Edit a filter rule
In the Actions column of the target filter rule, click Edit.
In the Protocol Log Filter Rule panel, modify the filter rule, and then click OK.
Delete a filter rule
In the Actions column of the target filter rule, click Delete.
Review the warning message and click OK.
ImportantOnce deleted, a log filter rule is permanently removed and stops filtering matching logs.
Custom delivery fields
On the Custom Delivery Fields tab, select the fields to deliver, and then click OK.
Log query
In the left-side navigation pane, choose Logs.
By default, when you open the log analysis page, the system automatically runs a query and displays the results.
In the search box, enter a search statement and an analytic statement.
A search statement is used to search and filter log data. You can use criteria like a time range, request type, or keyword to find specific data. A search statement can be used on its own. For more information about the syntax, see Query syntax and features.
An analytic statement is used to filter, transform, count, and aggregate log data. For example, you can calculate the average value of data over a period or obtain year-over-year and month-over-month results. An analytic statement must be used with a search statement in the format
search statement|analytic statement. For more information about the syntax, see Aggregate functions.To the right of the search box, click the
 icon to switch to the interactive query and analysis mode. You can use Data Explorer to quickly build search and analytic statements without writing SQL. For more information, see High-performance and high-precision query and analysis (Dedicated SQL).
Statements
Common search statements
Click Search & Analyze to view the query and analysis results. For more information, see View query and analysis results.
Query result analysis
You can view the results of your log query and analysis in modules such as the histogram and raw logs.
Histogram
The histogram shows the time distribution of the queried logs.
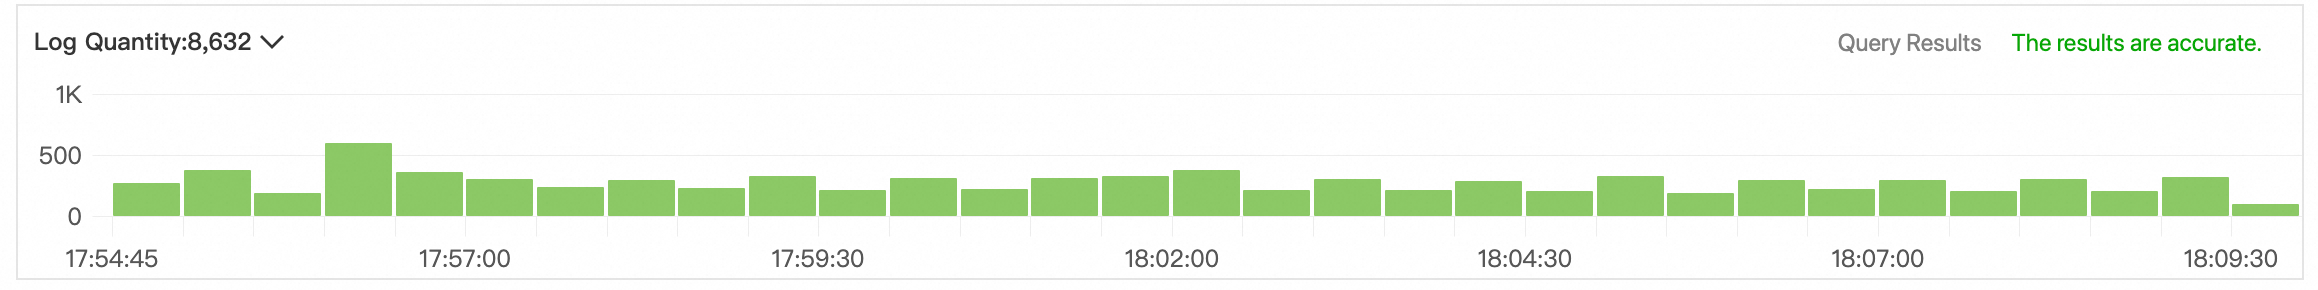
Hover over a green data block to view its time range and the number of log hits.
Double-click a green data block to view the log distribution with a finer time granularity. The Raw Logs tab is updated to show the query results for the specified time range.
Raw logs
The Raw Logs tab displays your query and analysis results. You can view the logs in raw mode or table format.
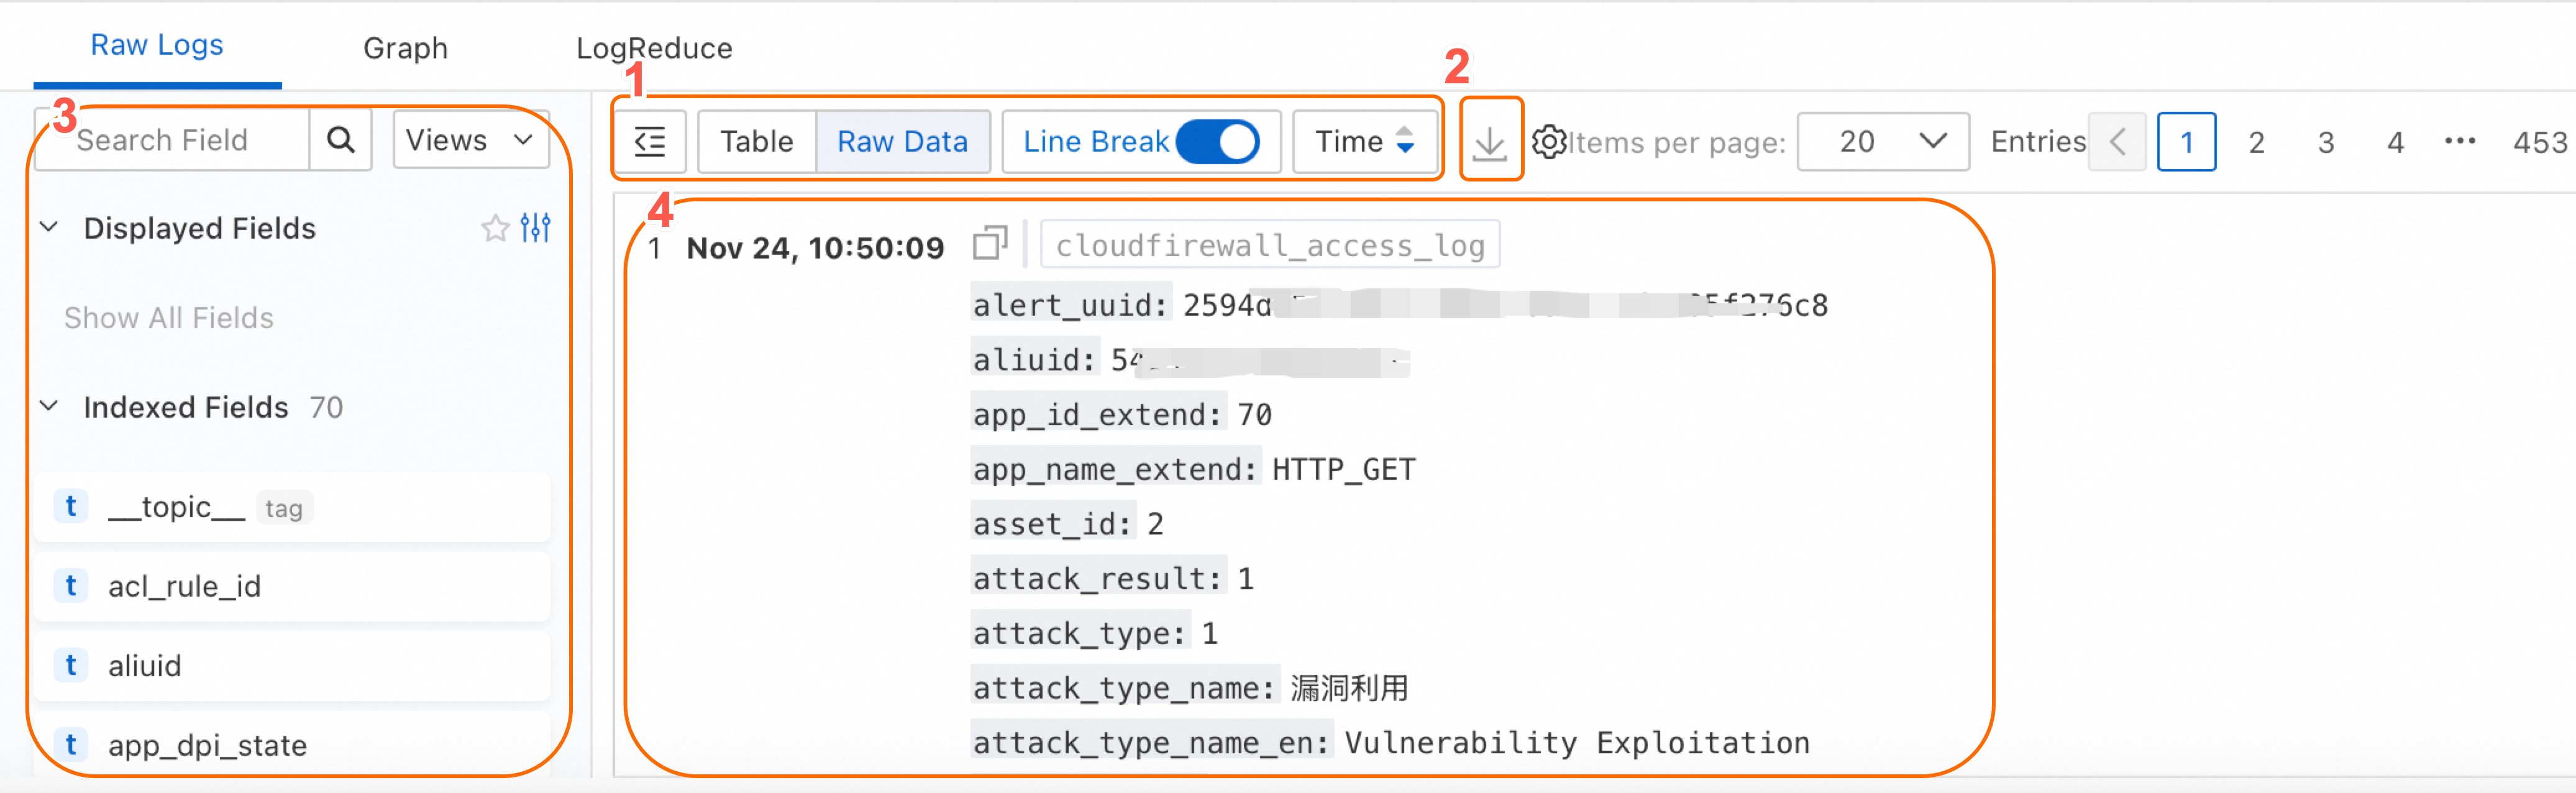
Number | Description |
Figure ① | Change the log display format, sort order, and other view options. |
Figure ② | Click the |
Figure ③ | Lists displayed, indexed, and system fields.
|
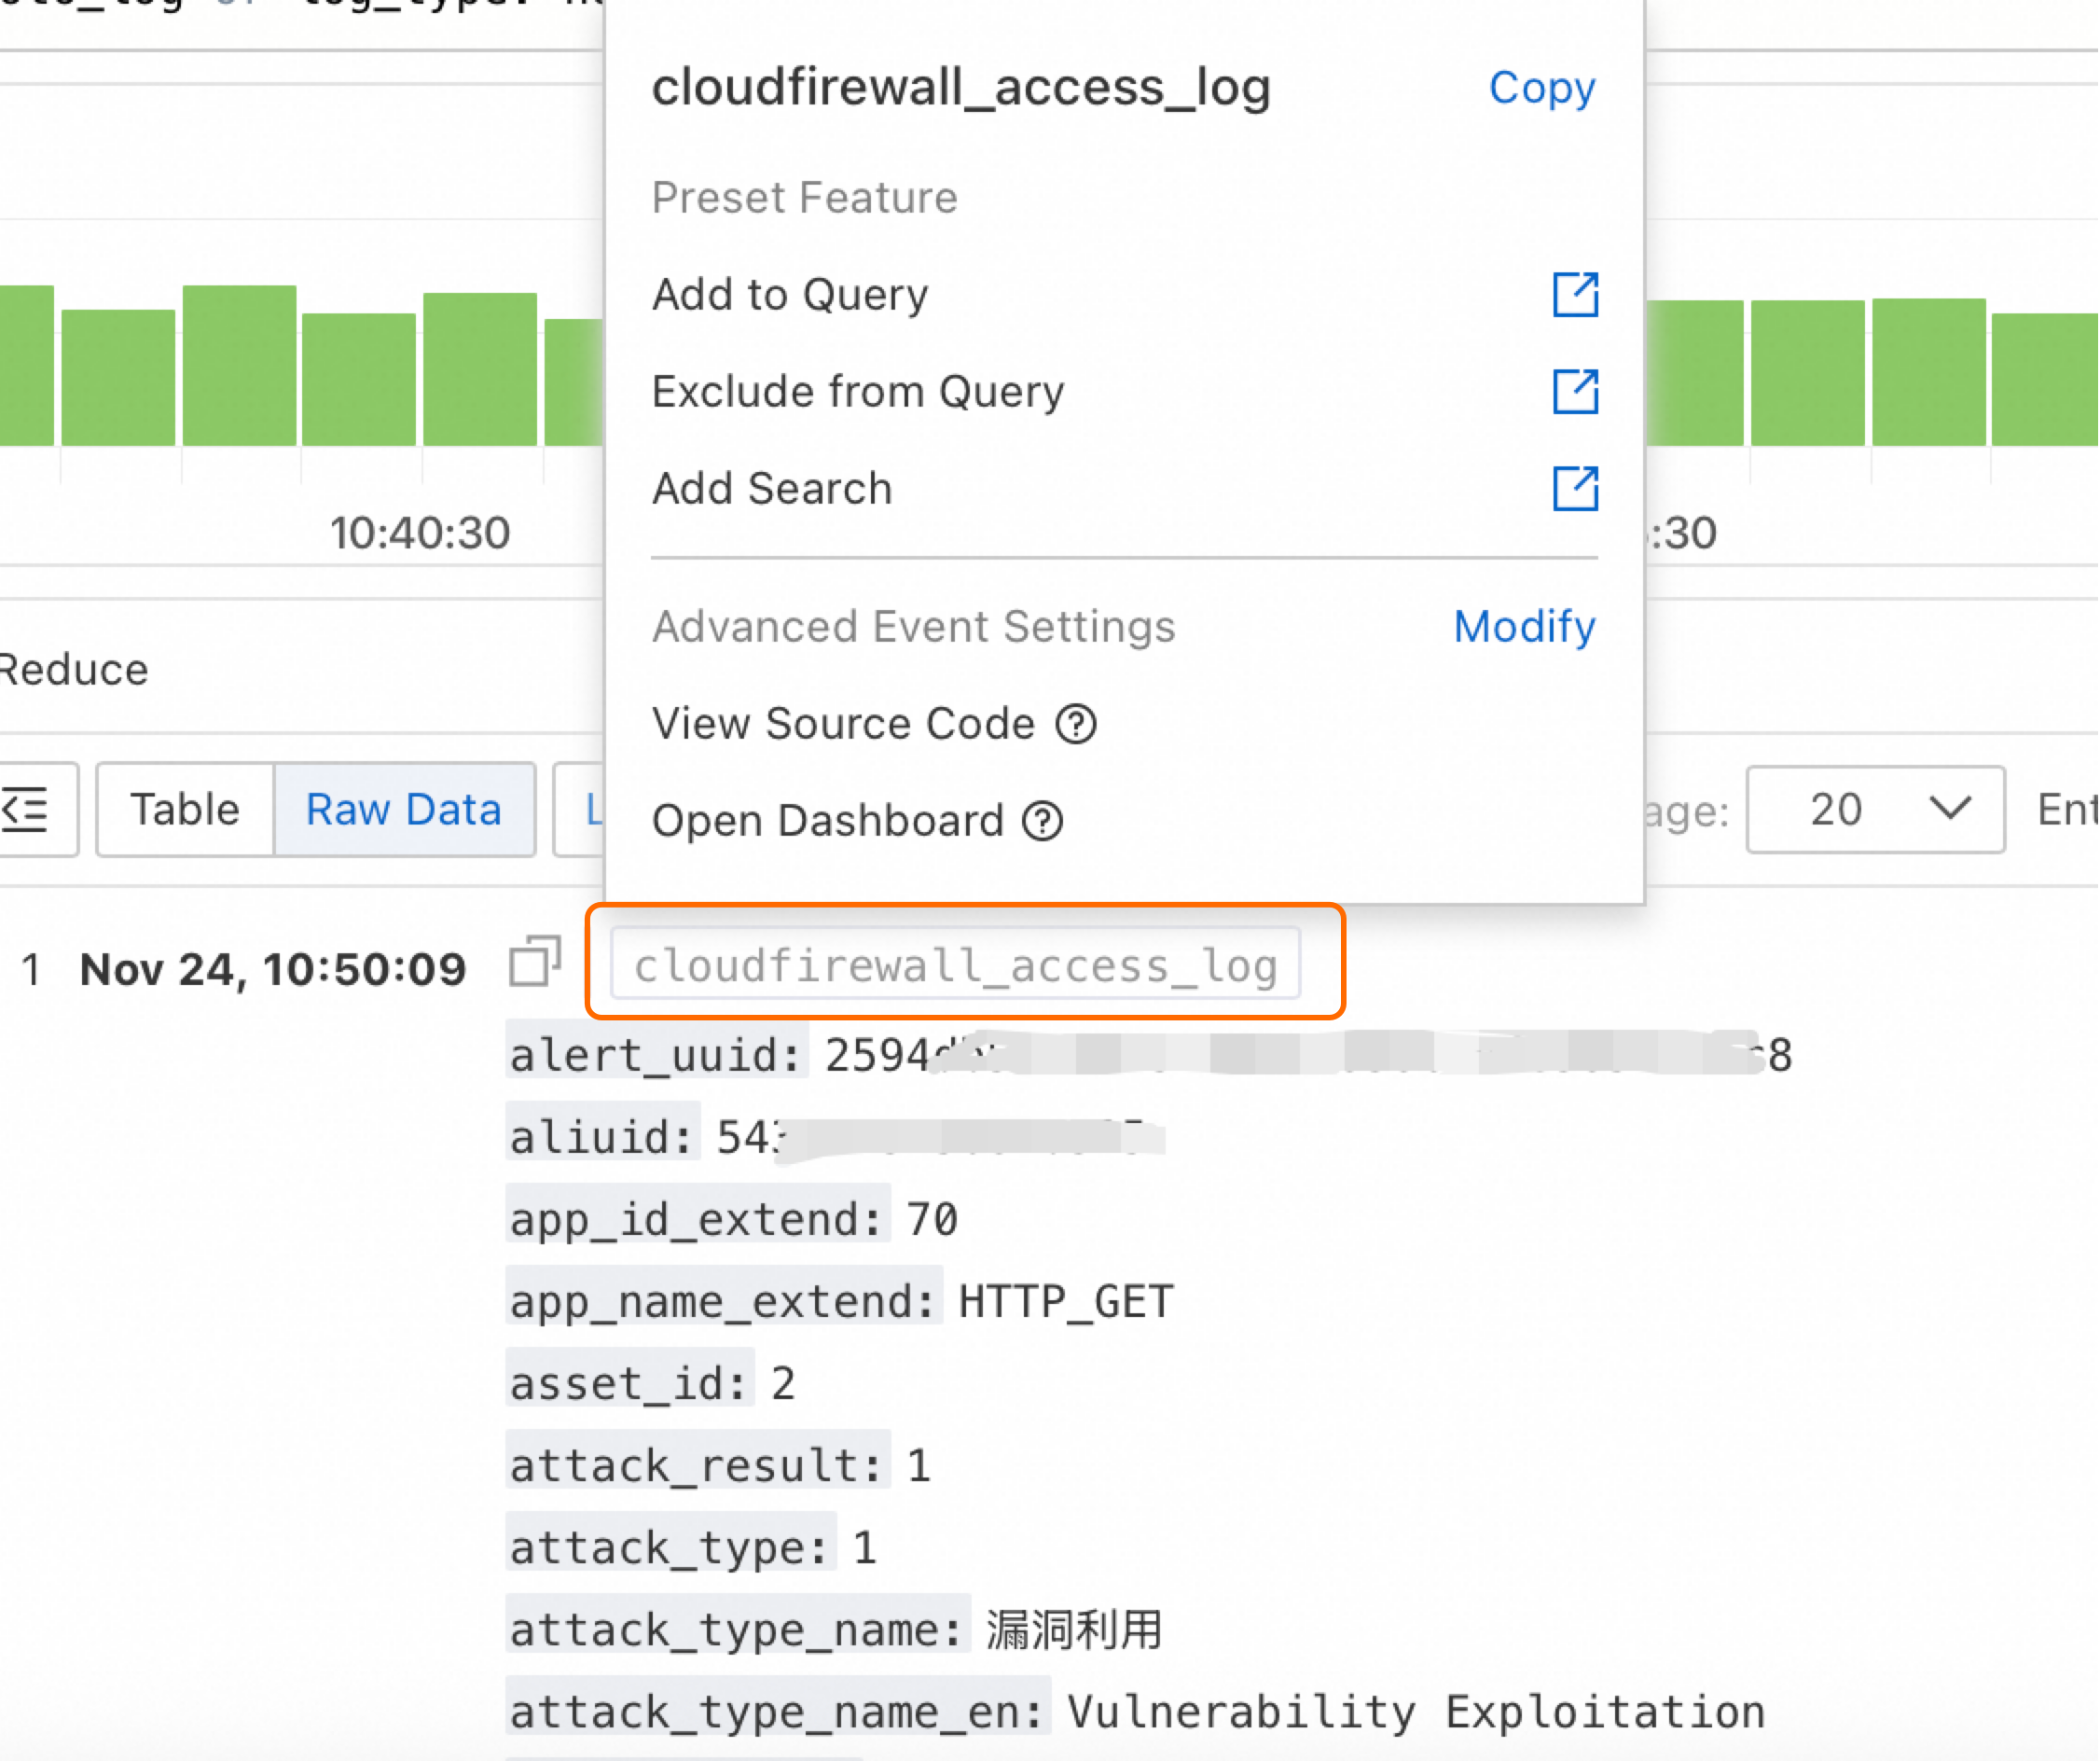
Figure ④ |
|
Related documentation
For a detailed description of log fields, see Log fields.
You can export the results of a query and analysis to your local computer for storage. For more information, see Export logs.
If you have a large volume of logs that require long-term storage, you can periodically ship logs to an OSS bucket for storage and analysis. For more information, see Create an OSS data shipping job (New).