Simple Log Service lets you configure field settings to enhance your interactive query experience and quickly analyze the distribution of a field over a specified time range.
Prerequisites
Enable the indexing and statistics features for the fields that you want to analyze. For more information, see Create an index.
For example, if an access log contains the request_method and request_time fields, you can use the configuration shown in the following figure.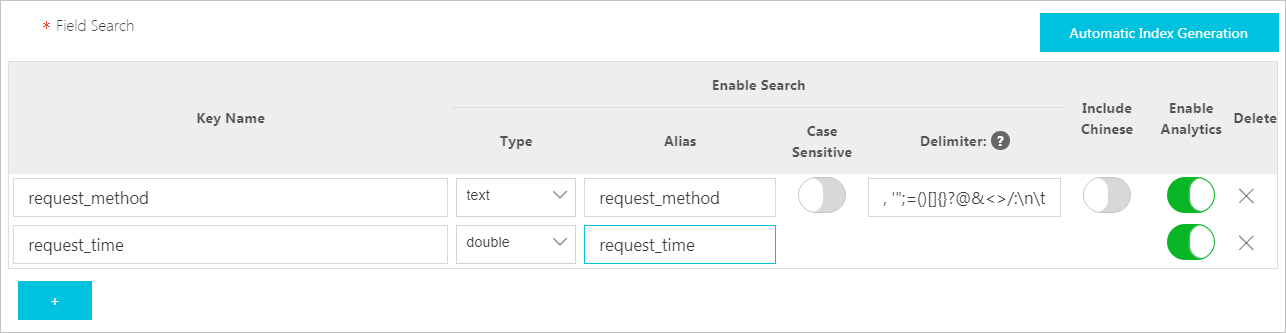
Features
-
Provides statistical analysis on the first 10 million log entries.
NoteWithin the selected time range, Simple Log Service samples the first 10 million log entries. If you generate an SQL statement from a quick analysis, you must remove the Limit 10000000 clause to analyze all logs.
-
Generate query statements from a field analysis.
-
For more information about field analysis, see Field analysis.
Procedure
Log on to the Simple Log Service console.
In the Projects section, click the one you want.

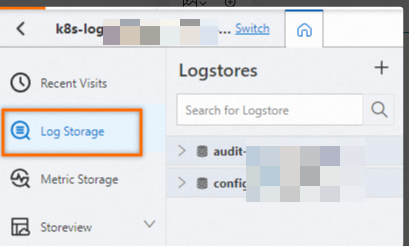
On the tab, click the logstore you want.
-
Click Raw Log.
-
On the Raw Log page, click Indexed Fields.
-
Click the
 icon next to a specific field.
 -
Click the
 icon under the target field to open the Aggregation tab, which displays a corresponding query and analysis statement.
This icon is the blue circular button to the right of More Metric Insights under the target field in the Quick Analysis pane on the left.
Column settings
-
Displayed Fields
These are the fields displayed as columns on the log page.
-
To reorder the columns, drag a field in the Displayed Fields list, or click the
 icon and then click Move to Left or Move to Right.
The menu also includes a Hide Column option to hide columns you do not need.
-
Click
 on the far right of a field under Displayed Fields or click , and then click Hide to hide the current field.
 -
Click Clear to remove all fields from the Displayed fields list. All fields from your logs are then displayed.
-
-
Indexed Fields
Fields for which an index has been created.
-
Other Fields
Fields without an enabled index and reserved fields. For more information about reserved fields, see Reserved fields.
Click the  icon to the right of a field in the Indexed Fields or Other Fields list to add it to the Displayed Fields list. The Raw Logs page then shows only the columns in the Displayed Fields list.
Saved searches
Prerequisite: Add fields from the Indexed Fields or Other Fields lists to the Displayed Fields list.
-
Click the
 icon next to Displayed fields and enter a View Name to save the current configuration as a saved search.
 -
Click Views to see your saved searches, including the configured field names.
-
Click the
icon to the right of a saved search to delete it.
Tag fields
Tag fields are displayed in the top row of the log page.
For example, the top row of a log entry might show null 1710483220 null, which corresponds to the tag field values for that log. Common tag fields include __tag__:__instance_id__, __tag__:__job__, __tag__:__project__, __tag__:__result_type__, __tag__:__schedule_time__, and __tag__:__trigger_time__.
Configure Tags
-
Click the
 icon.
icon. -
Click Tag Settings.
-
In the Tag Configurations dialog box, enter a field name in the Field for Search box and click the
 icon.
icon. -
Click the
 icon to set the field as a tag field.
 -
Click the
 icon to remove its tag status.
Related documents
For more information about the statistical analysis of specific fields, see Field analysis.