When application issues arise in production, pinpointing the root cause across distributed services requires correlating exceptions, database calls, and request latency in one place. The Scenario-based Analysis page in Application Real-Time Monitoring Service (ARMS) consolidates these diagnostic workflows into a single view, so you can investigate errors, identify slow queries, analyze request bottlenecks, and compare canary releases without switching between multiple dashboards.
After you install an ARMS agent and begin monitoring your applications, the page organizes diagnostics into four tabs:
| Tab | Use when you need to... |
|---|---|
| Exceptions | Find the most impactful errors and trace them to their root cause |
| Database | Identify slow queries and analyze database call patterns |
| Slow Requests Analysis | Surface the slowest endpoints across provided and dependent services |
| Full link grayscale | Compare performance between production and canary environments |
Filter and scope data
All tabs share a common set of filters in the upper-right corner of the page:
Time range -- Select a time period to narrow the data window.
Tags -- Click Filter by Tag to search for data with specific tags. To configure tags, see Application list.
Each tab also provides a Quick Filter panel for additional dimension-specific filtering (described per tab below).
Exceptions
Use the Exceptions tab to find the most frequent or impactful errors across your monitored applications, understand their distribution, and drill into root causes.
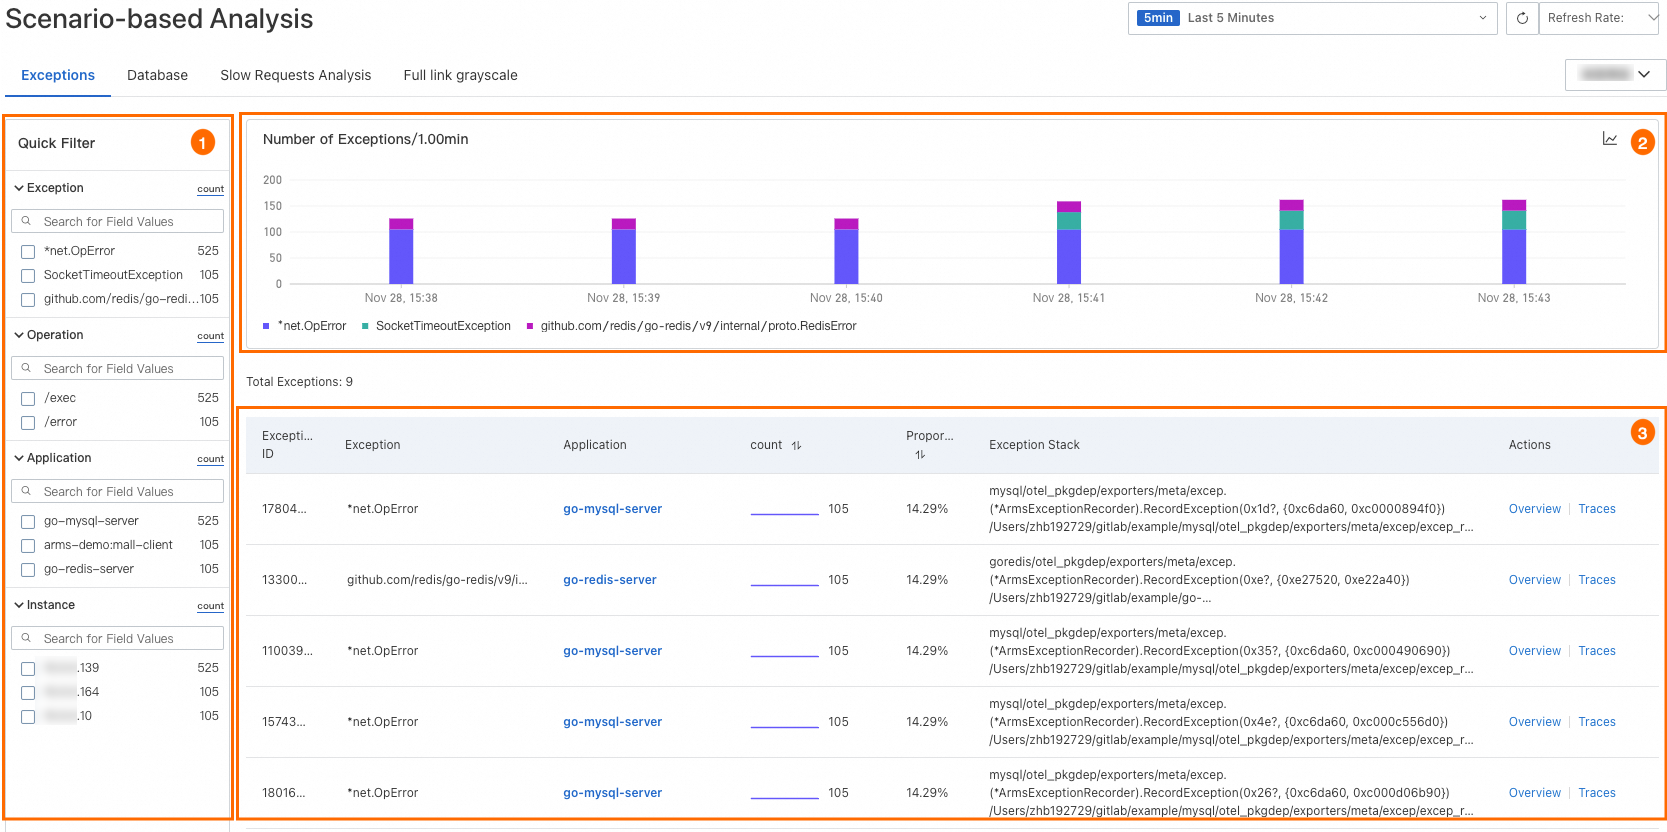
Filter exceptions
The Quick Filter panel lets you scope the view by exception name, interface, application name, or instance. Combine multiple filters to isolate a specific error pattern.
Analyze exception trends
The trend chart shows exception volume over the selected time period. Each bar is stacked by exception name, making it straightforward to spot which errors dominate.
To examine trends in more detail:
Click the
 icon to open a dialog where you can view metric data for a specific period or compare data across different dates.
Click the
 icon to switch between a column chart and a trend chart.
Review and act on exceptions
The table below the chart lists each exception with the following columns:
| Column | Description |
|---|---|
| Exception name | Name of the exception |
| Application | Application that threw the exception |
| Occurrences | Total count within the selected time range |
| Percentage | Share of all exceptions |
| Summary | Brief description of the exception |
From this table, you can:
View application monitoring data -- Click an application name to open its monitoring details. For more information, see View monitoring details (new).
Inspect exception details -- Click Overview in the Actions column. A panel opens with the exception trend, distribution across interfaces and instances, and abnormal stacks. Use this panel to understand which services and instances are affected by the exception.
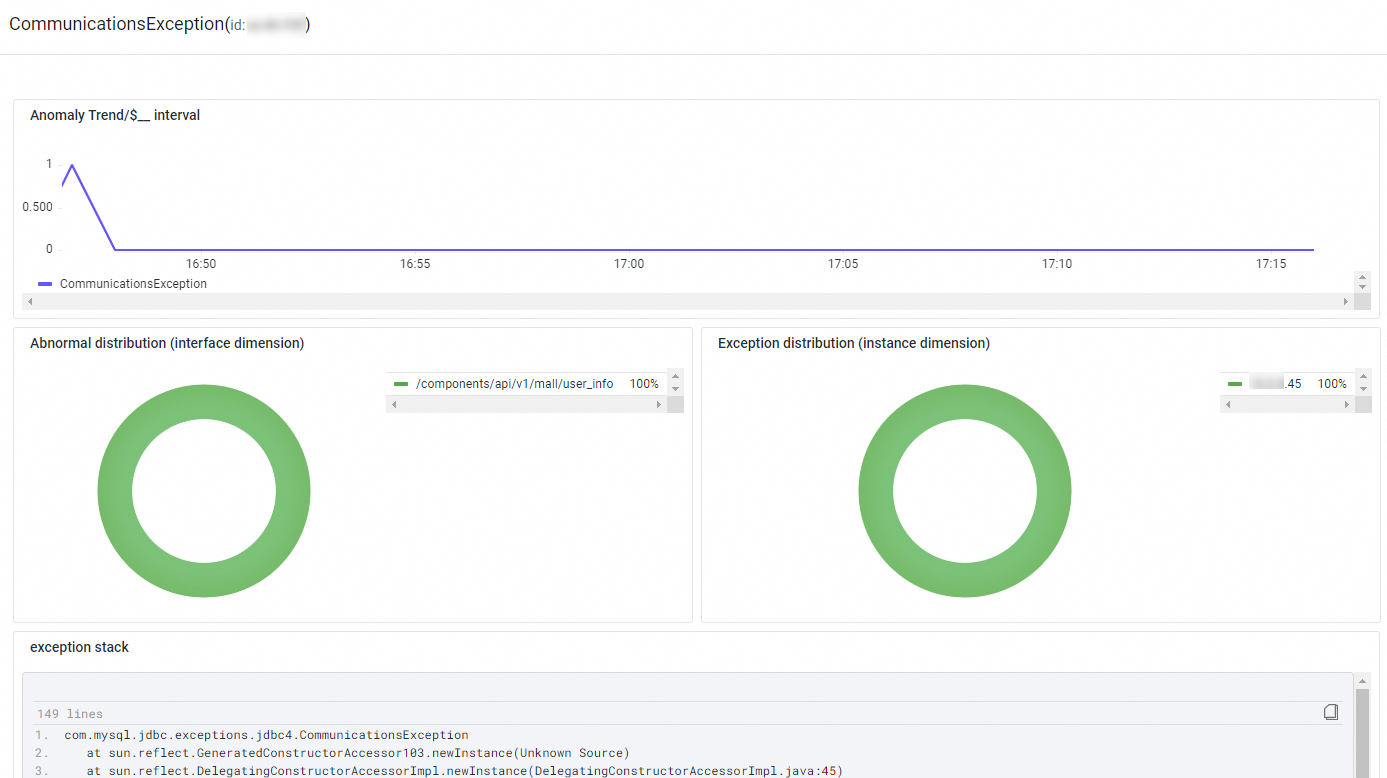
Trace affected requests -- Click Traces in the Actions column to see trace details for requests affected by this exception. For more information, see Trace Explorer.
Database
Use the Database tab to analyze database call patterns, identify slow queries, and determine which SQL or NoSQL statements need optimization.
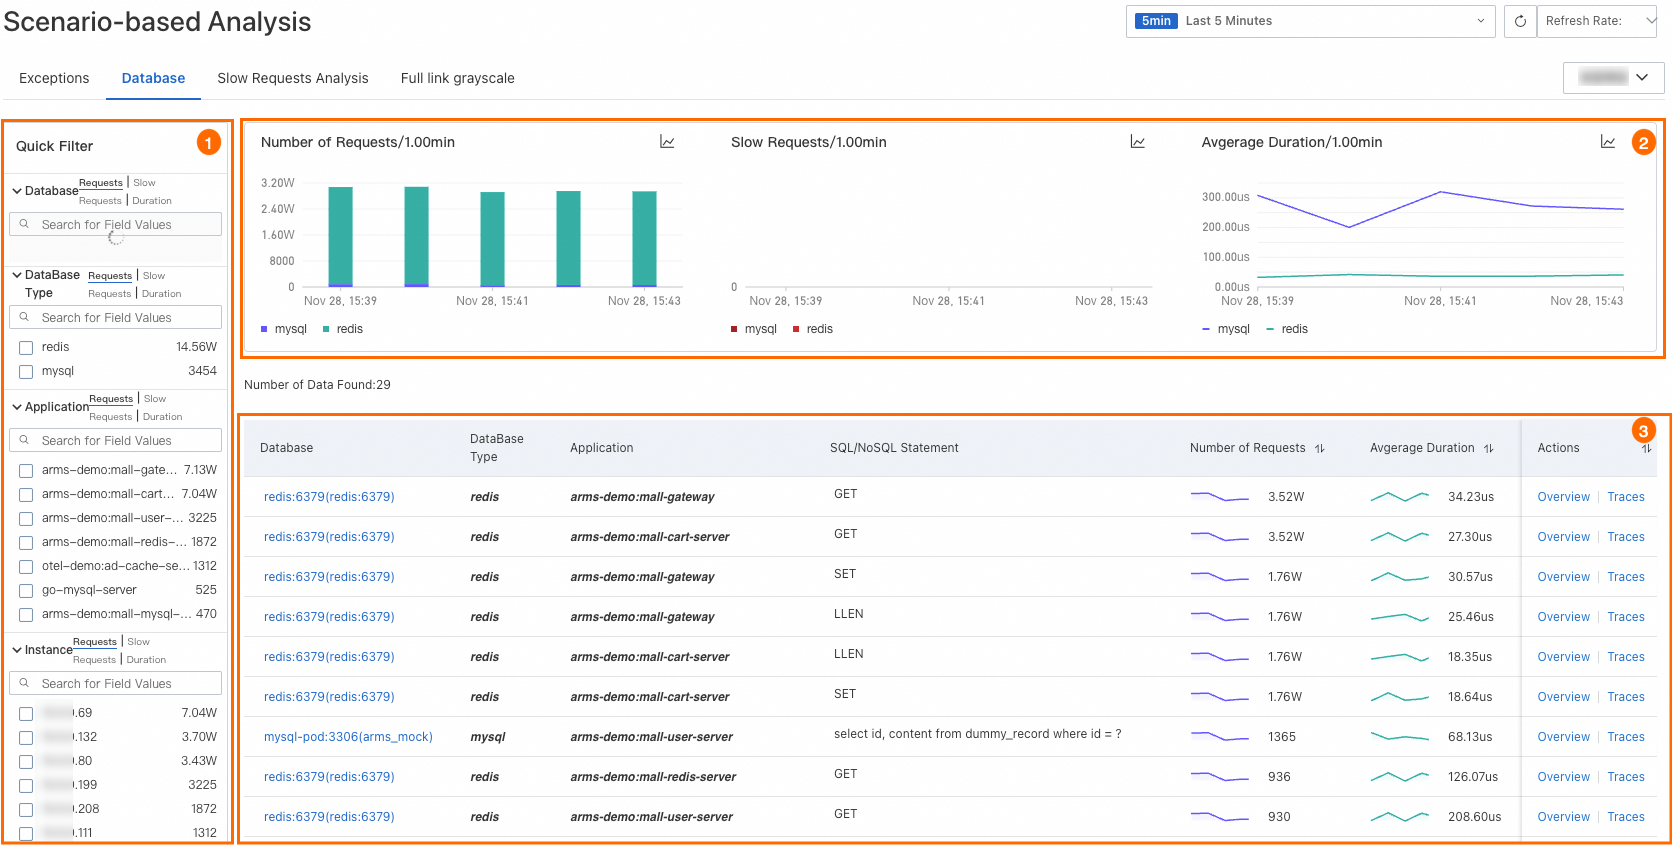
Filter database calls
The Quick Filter panel narrows the view by database name, database type, application, or instance.
Analyze database performance trends
Three trend charts show database request volume, slow calls, and average duration over the selected time period.
To examine trends in more detail:
Click the
 icon to view metric data for a specific period or compare data across different dates.
Click the
 icon to switch between a column chart and a trend chart.
Review and act on database calls
The table lists each database call with the following columns:
| Column | Description |
|---|---|
| Database name | Name of the database |
| Application | Application that made the call |
| SQL/NoSQL statement | Query or command executed |
| Requests | Total number of requests |
| Average duration | Mean response time per request |
| Slow calls | Number of slow calls |
From this table, you can:
View database call details -- Click a database name to see its call information. For more information, see Dependencies.
Inspect database call summary -- Click Overview in the Actions column. A panel opens with the request count, slow call count, average duration, and call distribution.
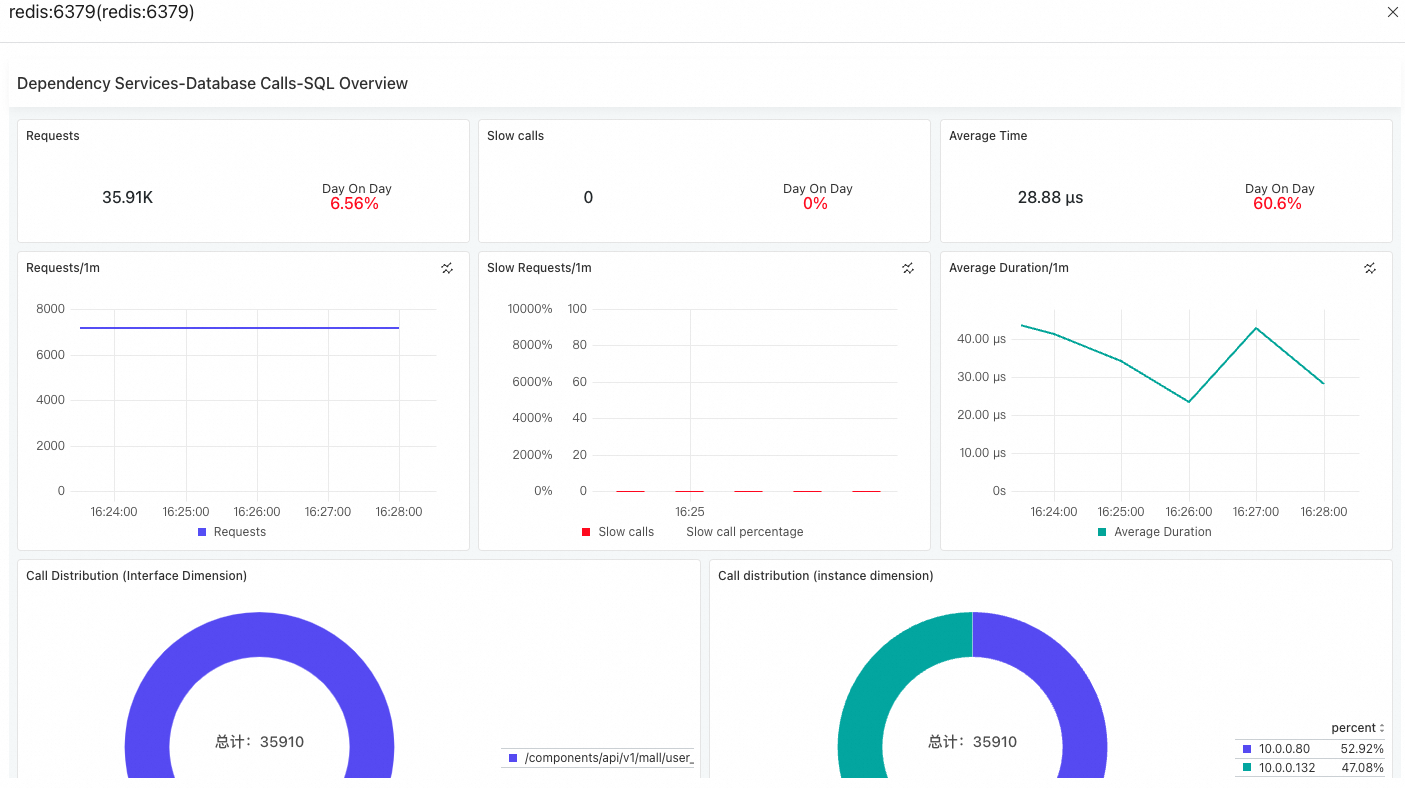
Trace specific calls -- Click Traces in the Actions column to see trace details for specific database calls. For more information, see Trace Explorer.
Slow requests analysis
Use the Slow Requests Analysis tab to surface the slowest endpoints in your application. The tab displays average duration trends across all related services and ranks the top 50 interfaces by latency for both provided services and dependent services.
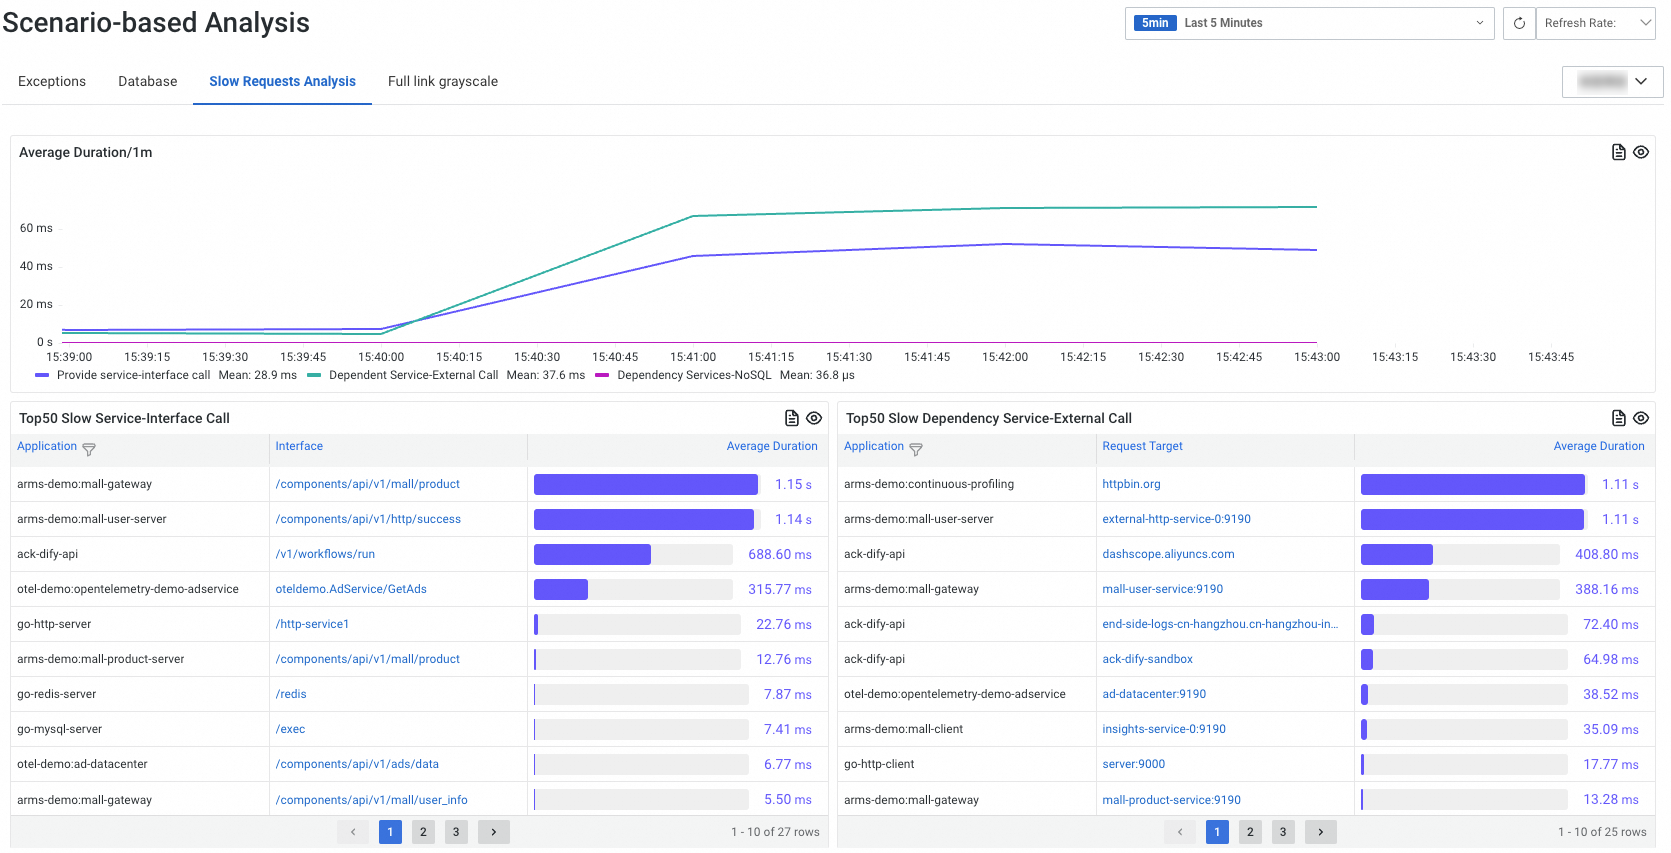
From this tab, you can:
View PromQL statements -- Click the
 icon in any section to display the Prometheus Query Language (PromQL) statements behind the chart. Use these statements to build custom dashboards in Prometheus or Grafana.
Drill into traces -- Click an interface name to view trace details for that endpoint. For more information, see Trace analysis.
Full link grayscale
Use the Full link grayscale tab to view basic information of your applications in the production and canary environments and compare application performance. This helps you validate canary releases before a full rollout.
To display data on this tab, integrate your application with Microservices Engine (MSE) first. For more information, see Implement an end-to-end canary release by using MSE cloud-native gateways.
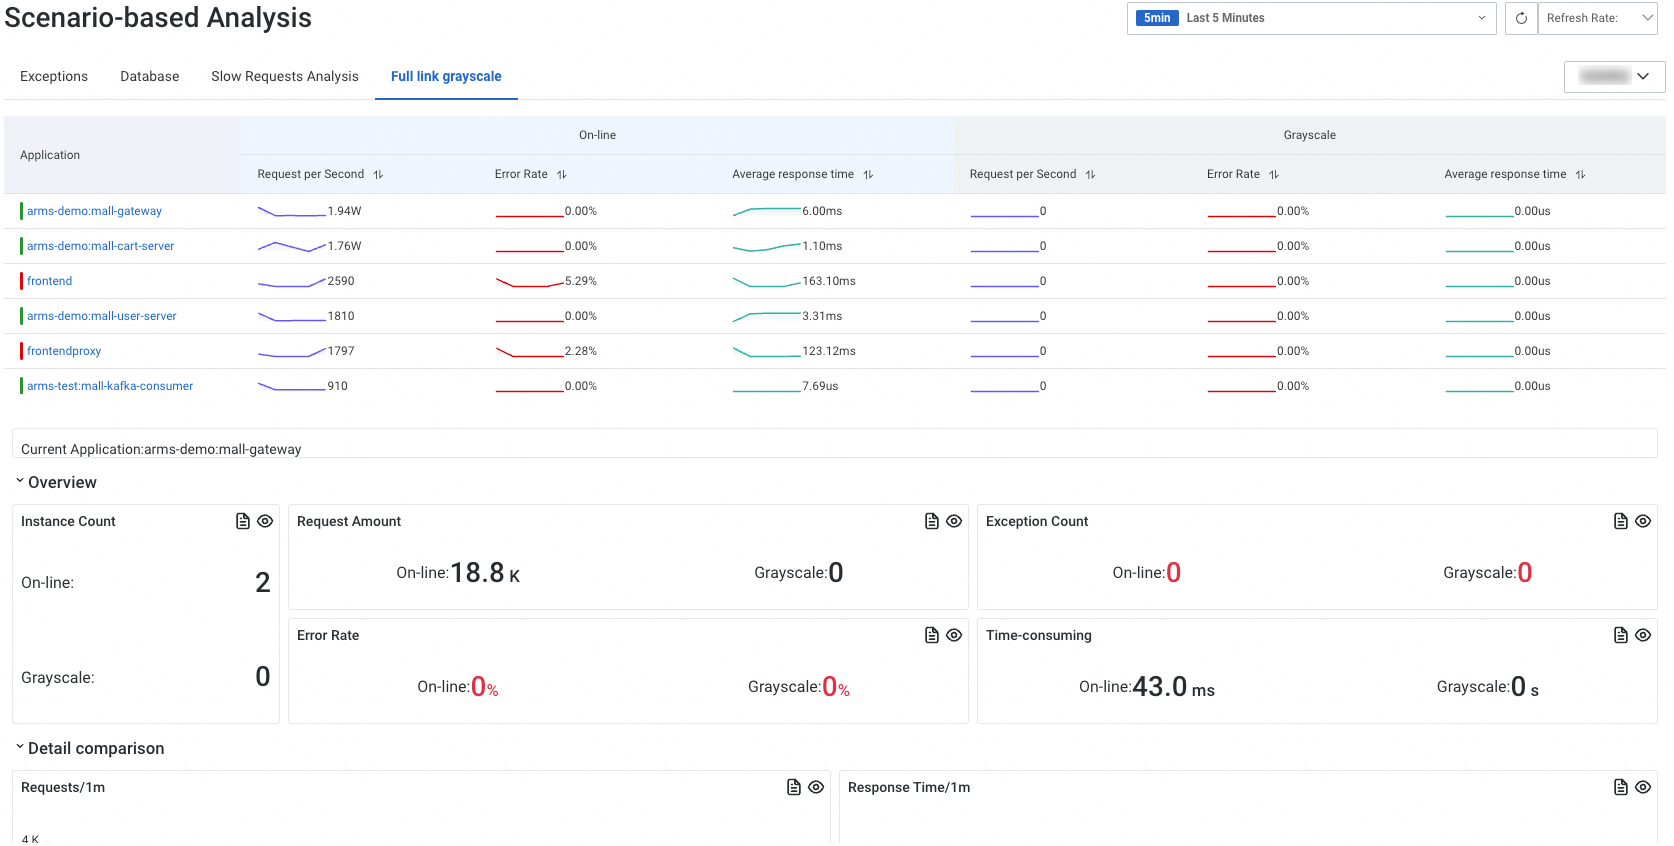
From this tab, you can:
View application details -- Click an application name to open its detail page.
View PromQL statements -- Click the
 icon in any section to display the PromQL statements. Use these statements to customize configurations in Prometheus or Grafana.