Application Real-Time Monitoring Service (ARMS) collects traces, analyzes performance, and provides alerting for Python applications running in Container Service for Kubernetes (ACK) clusters -- without requiring code changes to your application.
To monitor Python applications in other environments, see Application monitoring.
How it works
ARMS monitors Python applications in ACK through three components:
ack-onepilot -- An ACK add-on that connects Java, Go, or Python applications deployed in ACK clusters to ARMS.
aliyun-bootstrap -- A pip package that downloads and installs the ARMS Python agent in your container image.
aliyun-instrument -- A wrapper command that initializes the ARMS agent for Python and instruments data in a non-intrusive way.
After setup, traces and metrics flow automatically from your application to the ARMS console, where you can view them in real time.
Prerequisites
Before you begin, make sure you have:
An ACK managed cluster, ACK dedicated cluster, or registered cluster. See Create an ACK managed cluster
A Python application that uses a supported framework or library
Application Monitoring activated with pay-by-observable-data billing enabled. A free monthly quota of 50 GB is included. Unused quota does not roll over. For pricing details, see Billing
If your application uses Gevent, set the GEVENT_ENABLE environment variable to true.
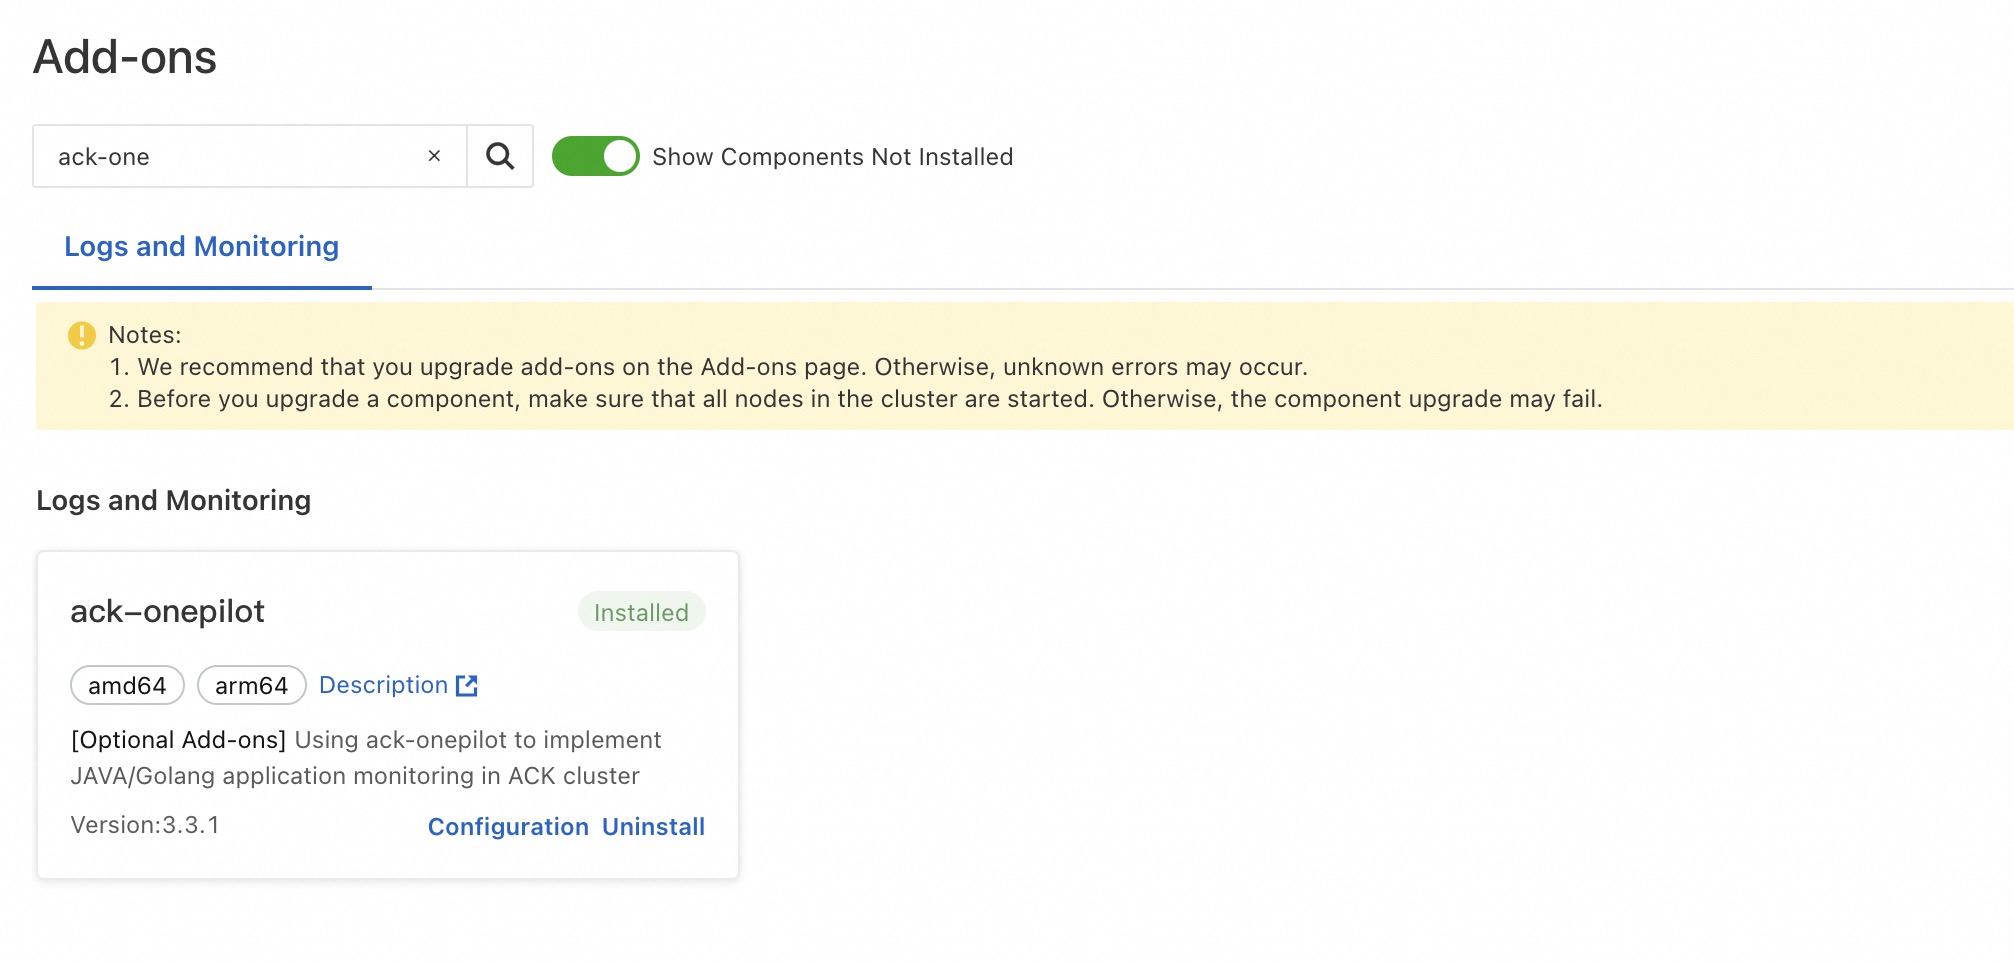
Step 1: Install the ack-onepilot add-on
Log on to the ACK console. On the Clusters page, click the name of your cluster.
In the left-side navigation pane, click Add-ons. On the Add-ons page, search for ack-onepilot.
In the ack-onepilot section, click Install. In the dialog box, click OK.
The ack-onepilot version must be 3.2.4 or later.
Step 2: Update the Dockerfile
Add the ARMS agent to your container image by installing aliyun-bootstrap and wrapping your application startup command with aliyun-instrument.
Before (original Dockerfile)
# Use the base image for Python 3.10.
FROM docker.m.daocloud.io/python:3.10

# Set the working directory.
WORKDIR /app

# Copy the requirements.txt file to the working directory.
COPY requirements.txt .

# Install dependencies using pip.
RUN pip install --no-cache-dir -r requirements.txt

COPY ./app.py /app/app.py
# Expose port 8000 of the container.
EXPOSE 8000
CMD ["python","app.py"]
After (with ARMS agent)
# Use the base image for Python 3.10.
FROM docker.m.daocloud.io/python:3.10

# Set the working directory.
WORKDIR /app

# Copy the requirements.txt file to the working directory.
COPY requirements.txt .

# Install dependencies using pip.
RUN pip install --no-cache-dir -r requirements.txt

# Install the ARMS Python agent
RUN pip3 install aliyun-bootstrap && aliyun-bootstrap -a install

COPY ./app.py /app/app.py

# Expose port 8000 of the container.
EXPOSE 8000

# Start the application through the ARMS agent
CMD ["aliyun-instrument","python","app.py"]
The two added lines do the following:
| Line | Purpose |
|---|---|
RUN pip3 install aliyun-bootstrap && aliyun-bootstrap -a install | Downloads and installs the ARMS Python agent |
CMD ["aliyun-instrument","python","app.py"] | Starts the application with non-intrusive instrumentation |
If you use Gunicorn with Uvicorn workers, the startup command looks like this:
aliyun-instrument gunicorn -w 4 -k uvicorn.workers.UvicornWorker -b 0.0.0.0:8000 app:appAfter updating the Dockerfile, rebuild and push the image to your container registry.
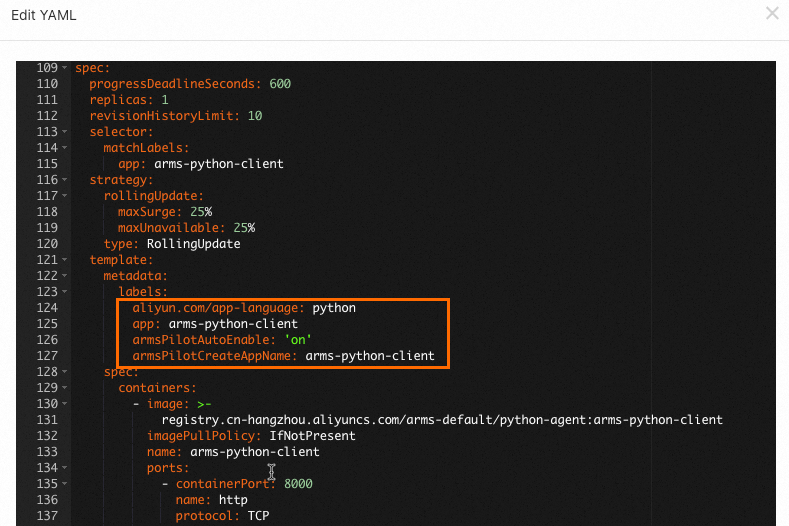
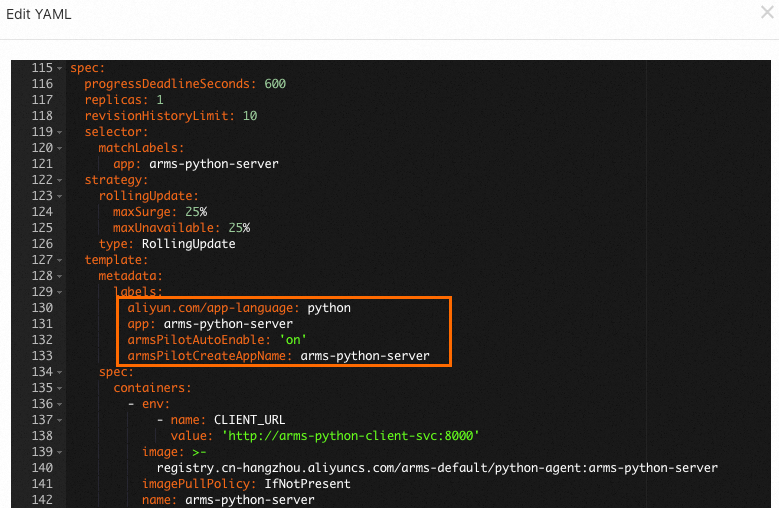
Step 3: Add monitoring labels to the deployment YAML
Add labels to your Deployment's pod template so ack-onepilot can identify and instrument the application.
In the left-side navigation pane of the ACK console, choose . Select the namespace where your Deployment resides. Find the Deployment and choose
 > Edit YAML in the Actions column.
In the Edit YAML dialog box, add the following labels under
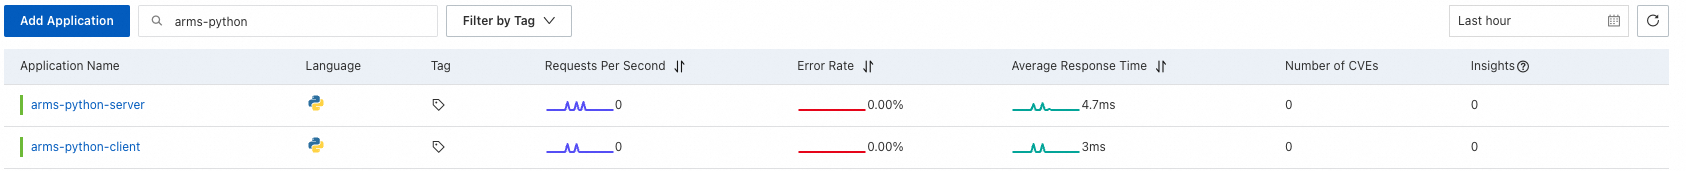
spec.template.metadataand click Update: Replace<your-deployment-name>with a name for your application.labels: aliyun.com/app-language: python # Specifies the application language. armsPilotAutoEnable: 'on' # Enables ARMS monitoring. armsPilotCreateAppName: "<your-deployment-name>" # Sets the display name in ARMS.After the Deployment redeploys automatically, wait 1 to 2 minutes for monitoring data to appear. Open the ARMS console and choose to verify. Your application should appear in the list. Click the application name to view its metrics. For more information, see View monitoring details.
View monitoring data
Once monitoring data starts flowing, the ARMS console provides several tools to analyze application performance.
Trace Explorer
Trace Explorer provides real-time trace analysis with customizable filters and aggregation. Use it to identify slow or failed requests.
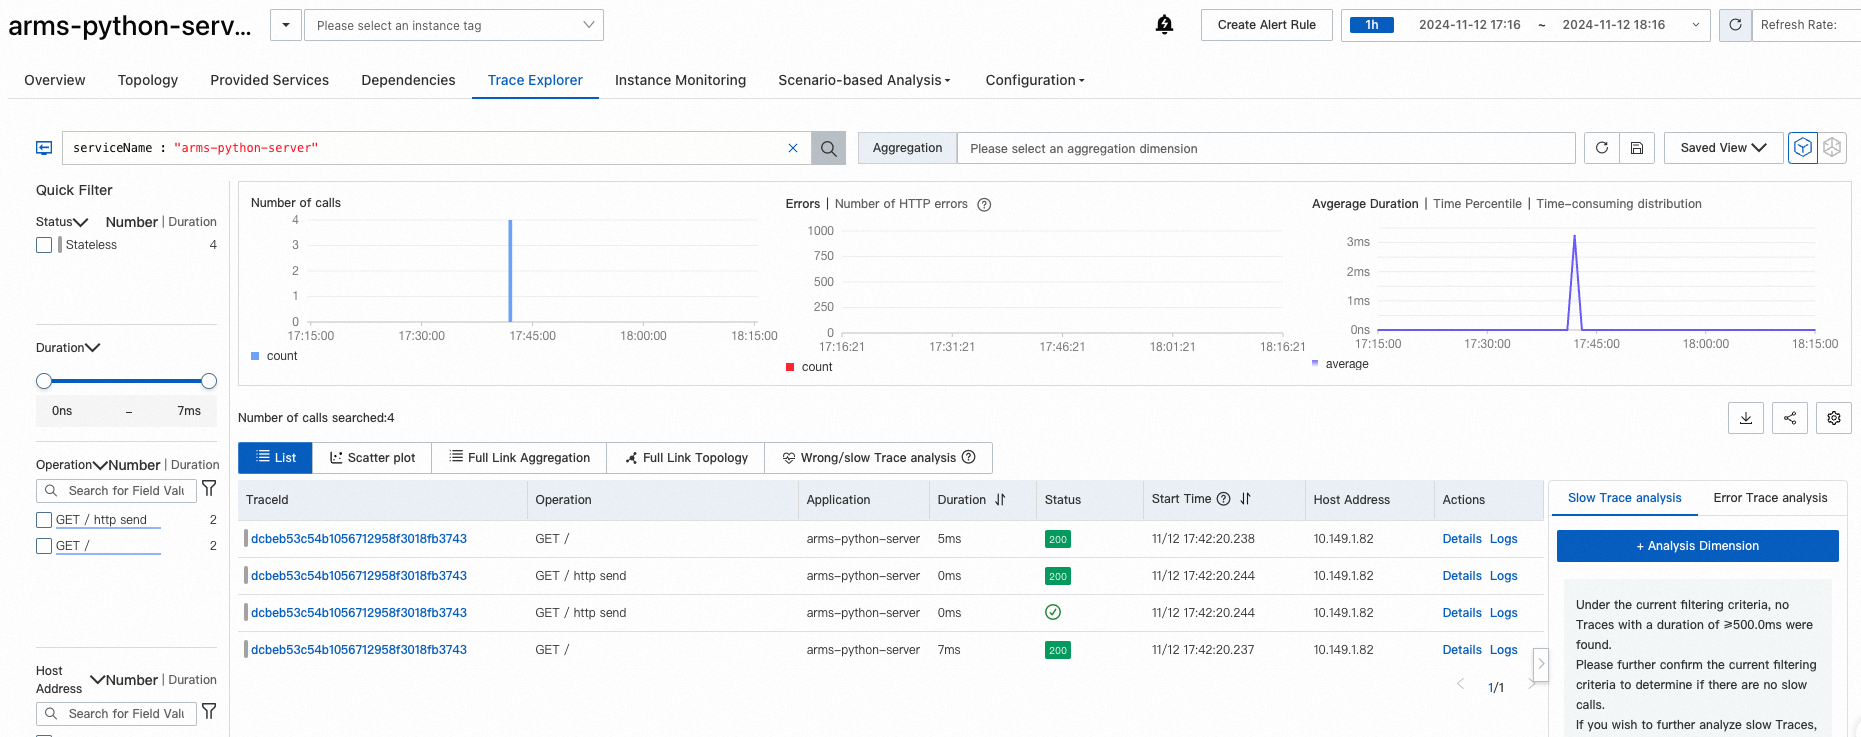
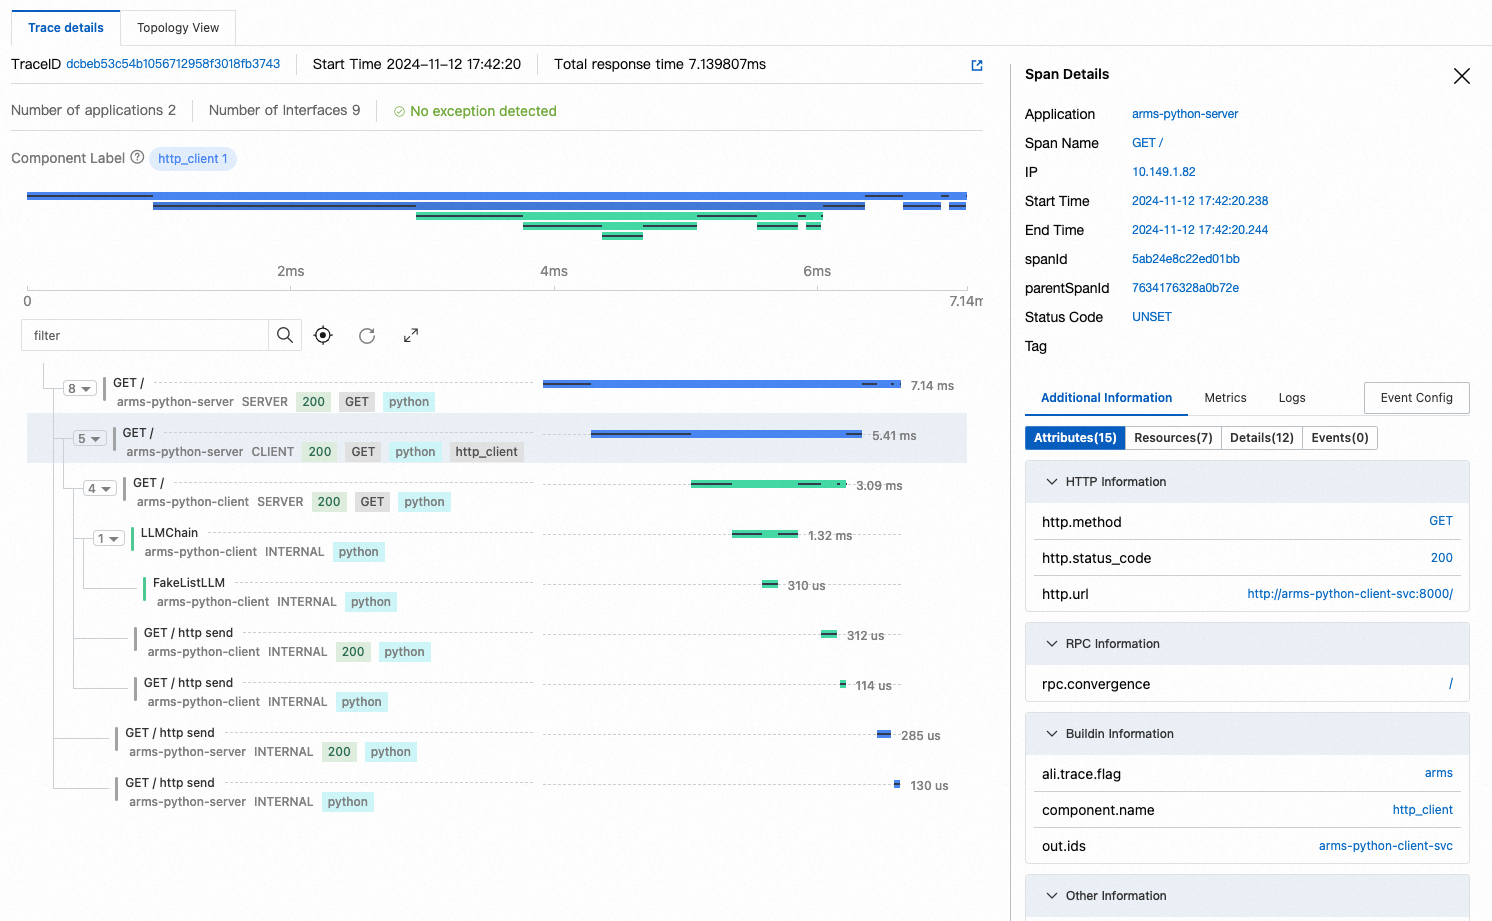
Click a trace to view the full call chain with timing breakdown for each span.
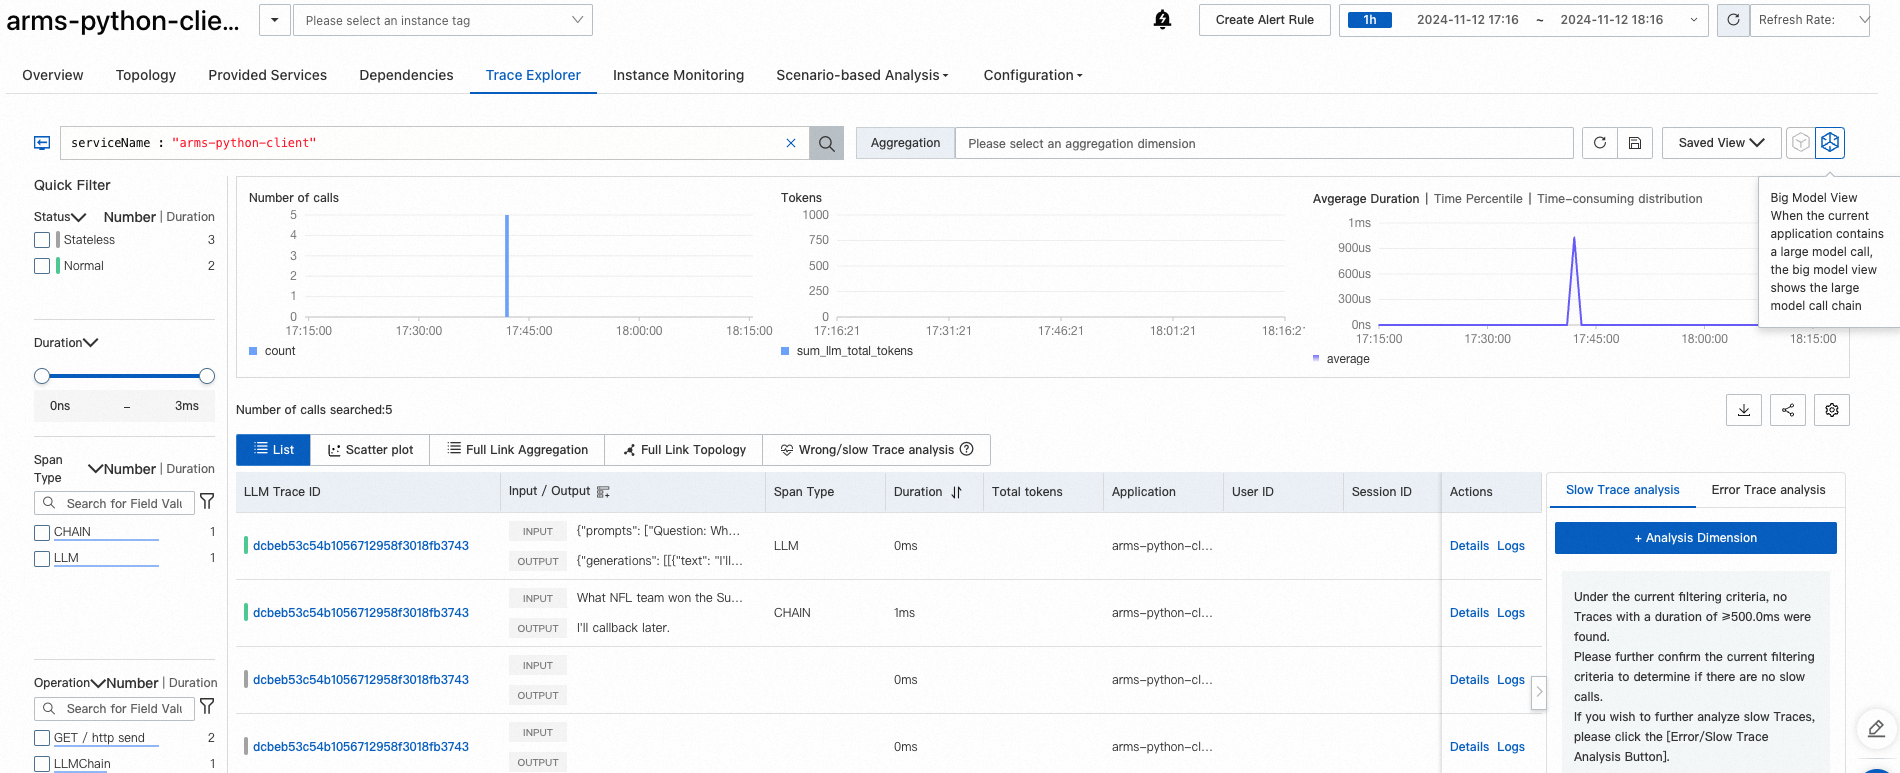
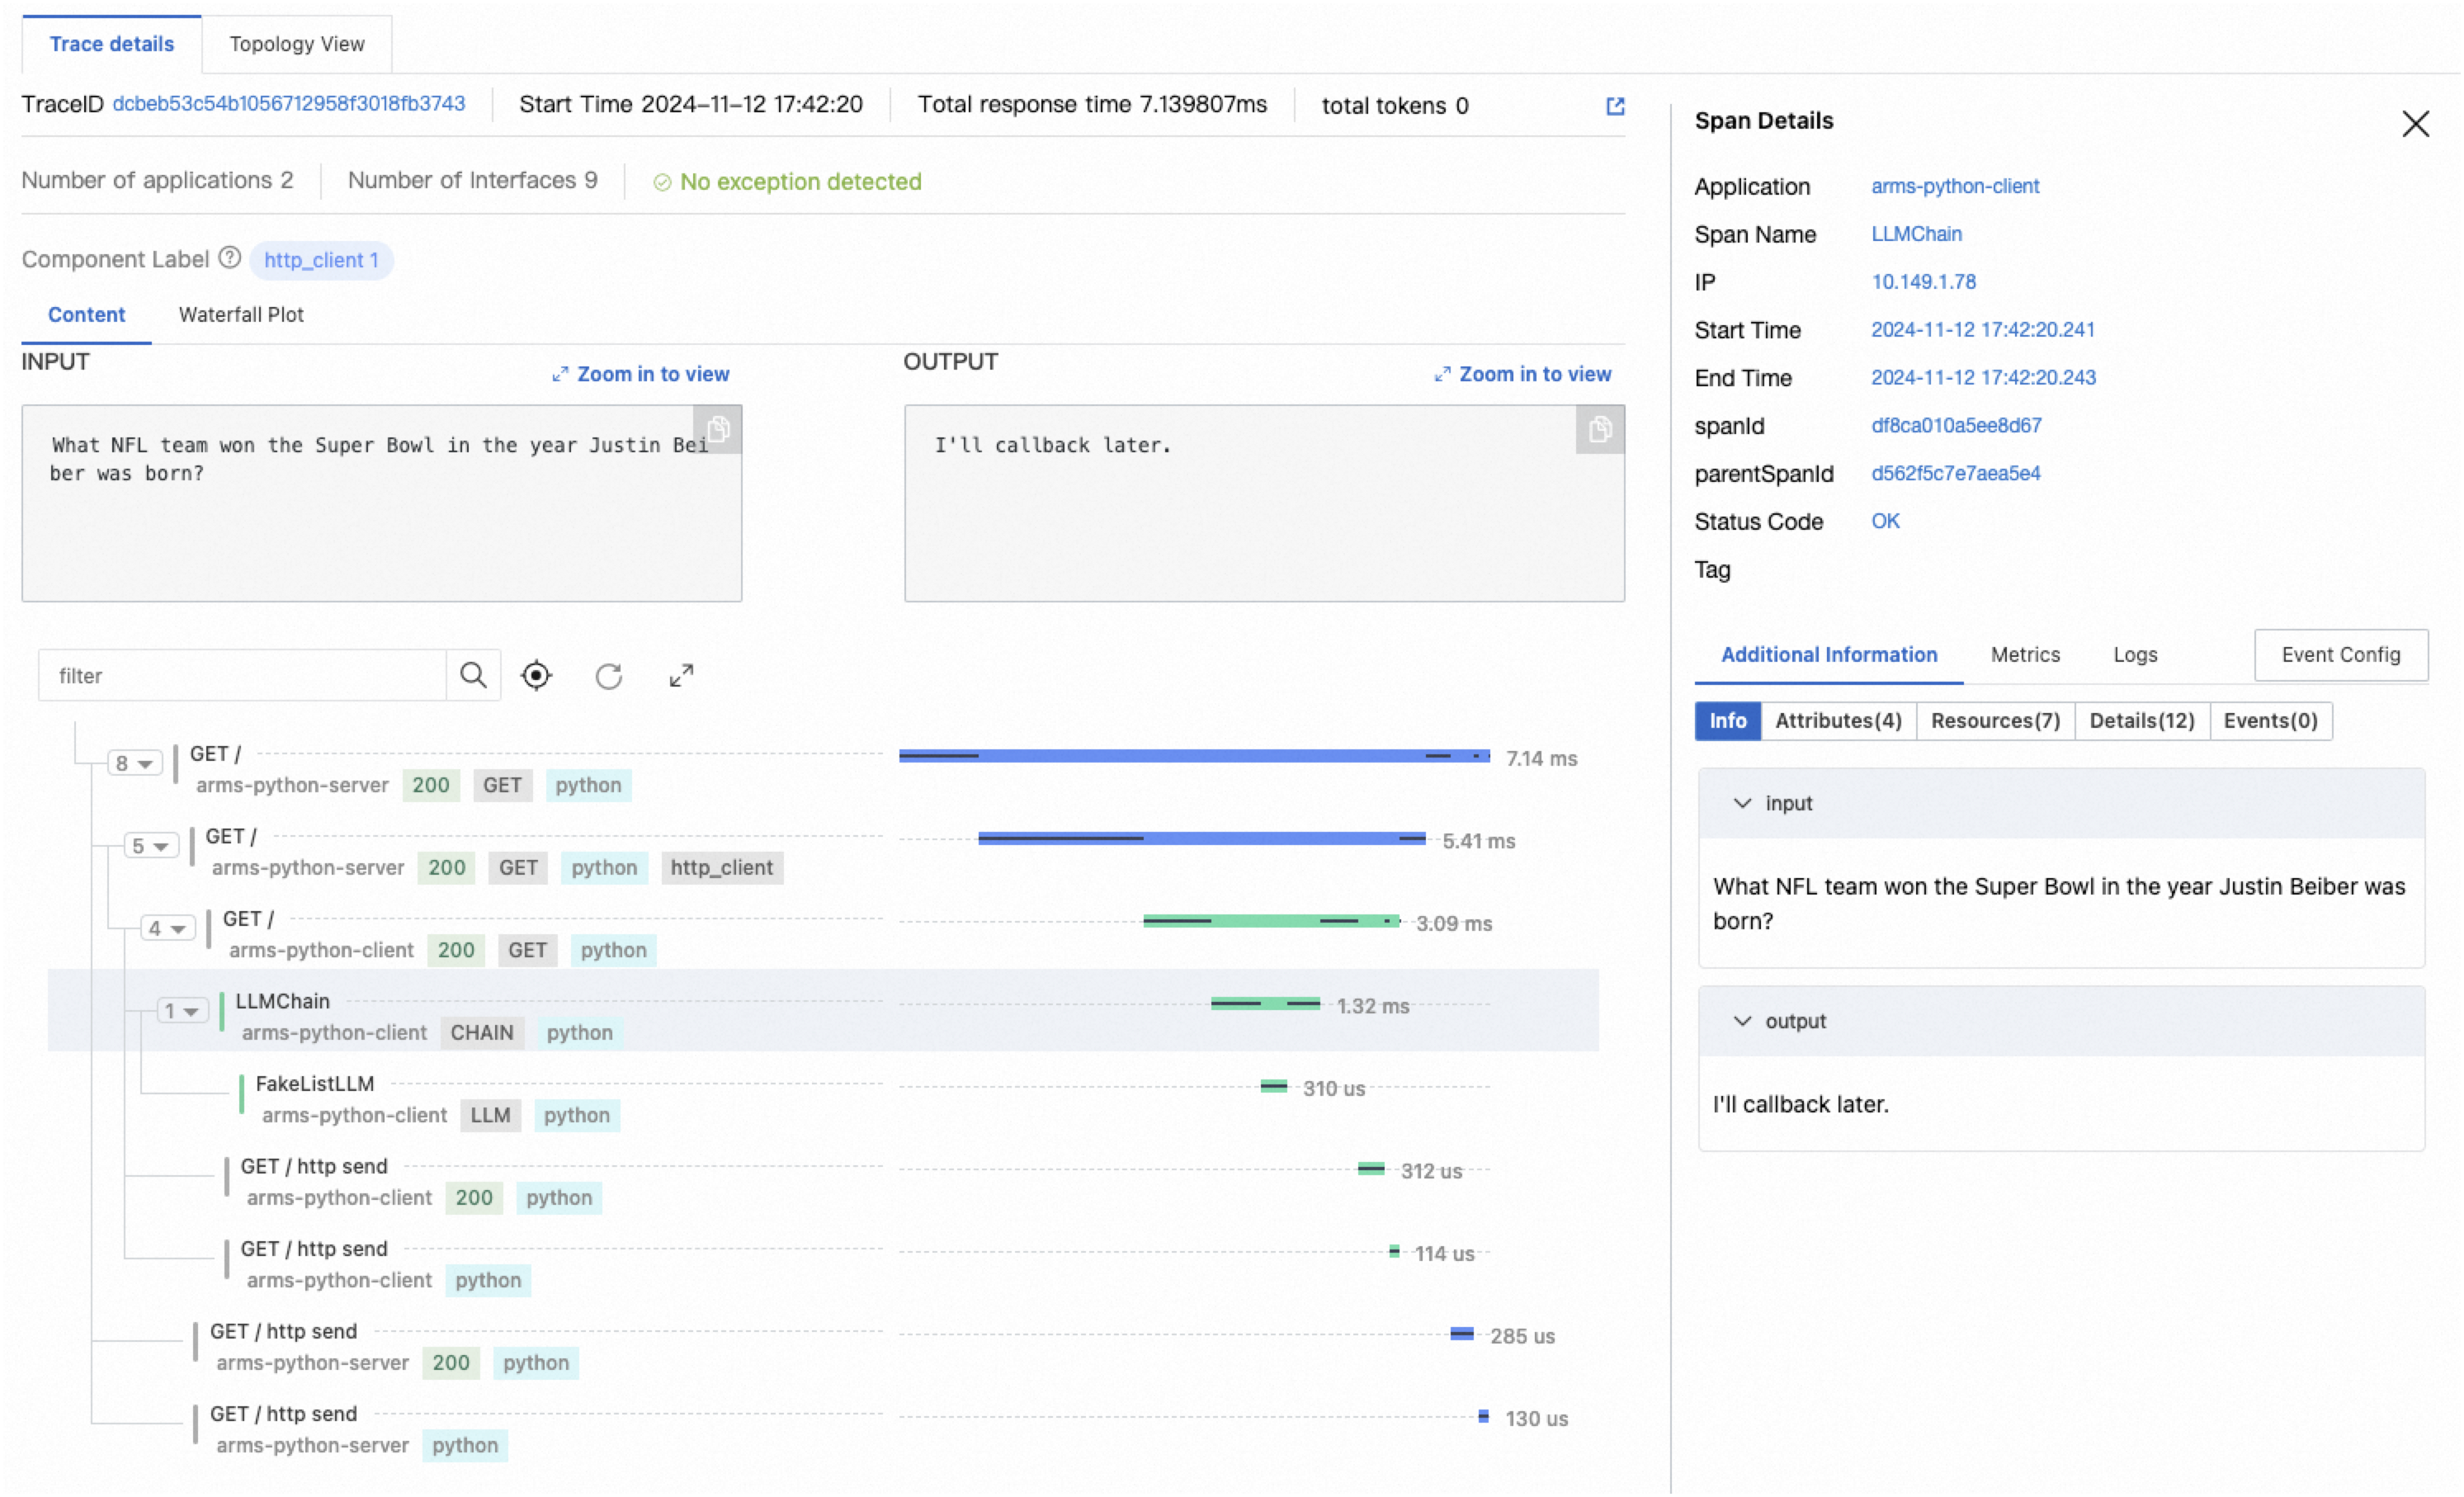
LLM trace view
If your application uses large language models (LLMs), switch to the LLM view for per-operation input/output details and token consumption metrics.
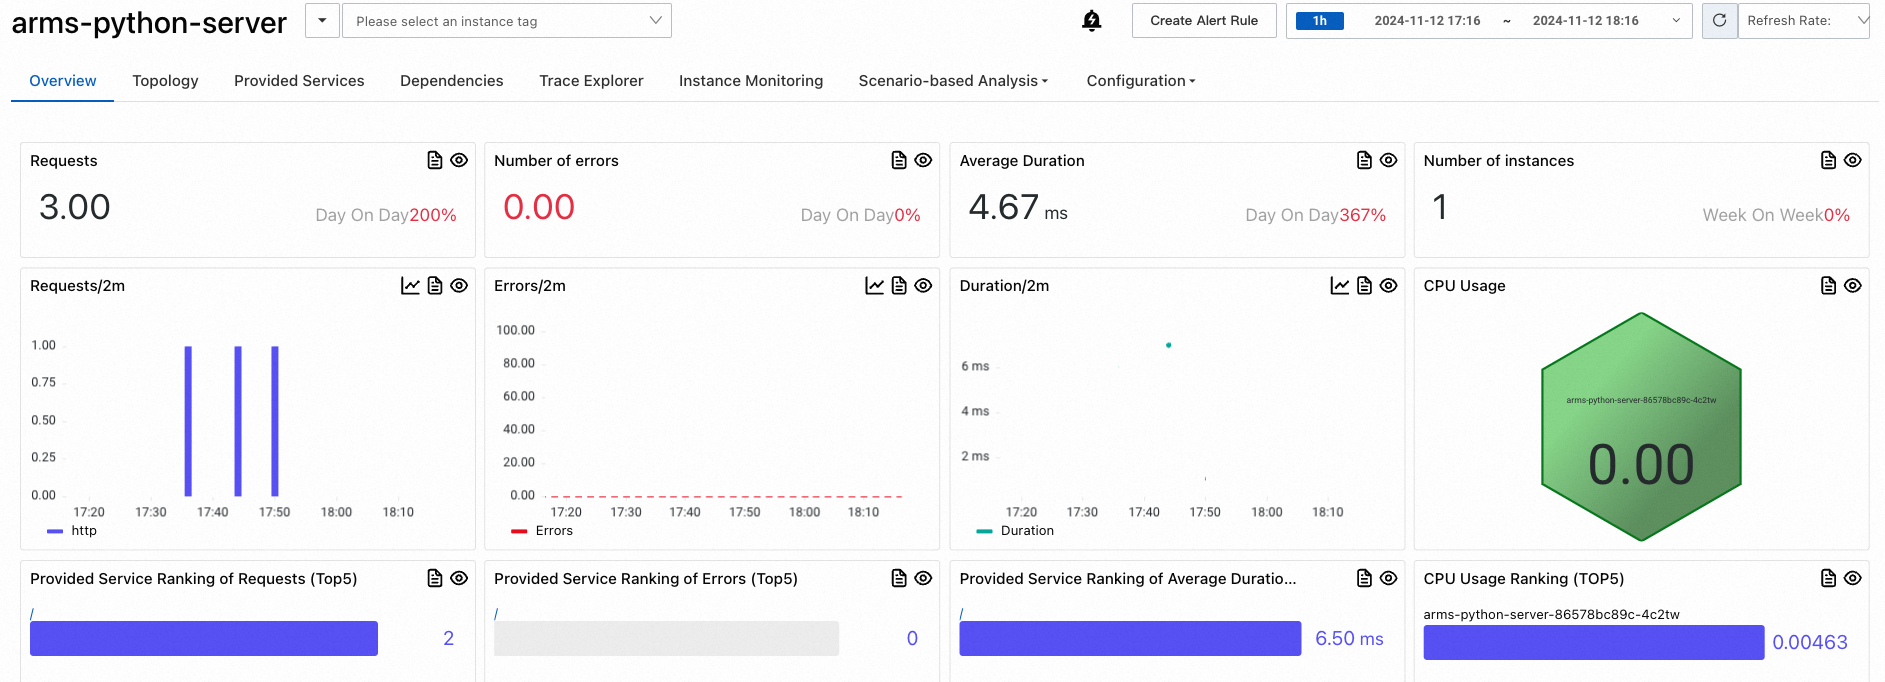
Metrics
The Application overview page shows request count, response time, and error rate.
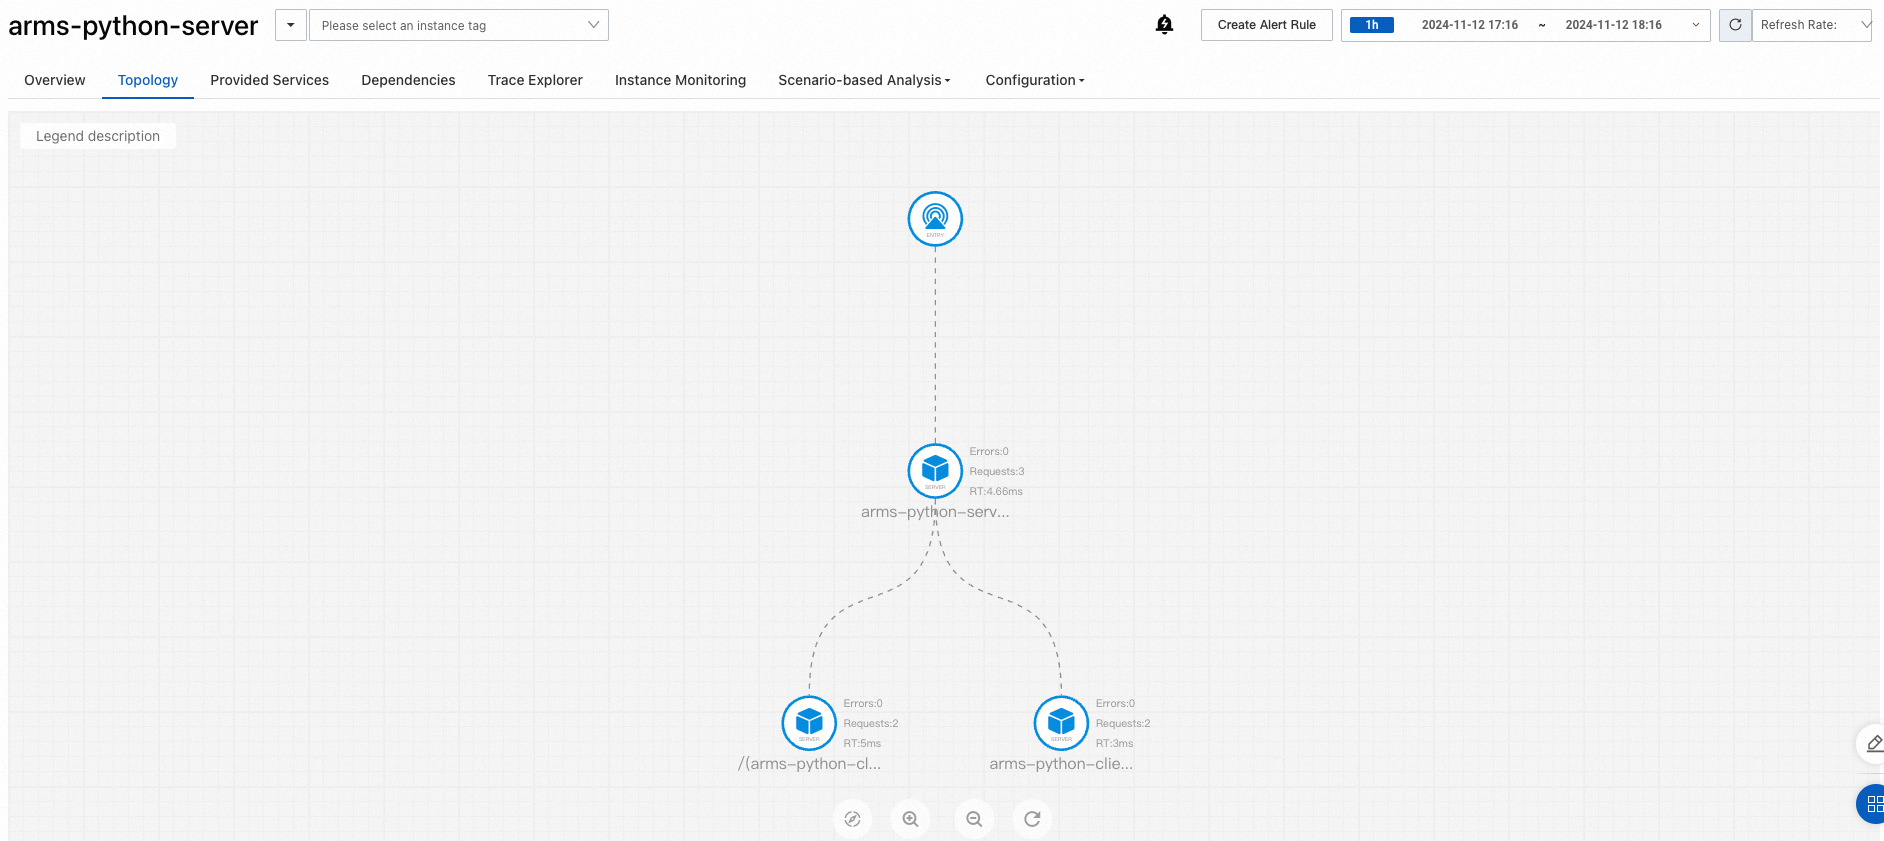
The Topology view maps dependencies between services, helping you identify bottlenecks and failure points across your microservice architecture.
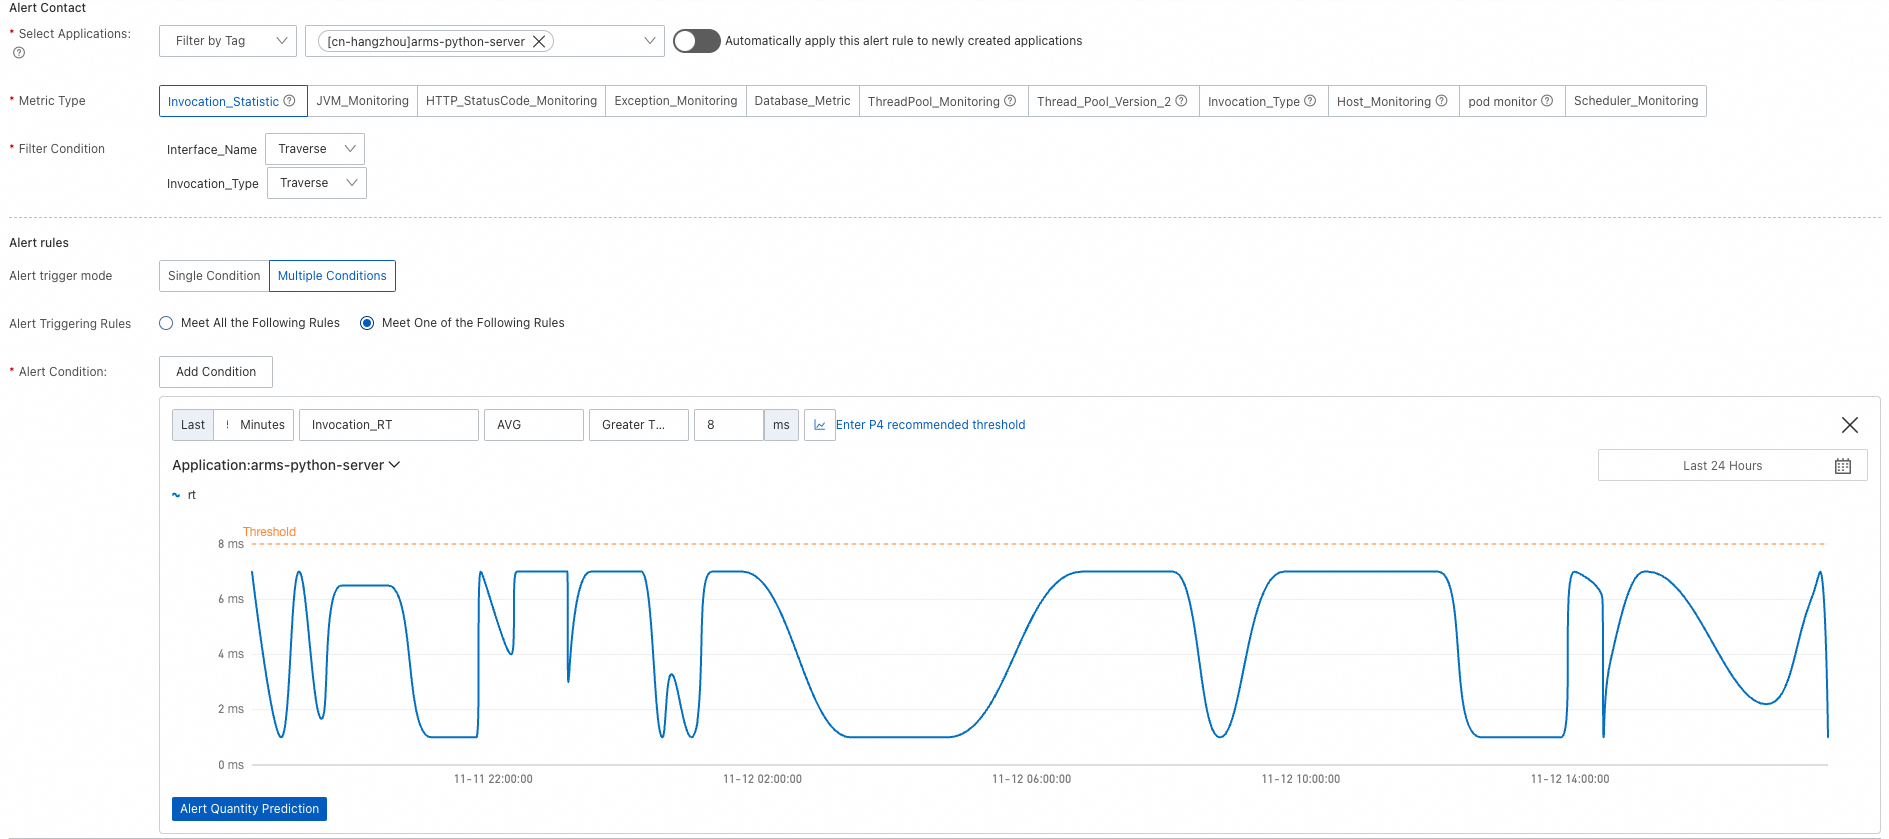
Set up alerting
Configure alert rules to receive notifications when application metrics exceed defined thresholds. Notifications can be sent to contacts or DingTalk group chats. For details, see Alert rules.
Clean up
After completing this tutorial:
To continue monitoring, make sure your Alibaba Cloud account has no overdue payments.
To stop monitoring, uninstall the ARMS agent.
(Optional) Deploy a sample application
If you do not have a Python application ready, use the following YAML template to deploy a demo client-server application. For more information, see Create a stateless application by using a Deployment.
The template creates the following resources in the arms-demo namespace:
| Resource type | Name | Description |
|---|---|---|
| Deployment | arms-python-client | A FastAPI app that calls a LangChain LLM chain |
| Deployment | arms-python-server | A FastAPI app that calls the client service |
| Service | arms-python-client-svc | Exposes the client on port 8000 |
| Service | arms-python-server-svc | Exposes the server on port 8000 |
To monitor the sample application, follow steps 1 through 3 above, using arms-python-client and arms-python-server as the armsPilotCreateAppName values.