Set up ARMS Application Monitoring to collect traces, track performance metrics, and configure alerting for Go applications running in Container Service for Kubernetes (ACK).
This guide covers ACK deployments. For other environments, see Application monitoring.
How it works
Monitoring a Go application in ACK involves three components:
ack-onepilot -- An ACK cluster component that connects Java or Go applications deployed in ACK clusters to the ARMS backend.
instgo -- An ARMS build tool that instruments your Go binary at compile time. Go compiles to a static binary, so instrumentation must happen during the build (unlike Java, which supports runtime injection).
Pod labels -- Kubernetes labels on your Deployment that tell ack-onepilot which pods to monitor and what name to display in the ARMS console.
Data flow:
Go binary (compiled with instgo) --> ack-onepilot (collects traces) --> ARMS backend --> ARMS consoleSetup overview:
| Step | Action | Where |
|---|---|---|
| 1. Install ack-onepilot | Install the cluster component | ACK console |
| 2. Compile with instgo | Build an instrumented Go binary | Your build environment |
| 3. Add pod labels | Enable monitoring per Deployment | Deployment YAML |
Prerequisites
ACK cluster:
An ACK managed cluster, ACK dedicated cluster, or registered cluster. For details, see Create an ACK managed cluster
A Go application deployed or ready to deploy. For supported frameworks, see Go libraries supported by Application Monitoring
ARMS:
Application Monitoring activated with the pay-by-observable-data billing mode enabled
Application Monitoring includes a free monthly quota of 50 GB. Unused quota does not carry over to the next month. If usage exceeds the free quota, standard rates apply. For pricing details, see Billing
Sample application (optional)
If you do not have a Go application ready, deploy the following sample to follow along. It creates two Deployments (otel-go-client and otel-go-server) and one Service (otel-server) in the default namespace. See Create a stateless application by using a Deployment.
The sample application images are pre-compiled with instgo. If you use the sample YAML as-is, skip Step 2: Compile the application with instgo and go directly to Step 3: Add pod labels.
Step 1: Install ack-onepilot
Log on to the ACK console. On the Clusters page, click the name of your cluster.
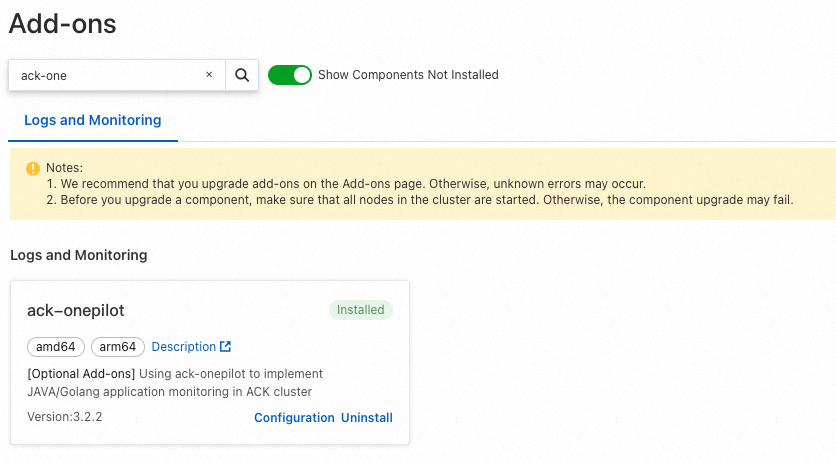
In the left-side navigation pane, click Add-ons. On the Add-ons page, search for ack-onepilot.
In the ack-onepilot section, click Install. In the dialog box that appears, click OK.
ack-onepilot version 3.2.0 or later is required.
Step 2: Compile the application with instgo
instgo is the ARMS build tool for Go. It wraps go build and injects instrumentation into your binary at compile time. Store instgo in a writable directory, because it triggers automatic updates during compilation.
Download instgo
The download URL follows this pattern:
# Public endpoint
http://arms-apm-<region-id>.oss-<region-id>.aliyuncs.com/instgo/instgo-<os>-<arch>

# VPC endpoint
http://arms-apm-<region-id>.oss-<region-id>-internal.aliyuncs.com/instgo/instgo-<os>-<arch>
Replace the placeholders with your values:
| Placeholder | Description | Examples |
|---|---|---|
<region-id> | The region where your environment resides | cn-hangzhou, ap-southeast-1, us-east-1 |
<os>-<arch> | Your operating system and CPU architecture | linux-amd64, linux-arm64, darwin-arm64, darwin-amd64, windows-amd64 (add .exe suffix for Windows) |
If you can access OSS over the Internet, use the public endpoint from any region. The China (Hangzhou) region (cn-hangzhou) is recommended for public downloads.
Example: Download instgo for Linux AMD64 from the China (Hangzhou) region:
wget "http://arms-apm-cn-hangzhou.oss-cn-hangzhou.aliyuncs.com/instgo/instgo-linux-amd64" -O instgoGrant execute permissions
On Linux or macOS, make instgo executable:
chmod +x instgoOn Windows, no additional permissions are needed.
Configure the license key (production only)
If you skip this step, instgo runs in Dev mode and installs the latest ARMS agent version. For production deployments, configure a license key.
Open the DescribeTraceLicenseKey API reference page and click Debug. In OpenAPI Explorer, click Initiate Call to retrieve your license key.

Set the license key and region:
instgo set --licenseKey=${YourLicenseKey} --regionId=${YourRegionId} --dev=false
Build the instrumented binary
Prefix your existing go build command with instgo:
instgo go build {arg1} {arg2} {arg3}Build the container image
Use the binary file compiled in the previous step to build your container image.
Step 3: Add pod labels to your Deployment
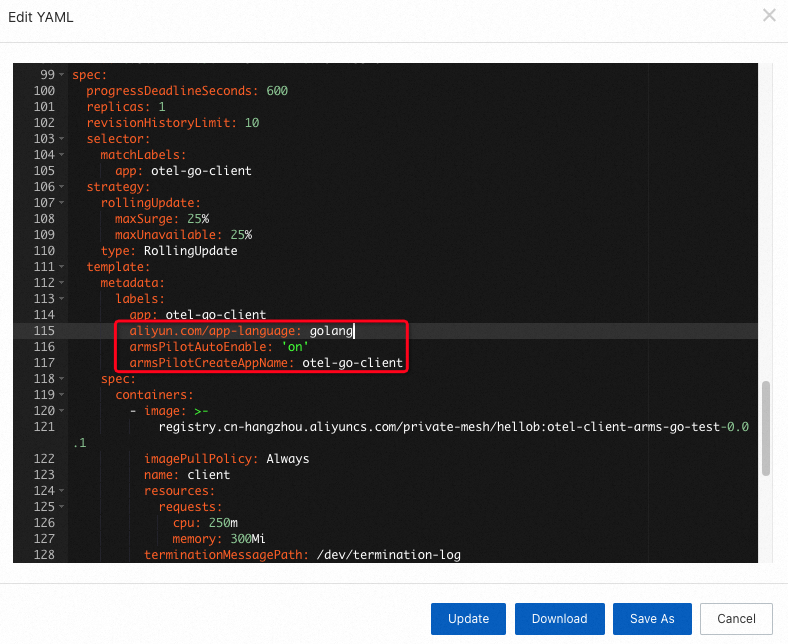
Add three labels under spec.template.metadata.labels to enable ARMS monitoring for a Deployment.
labels:
  aliyun.com/app-language: golang    # Identifies this as a Go application
  armsPilotAutoEnable: 'on'          # Enables ARMS monitoring
  armsPilotCreateAppName: "<your-deployment-name>"  # Display name in the ARMS console
To add these labels through the ACK console:
In the left-side navigation pane, choose . Select the namespace where your Deployment resides.
Find your Deployment and choose
 > Edit YAML in the Actions column.
In the Edit YAML dialog box, add the three labels under
spec.template.metadata.labelsand click Update.
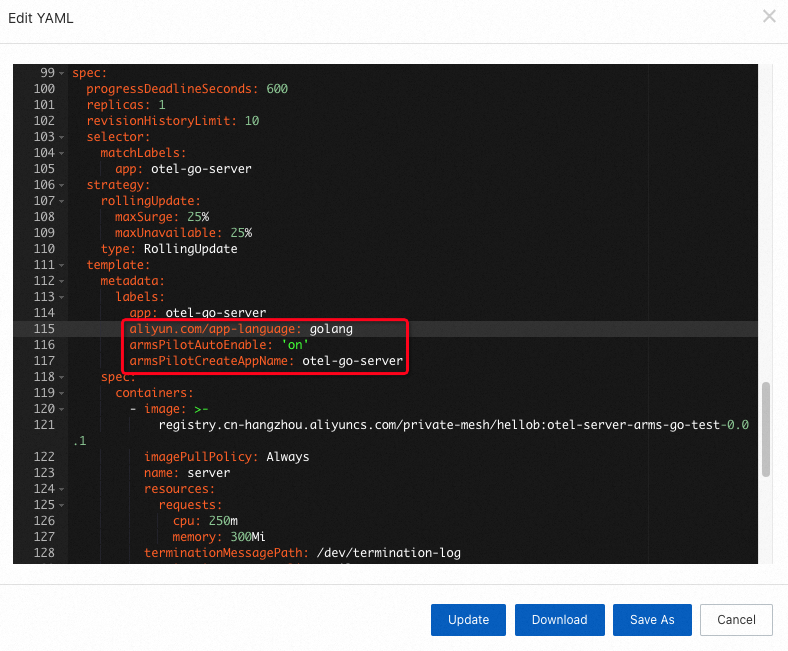
Example: The following screenshots show the labels added to the otel-go-client and otel-go-server sample Deployments.
otel-go-client:
otel-go-client Deployment
otel-go-server Deployment
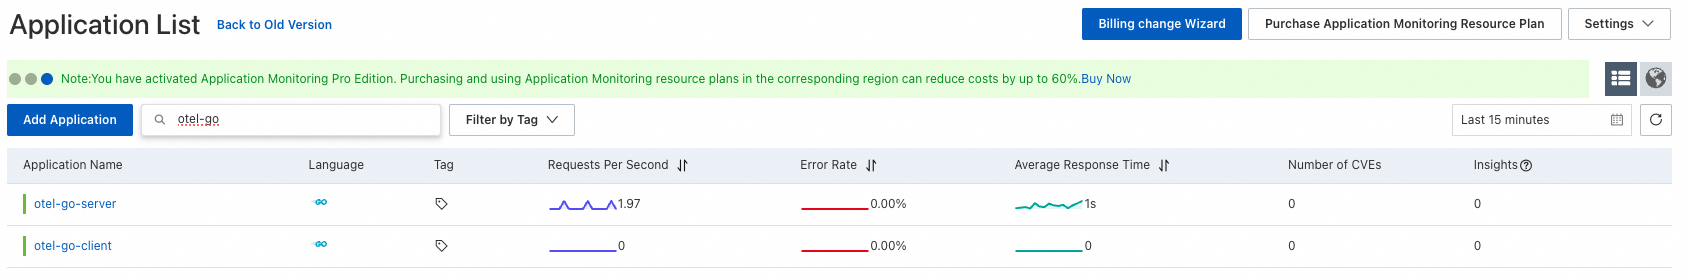
Verify that monitoring is working
After updating the Deployment YAML, the pods redeploy automatically. Wait 1--2 minutes for trace data to appear.
In the ARMS console, navigate to .
Click the name of your application to view its monitoring data.
View monitoring data
For a full walkthrough, see View monitoring details.
Trace Explorer
Trace Explorer lets you filter and aggregate trace data in real time. Use it to identify failed or slow calls and drill into individual traces.
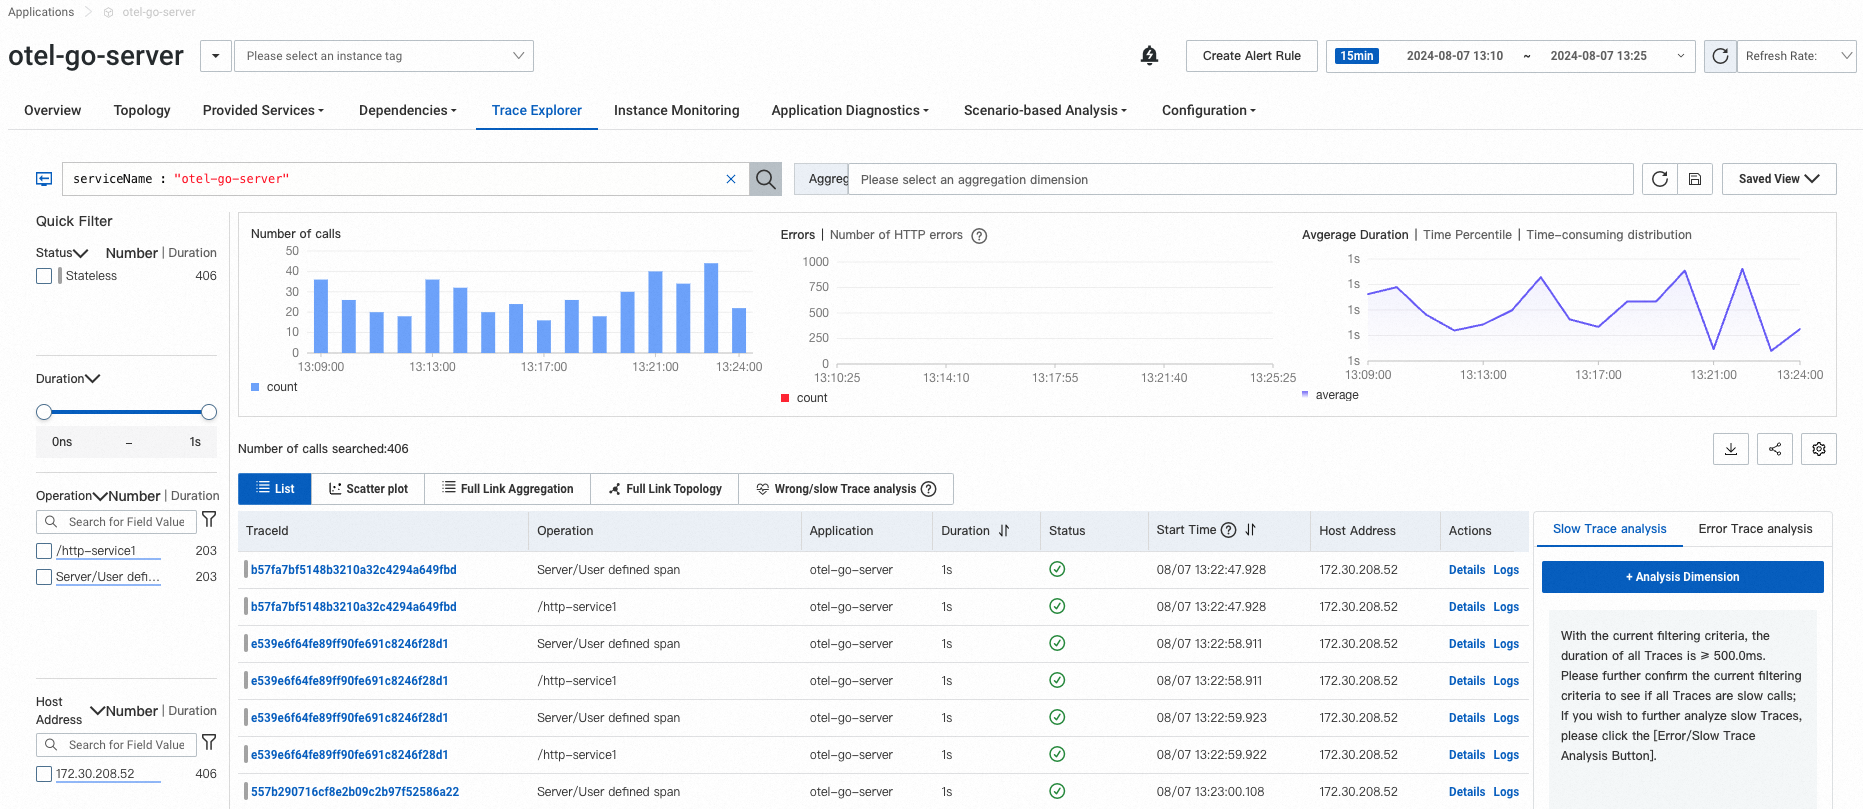
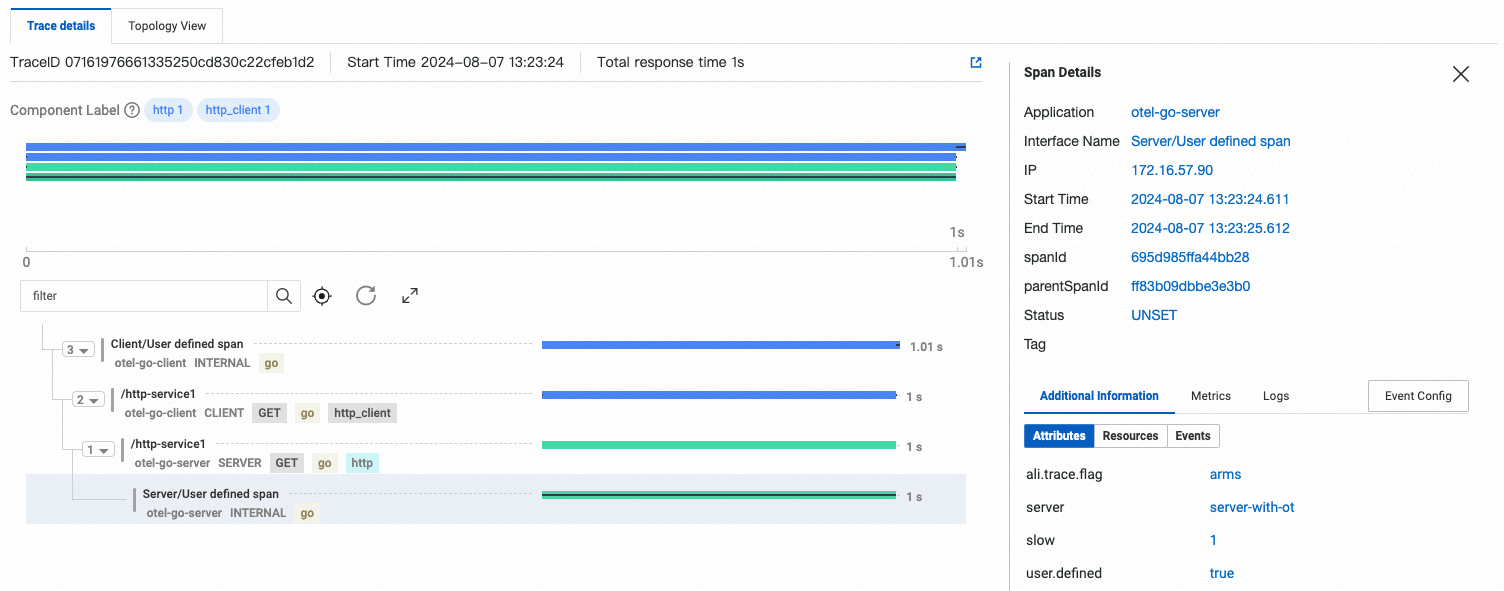
Click a trace to view its call chain, including timing, status codes, and span details.
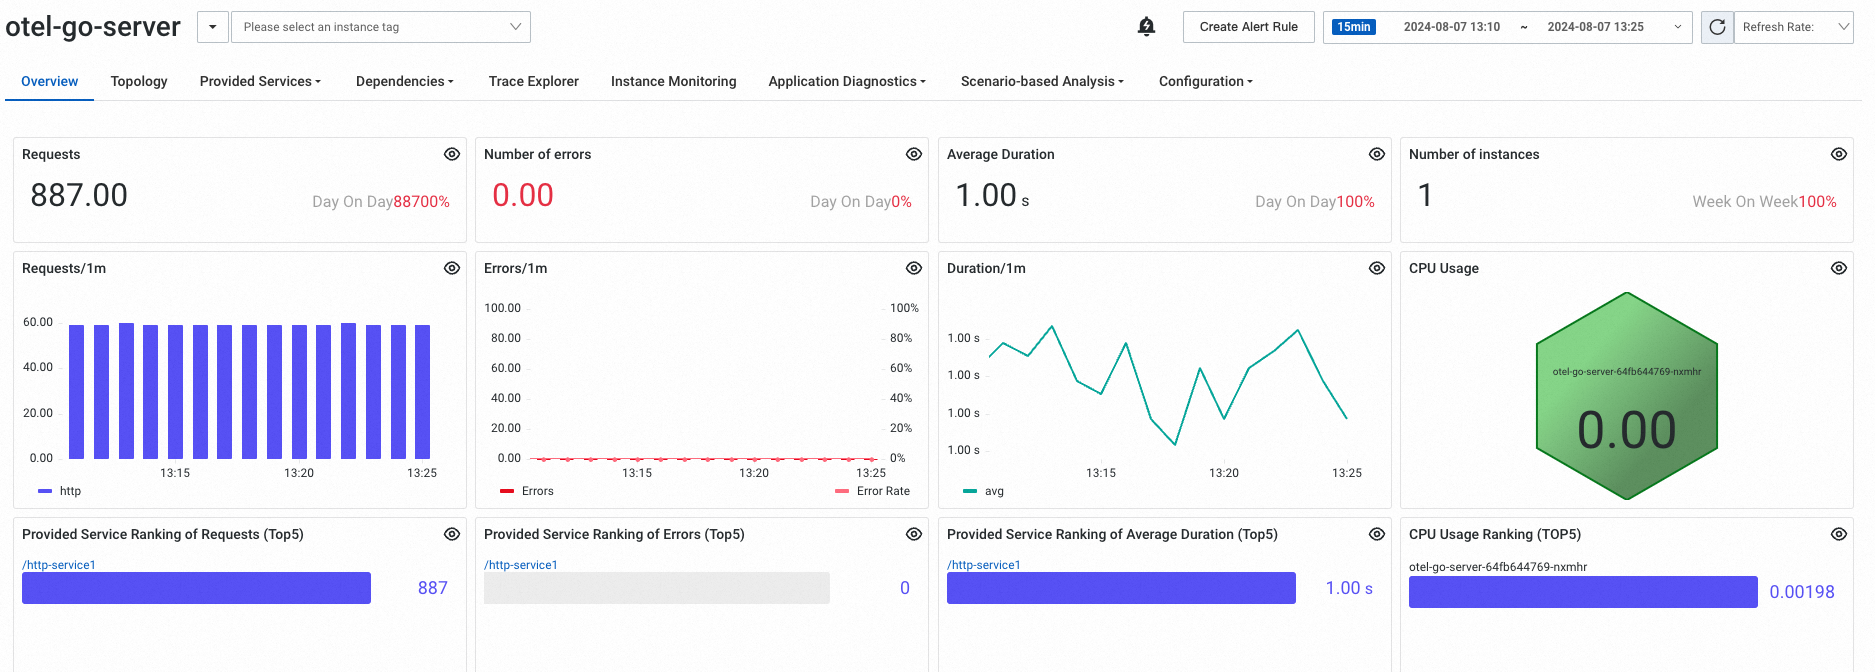
Metrics
The application overview page shows key performance indicators such as request count, response time, and error rate.
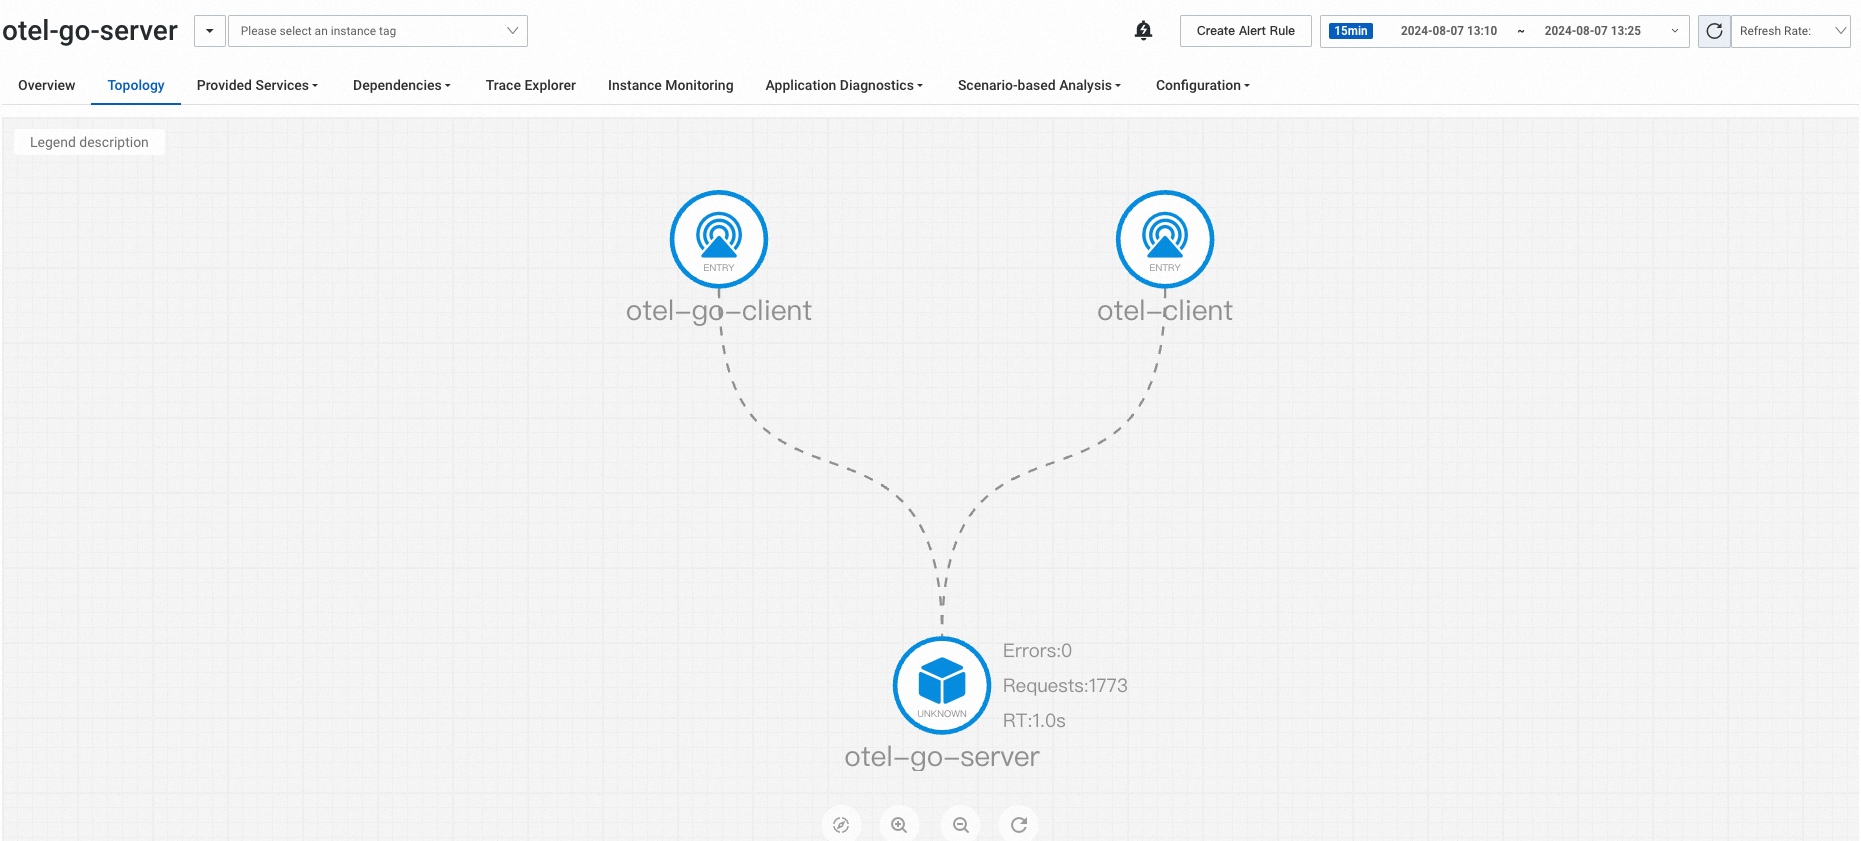
The topology view maps dependencies between services, showing request flow and latency at each hop.
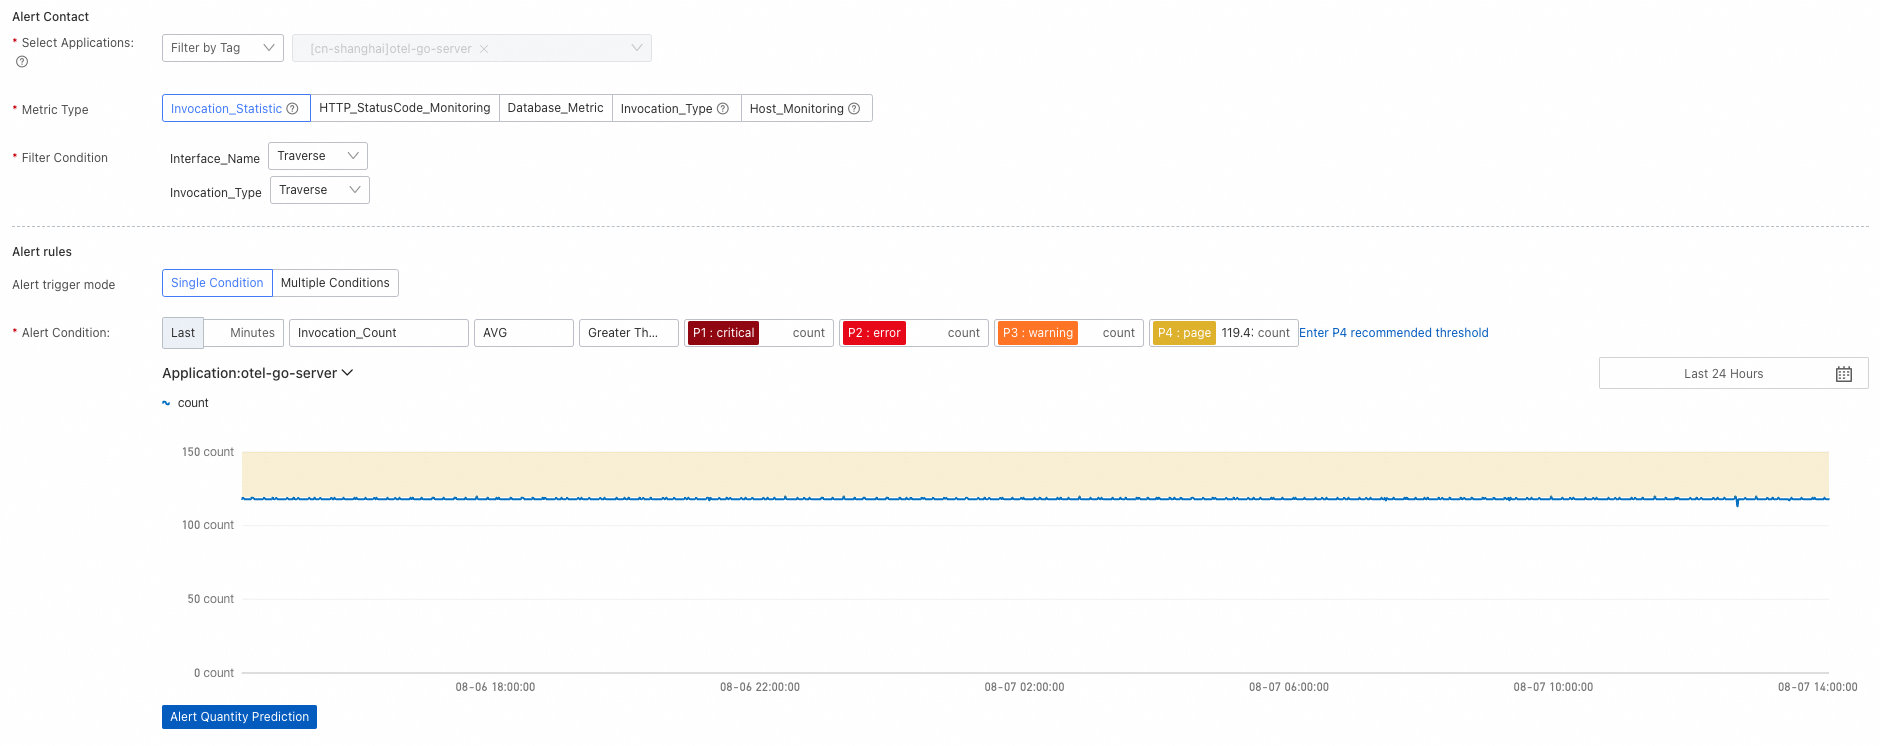
Configure alerting
Set up alert rules to get notified when performance degrades or errors spike. Notifications can be sent to contacts or DingTalk group chats. For details, see Alert rules.
Clean up resources
After completing this guide:
To keep monitoring active: Make sure your Alibaba Cloud account has no overdue payments.
To stop monitoring: Uninstall the ARMS agent from your application. For instructions, see Uninstall the Golang agent.
See also
Associate trace IDs with business logs -- Link trace IDs to application logs for faster root cause analysis when errors occur.
Continuous profiling -- Use flame graphs to diagnose high CPU utilization, memory usage, or slow calls in production.
Use Managed Service for Prometheus to query application monitoring data -- Visualize ARMS metrics in Prometheus dashboards and build custom views.