Diagnostic reports help you evaluate the operational conditions of an instance and identify anomalies on the instance based on statistics such as performance level, skewed request distribution, and slow logs.
Prerequisites
Components of a diagnostic report
Basic instance information: displays basic information of an instance such as the instance ID, instance type, engine version, and the zone in which the instance is deployed.
Summary: displays the score of the instance health status and describes the reasons why points are deducted.
Performance level: displays the statistics and states of key performance metrics related to the instance.
TOP 10 nodes that receive the greatest number of slow queries: displays the top 10 data nodes that receive the greatest number of slow queries and provides information about the slow queries.
Basic instance information
This section displays the instance ID, instance type, engine version, and the region in which the instance is deployed.
Figure 1. Basic instance information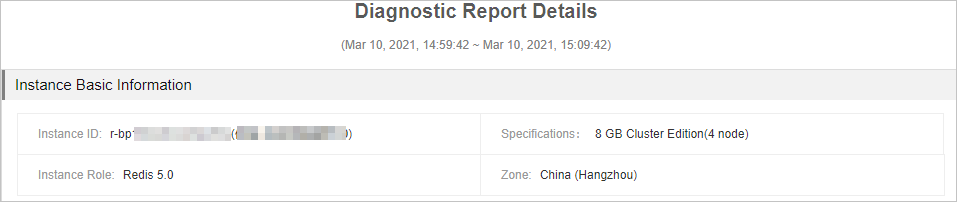
Summary
This section displays the diagnostic results and the score of the instance health status. The highest score is 100. If your instance achieves a score lower than 100, you can check the diagnostic items and details.
Figure 2. Summary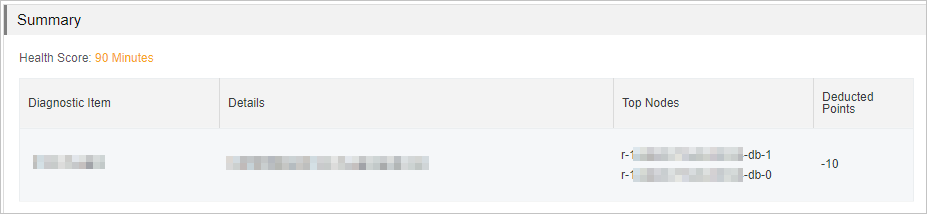
Performance level
This section displays the statistics and states of key performance metrics related to the instance. You must pay attention to performance metrics that are in the Hazard state.
If your instance runs in a cluster architecture or a read/write splitting architecture, you must check whether the performance metrics are skewed and check for skewed data nodes. For more information about the cluster and read/write splitting architecture, see Cluster master-replica instances and Read/write splitting instances. In addition, we recommend that you focus on the data nodes with higher loads based on the curve charts of each performance metric in the Top 5 Nodes section.
Figure 3. Performance level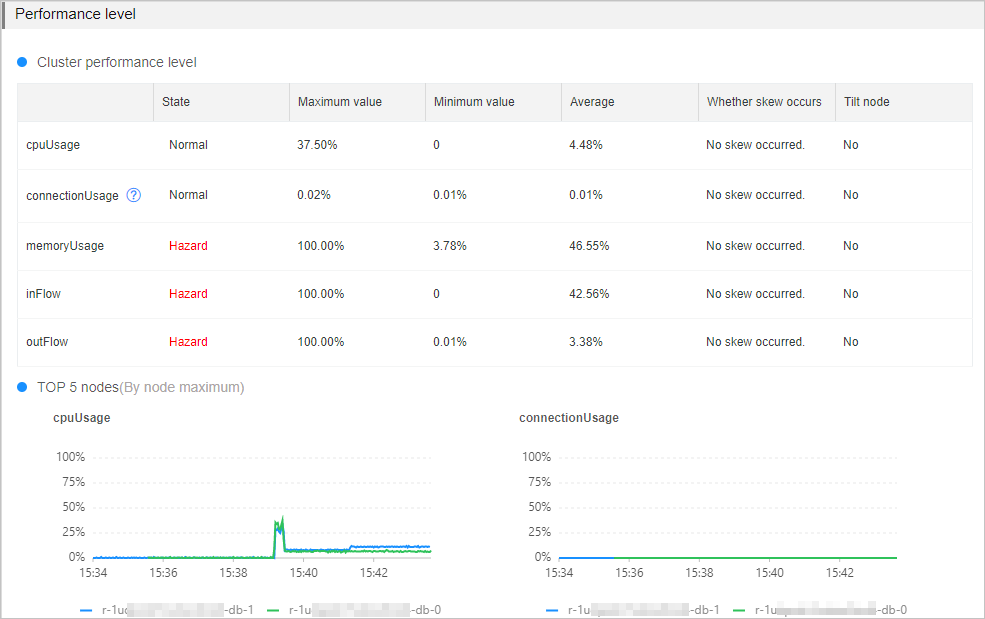
Performance metric | Threshold | Impact | Possible cause and troubleshooting method |
CPU Utilization | 60% | When an instance has high CPU utilization, the throughput of the instance and the response time to clients are affected. In some cases, the clients may be unable to respond. | Possible causes:
For more information about how to troubleshoot these issues, see Troubleshoot high CPU utilization on an instance. |
Memory Usage | 80% | When the memory usage of an instance continuously increases, response time increases, queries per second (QPS) becomes unstable, and keys may be frequently evicted. This affects your business. | Possible causes:
For more information about how to troubleshoot these issues, see Troubleshoot high memory usage on an instance. |
Connections Usage of data nodes | 80% | When the number of connections to a data node reaches the upper limit, connection requests may time out or fail. Note
| Possible causes:
For more information about how to troubleshoot these issues, see Instance sessions. |
Inbound Traffic | 80% | When the inbound or outbound traffic exceeds the maximum bandwidth provided by the instance type, the performance of clients is affected. | Possible causes:
For more information about troubleshoot these issues, see Troubleshoot high traffic usage on an instance. |
Outbound Traffic | 80% |
If your instance runs in the cluster architecture or read/write splitting architecture, the system measures the overall access performance of the instance based on the preceding performance metrics and displays the result in the diagnostic report. The following table describes the criteria used to determine skewed requests, possible causes of skewed requests, and troubleshooting methods.
If the diagnostic report indicates that the instance has skewed requests for a specific performance metric, you must check the nodes to which the skewed requests are directed.
Criteria | Possible cause | Troubleshooting method |
The following conditions are met:
|
|
TOP 10 nodes that receive the greatest number of slow queries
This section displays the top 10 data nodes that receive the greatest number of slow queries and statistics about the slow queries. The statistics include the following slow logs:
The slow logs of data nodes that are stored in the system audit logs. These slow logs are retained only for four days.
The slow logs that are stored on the data node. Only the most recent 1,024 log entries are retained. You can use redis-cli to connect to the instance and run the SLOWLOG GET command to view these slow logs.
Figure 4. Slow query analysis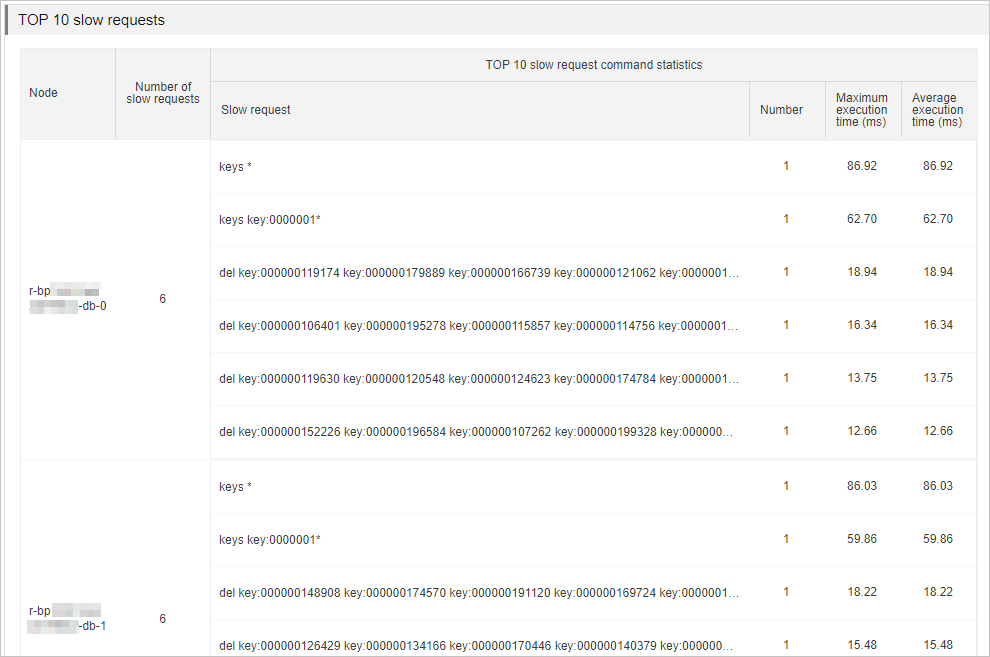
You can analyze the slow queries and determine whether improper commands exist. This way, you can find the solutions to different issues.
Cause | Solution |
Commands that have a time complexity of O(N) or consume a large amount of CPU resources, such as keys *. | Evaluate and disable commands that cause a high risk and consume a large amount of CPU resources, such as FLUSHALL, KEYS, and HGETALL. For more information, see Disable high-risk commands. |
Large keys that are frequently read from and written to the data nodes. | Analyze and evaluate the large keys. For more information, see Use the offline key analysis feature. Then, split these large keys based on your business requirements. |