View details of a data synchronization task
After a data synchronization task is started, you can view the basic information, synchronization details, and synchronization objects on the details page of the task.
Access the details page
Log on to the
ApsaraDB for OceanBase console.In the left-side navigation pane, choose Data Transmission > Data Synchronization.
Click the name of the data synchronization task that you want to manage to go to its details page. On the details page, view the basic information and synchronization details of the task.

On the Data Synchronization page, you can search for data synchronization tasks by tag, status, type, and keyword. A data synchronization task can be in one of the following states:
Not Configured: The data synchronization task has not been configured. You can click Configure in the Actions column to configure the task.
Configuration changing: The instance specifications are being upgraded for the data synchronization task.
If the current instance specifications cannot meet the business needs, you can upgrade the instance specifications for the data synchronization task. For more information, see Data transmission specifications.
Not Started: The data synchronization task has not been started. You can click Start in the Actions column to start the task.
Running: The data synchronization task is running. You can view the data synchronization plan and current progress and click buttons in the Actions column to perform corresponding operations.
Modifying: The synchronization objects of the data synchronization task are being modified.
Integrating: The data synchronization task is being integrated with the corresponding synchronization object modification task.
Stopped: The data synchronization task is manually stopped. You can click Resume in the Actions column to resume the task.
Failed: The data synchronization task failed. You can locate the phase where the failure occurred on the right. To view the error messages, click the task name to go to the task details page.
Completed: The data synchronization task is completed and the data transmission service has synchronized the specified data to the target database in the configured synchronization mode.
Ending: The data synchronization task is being ended. You cannot edit a data synchronization task in this state.
Ended: The data synchronization task is ended.
You can change the name of a task in the Not Started, Running, Stopped, or Failed state. For more information, see Change the name of a data synchronization task.
View basic information
The Basic Information section displays the basic information of the current data synchronization task.

Parameter | Description |
ID | The unique ID of the data synchronization task. |
Synchronization Type | The synchronization type specified when the data synchronization task was configured. |
Alert Status | The alert status of the data synchronization task. You can click the Edit icon to modify the alert status. For more information, see Modify the alert monitoring settings. |
Created At | The time when the data synchronization task was created. |
View Details | Click View Details to view the information about the source and target databases of the data synchronization task. You can also copy the data source identifiers. |
Billing Method | The billing method specified when the data synchronization task was purchased. For more information, see Billing for data transmission. |
Instance Specification | The instance specification specified when the data synchronization task was purchased. For more information, see Data transmission specifications. |
You can perform the following operations on the current data synchronization task:
View and modify synchronization objects
Click View Objects in the upper-right corner. The synchronization objects of the current data synchronization task are displayed. You can modify the synchronization objects during the running of a synchronization task. For more information, see View and modify synchronization objects and their filter conditions.
View parameters
Click ... in the upper-right corner of the page and select Settings from the drop-down list. On the page that appears, you can view the parameters configured when the data synchronization task was created.
View or modify parameter configurations
You can view the parameter configurations of a data synchronization task in the Configuration changing, Running, Modifying, Integrating, Completed, Ending, or Ended state. You can modify the parameter configurations for a data synchronization task in the Not Started, Stopped, or Failed state. For more information, see View and modify the parameter configurations of a data synchronization task.
The parameters that can be modified vary based on the type of the data synchronization task and the current phase of the task.
Download object settings
On the details page of the task, click the ... icon in the upper-right corner, and then click Download Task Configuration to download the settings of the synchronization objects and import the settings in batches. For more information, see Download and import the settings of synchronization objects.
View synchronization details
In the Synchronization Details section, you can view information about Schema Synchronization, Full Synchronization, and Incremental Synchronization. Schema synchronization creates a topic. After the schema synchronization is completed, you can query the new topic.
The Incremental Synchronization section displays the status, latency, and current timestamp of the data synchronization task. Based on this information, you can monitor the performance of the data synchronization task.
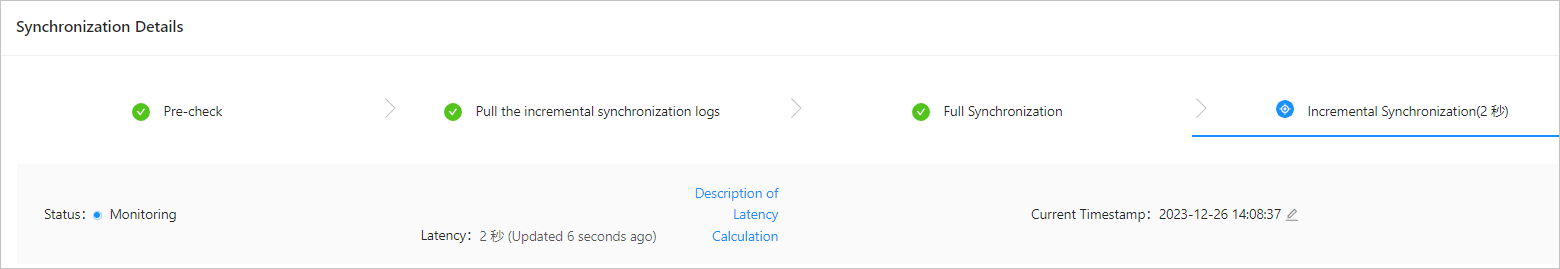
When you create a data synchronization task, we recommend that you enable alert monitoring to monitor the task status in real time. For more information, see Configure alerts. If alert monitoring is disabled, when the incremental synchronization latency is less than or equal to 10 minutes, the incremental synchronization status changes from Running to Monitoring by default. Take note of the following items if alert monitoring is enabled:
When the incremental synchronization latency exceeds the specified alert threshold, the incremental synchronization task remains running and the system does not trigger any alerts.
When the incremental synchronization latency is less than or equal to the specified alert threshold, the incremental synchronization status changes from Running to Monitoring. After the incremental synchronization status changes to Monitoring, it will not change back to Running when the latency exceeds the specified alert threshold.
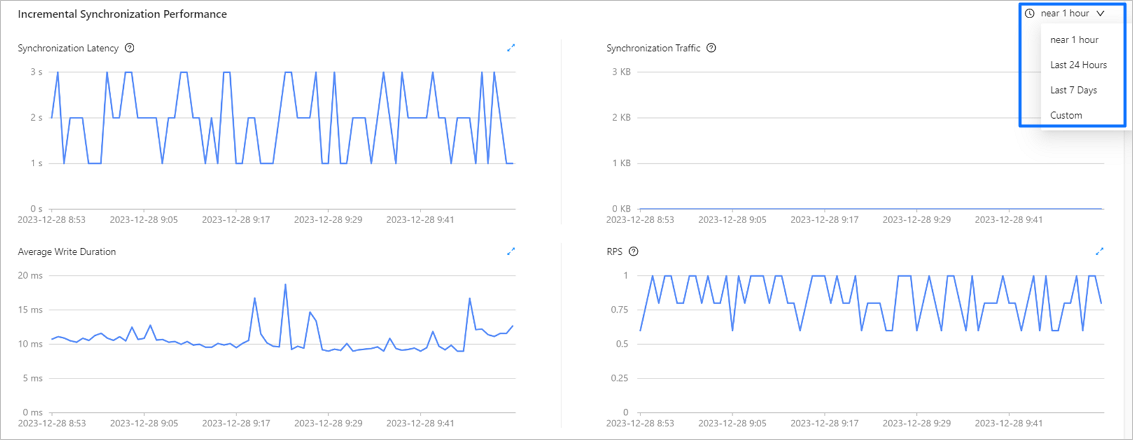
The Incremental Synchronization Performance section displays the performance information of incremental data synchronization in real time. You can view the changes in synchronization performance in real time or by period, for example, by selecting Last 1 Hour, Last 1 Day, Last 7 Days, or a specified period of time.
Parameter | Description |
Latency | The latency in synchronizing incremental data from the source database to the target database, in seconds. |
Synchronization Traffic | The traffic throughput of incremental data synchronization from the source database to the target database, in KB/s. |
Average Write Duration | The average duration of synchronizing data from an OceanBase database to a DataHub or Kafka instance. |
Average Execution Time/Average Commit Time Important The average execution time and average commit time are measured only when data is synchronized from an OceanBase database in MySQL-compatible mode to an AnalyticDB MySQL database, or from one OceanBase database to another. |
|
RPS | The number of records processed per second. |