Overview
ApsaraDB for OceanBase allows you to monitor the database and host performance of a cluster instance. You can view performance monitoring data and configure general monitoring metrics on your custom monitoring panel as needed in the ApsaraDB for OceanBase console.
View the performance monitoring data of a cluster
Log in to the ApsaraDB for OceanBase console.
In the left-side navigation pane, click Instances.
In the instance list, click the name of the target cluster instance to go to the Cluster Instance Workspace page.
On the Cluster Instance Workspace page, view some default monitoring metrics.
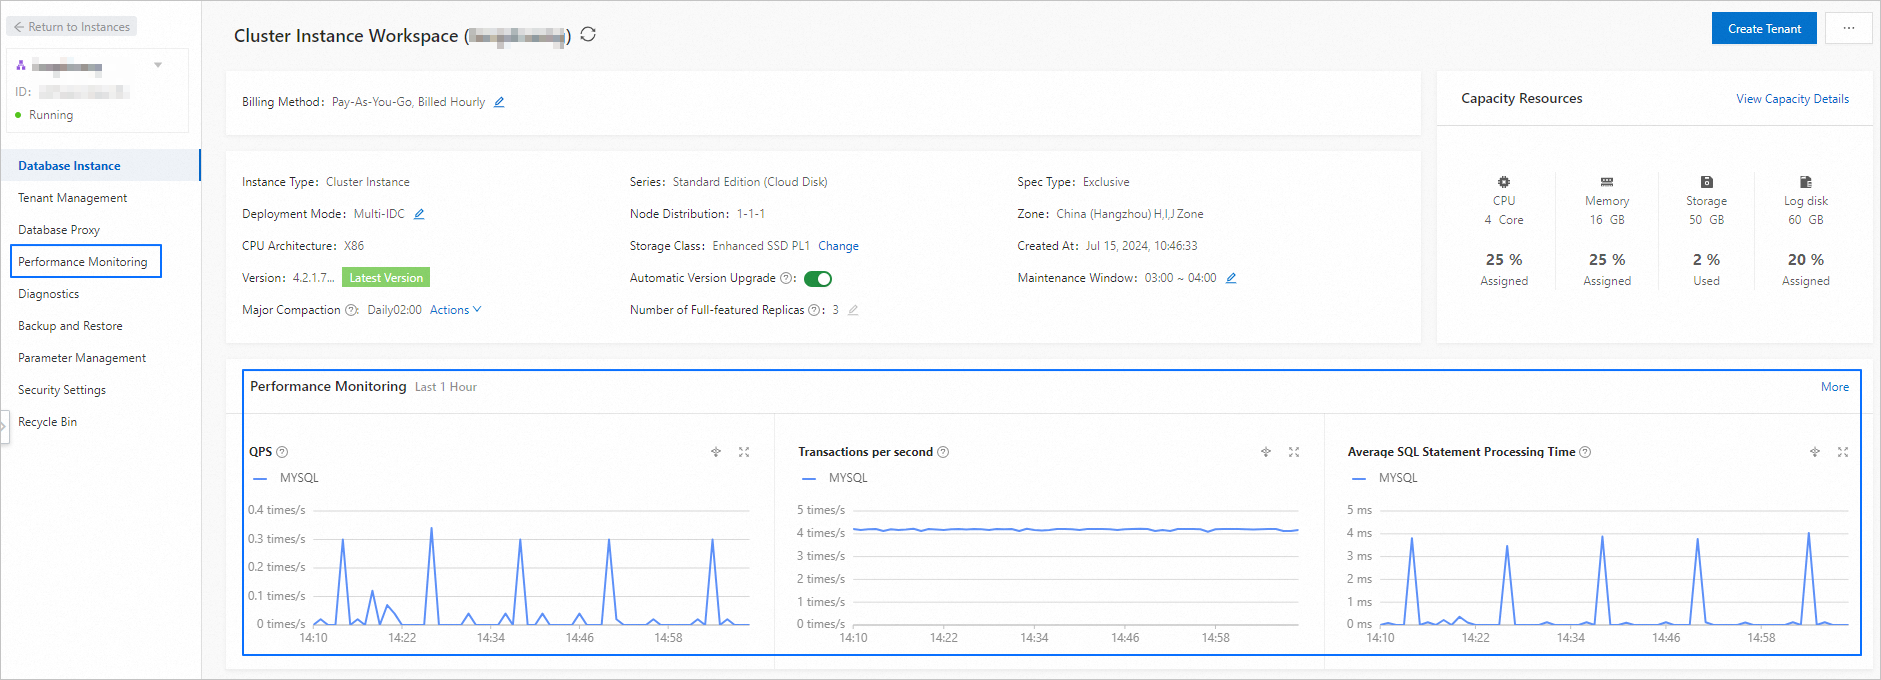
Click Performance Monitoring in the left-side navigation pane, or click More in the upper-right corner of the performance monitoring section to access the Cluster Monitoring page.
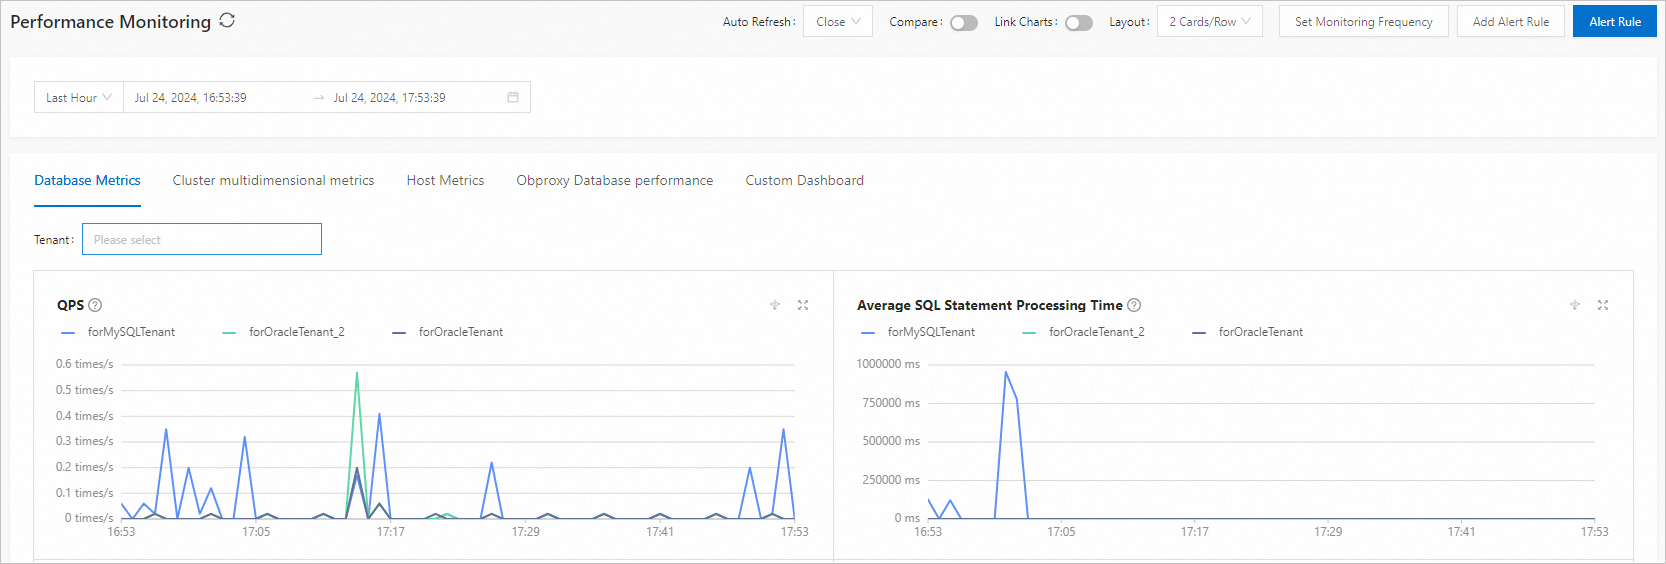
On the Cluster Monitoring page, view the performance monitoring data of the database and host. You can click Database Metrics, Cluster multidimensional metrics, Host Metrics, or Obproxy Database performance to view the corresponding monitoring data.
NoteProxy-related monitoring is available for only customers on the allowlist. To enable proxy-related monitoring, contact ApsaraDB for OceanBase Technical Support.
General monitoring features
ApsaraDB for OceanBase allows you to view monitoring data by filtering and comparison. You can display the chart data in different styles based on your business requirements.
Tenant/Node filtering
You can select multiple tenants or nodes from the corresponding drop-down list.
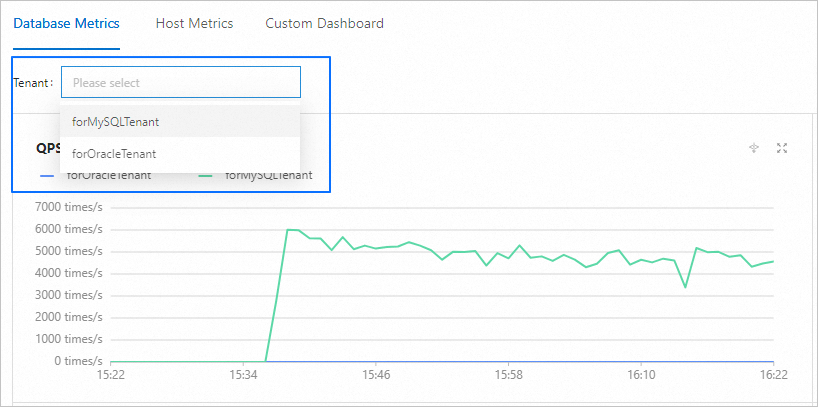
In a monitoring chart, you can click the name of a tenant or a node to show or hide its monitoring data.

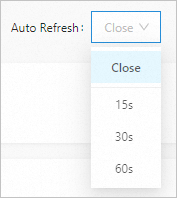
Auto refresh
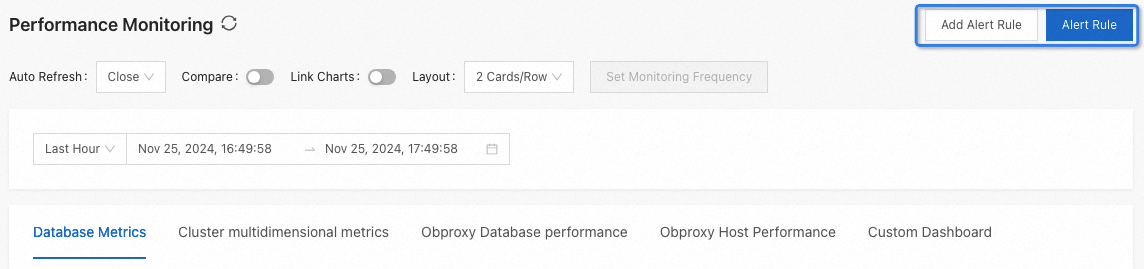
You can click the drop-down list on the right of Auto Refresh in the upper-right corner to set the refresh frequency to 15s, 30s, or 60s. If you select Close, monitoring data is not automatically refreshed.
Time period comparison
You can turn on the Compare switch in the upper-right corner and specify a period to compare the monitoring data. The solid line represents the data during the baseline period, and the dotted line represents the data during the specified period.
After you set the baseline period, you can click Previous period, Same period of the previous day, or The same period of the previous week to compare monitoring data or customize the time period as needed.

Link charts
You can turn on the Link Charts switch in the upper-right corner. This way, when you move the pointer on a monitoring chart, the corresponding data at the specific point in time of other charts is displayed.

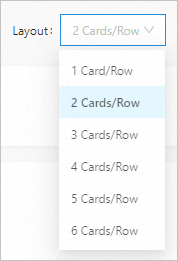
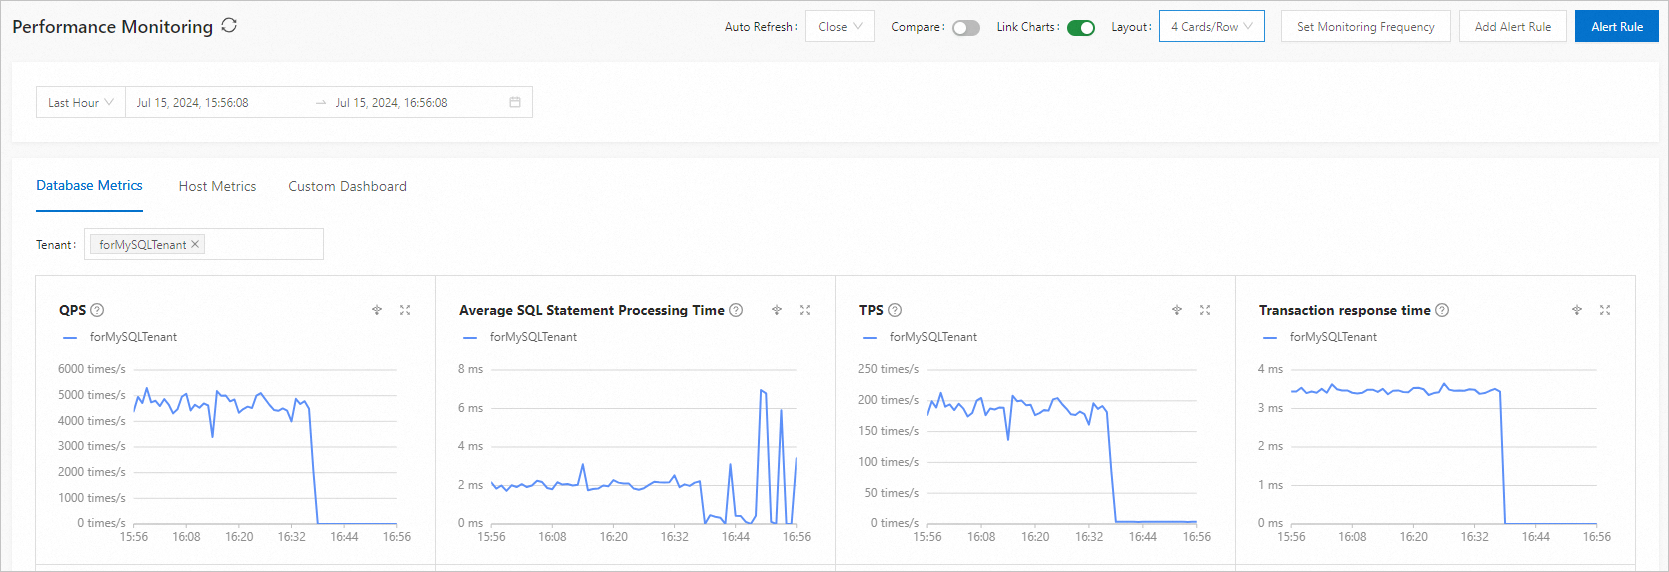
Chart layout
You can click the drop-down list on the right of Layout in the upper-right corner to change the current monitoring panel layout as needed.
For example, the following image shows a layout of four charts per row.
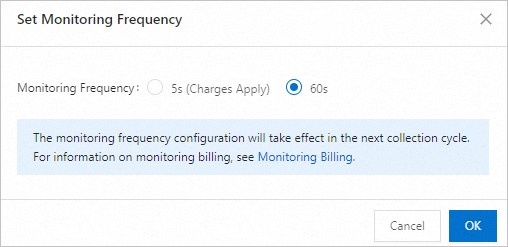
Specify the monitoring frequency
You can turn on the Configure Monitoring switch in the upper-right corner to specify the monitoring data collection interval.
The default interval is 60s. You can set the interval to 5s. A fee will be charged for this feature. For more information, see Billing methods for monitoring.
Second-level monitoring is available for only customers on the allowlist. To enable this feature, contact Alibaba Cloud Technical Support.
Drill-down monitoring
Drill-down monitoring is available for only a single tenant. If you selected multiple tenants to view the monitoring data, the corresponding icons are grayed out.
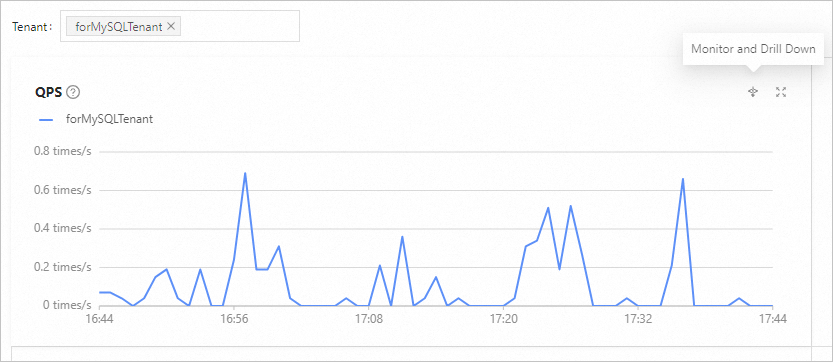
You can select a tenant from Tenants and click the drill-down icon![]() to view more fine-grained monitoring metric data. For more information on drill-down monitoring, see Drill-down cluster performance monitoring.
to view more fine-grained monitoring metric data. For more information on drill-down monitoring, see Drill-down cluster performance monitoring.

Alert management
You can also create and view alert rules by clicking the corresponding buttons in the upper-right corner. For more information, see Add an alert rule and Manage alert rules.
Custom report
You can click the Custom Dashboard tab to manage your custom monitoring panel and view corresponding monitoring metrics. For more information, see Customize a monitoring report for a cluster instance.
Performance diagnostics
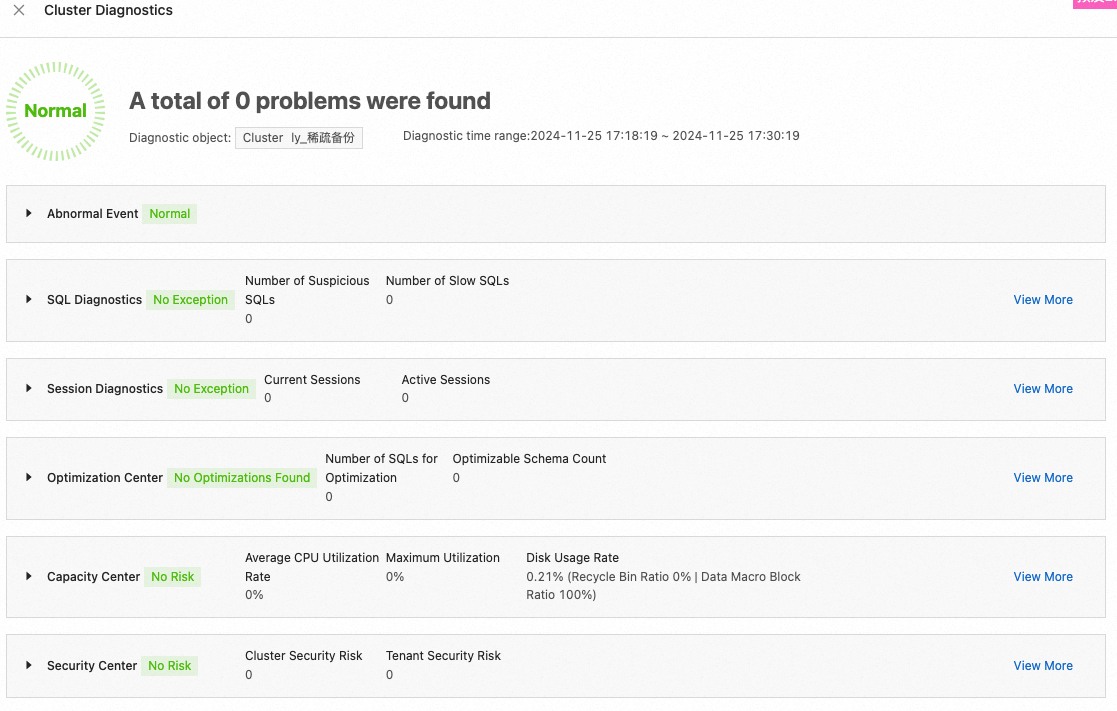
In a monitoring chart, you can left-click and drag to select a specific time period and choose the specified cluster or tenant for diagnostics.
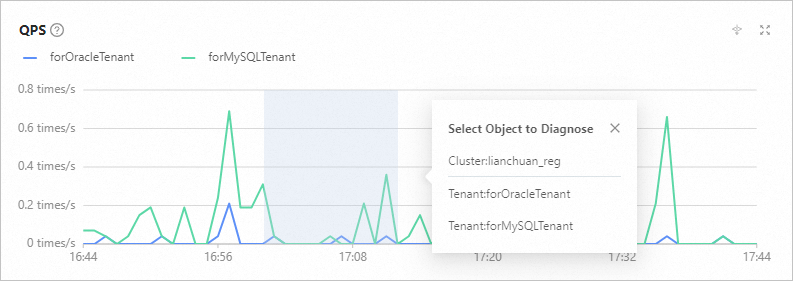
On the Diagnosis page, you can view Abnormal Event, Real-Time Diagnostics, Optimization Center, Capacity Center, and Security Center for a specified cluster, and Real-Time Diagnostics, Optimization Center, Capacity Center, and Security Center for a specified tenant. You can also click View More to go to OceanBase Autonomy Service for details. For more information on OceanBase Autonomy Service, see Overview.