On the host performance monitoring details page, you can view the monitoring data of nodes.
View host monitoring data
Log in to the ApsaraDB for OceanBase console.
In the left-side navigation pane, click Instances.
In the instance list, click the name of the target instance to go to the instance workspace.
In the left-side navigation pane of the instance workspace, click Performance Monitoring.
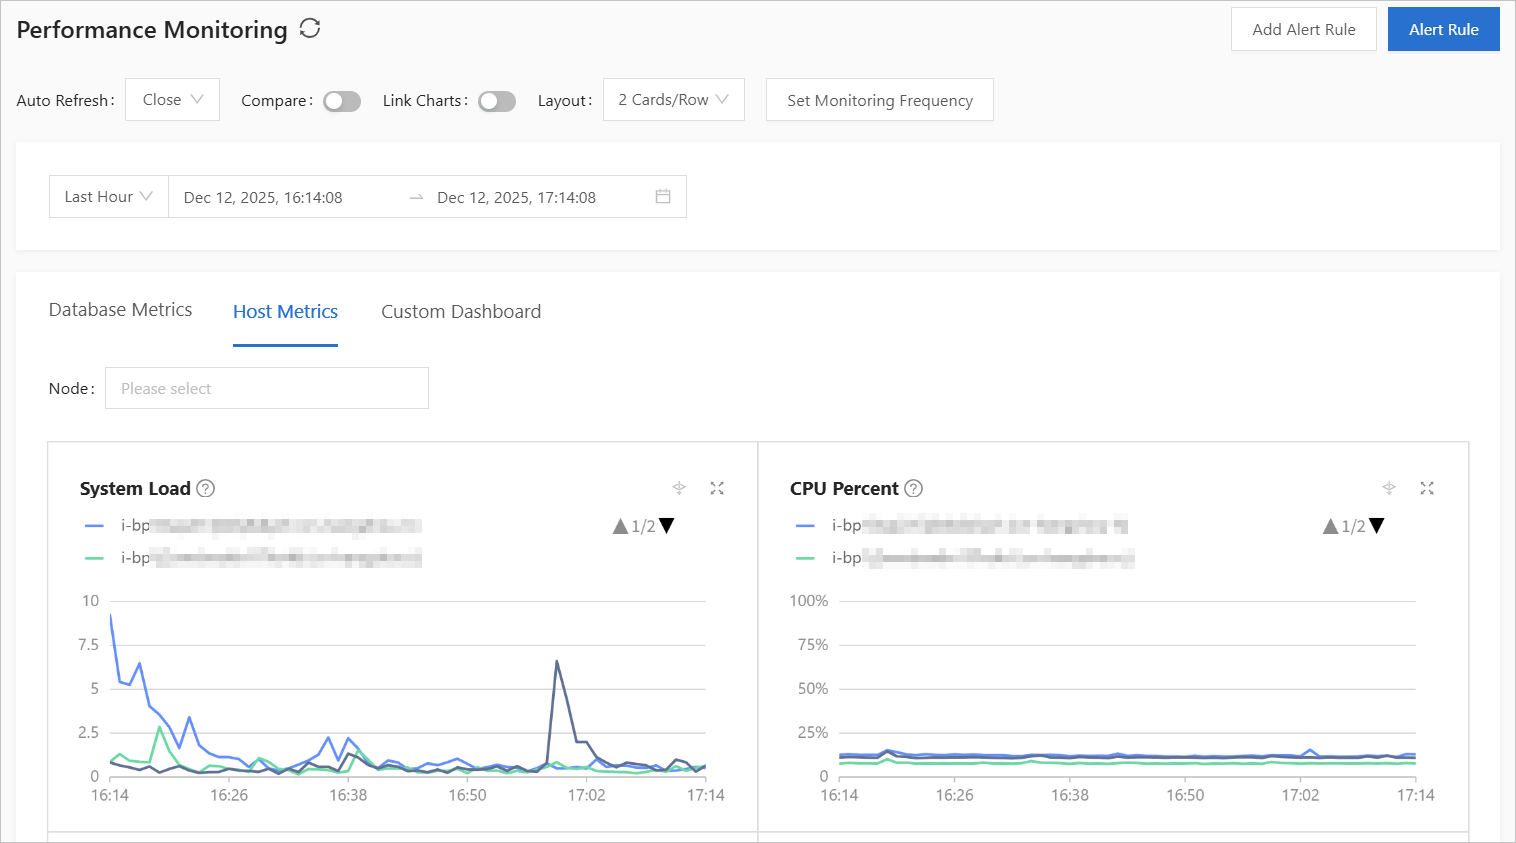
Click the Host Metrics tab.
By default, the host monitoring page displays the monitoring data of all nodes in the last hour.
You can select a node from the Node drop-down list to view its monitoring data. If you select multiple nodes, you can click node names in a chart to filter the data to view.
You can also specify a time period to filter the data to view.
The following table describes the performance metrics.
Monitoring item | Metric | Unit | Description |
Load | load1 | - | The average CPU load in the last 1 minute. |
CPU Percent | cpu_percent | % | The CPU utilization. |
Memory | memory_used | GiB | The size of physical memory used by the node. |
Network Throughput | net_throughput | MiB | The network throughput of the node. |
Data Received per Second | net_recv | MiB | The amount of data received per second. |
Data Sent per Second | net_send | MiB | The amount of data sent per second. |
NTP Offset | ntp_offset_milliseconds | ms | The NTP clock offset of the node. |
OceanBase Data Disk Usage Rate | ob_data_disk_percent | % | The data disk usage of the node. |
OceanBase Log Disk Usage Rate | ob_clog_disk_percent | % | The log disk usage of the node. |
Disk Usage | ob_data_disk_used_size | GiB | The size of used data disk space on the node. |
Data Usage | ob_data_required_size | GiB | The disk space used by data. |
OceanBase Process Status | ob_process_exists | - | The status of the observer process on the node. |
OB Clog Disk IOPS | ob_clog_io | Times/s | The average number of I/O operations per second on the log disk of the node. |
OB Clog Disk IO Time | ob_clog_io_time | ms | The average time spent on each I/O operation on the log disk of the node. |
OB Clog IO Throughput | ob_clog_io_byte | MiB | The average I/O throughput per second of the log disk of the node. |
OB Clog IO Util | ob_clog_io_util | % | The I/O usage of the log disk of the node |
OB Data Disk IOPS | ob_data_io | Times/s | OB Data Disk IOPS |
OB Data Disk IO time | ob_data_io_time | ms | The average time spent on each I/O operation on the data disk of the node. |
OB Data IO Throughput | ob_data_io_byte | MiB | The average I/O throughput per second of the data disk of the node. |
OB Data IO Util | ob_data_io_util | % | The I/O usage of the data disk of the node. |
OceanBase Host IOPS | ob_host_real_time_iops | Times/s | The real-time IOPS of the host. |
OceanBase Host Throughput | ob_host_real_time_throughput | MiB | The real-time throughput of the host. |
OceanBase Host I/O Utilization | ob_host_iops_used_percent | % | The I/O usage of the host. |
OceanBase Host Throughput Utilization | ob_host_throughput_used_percent | % | The throughput usage of the host. |
The preceding metric names are supported values of the Metrics request parameter of the DescribeMetricsDataV2 operation.