Customize a monitoring report for a cluster instance
On the performance monitoring page of a cluster instance, you can configure general metrics for the custom monitoring panel.
Create a custom report
Log on to the ApsaraDB for OceanBase console.
In the left-side navigation pane, click Instances.
In the instance list, click the name of the target instance to go to the instance workspace.
In the left-side navigation pane of the instance workspace, click Performance Monitoring.
On the Performance Monitoring page, click Custom Dashboard.
Manage reports within the Custom Reports tab.
View Custom Reports
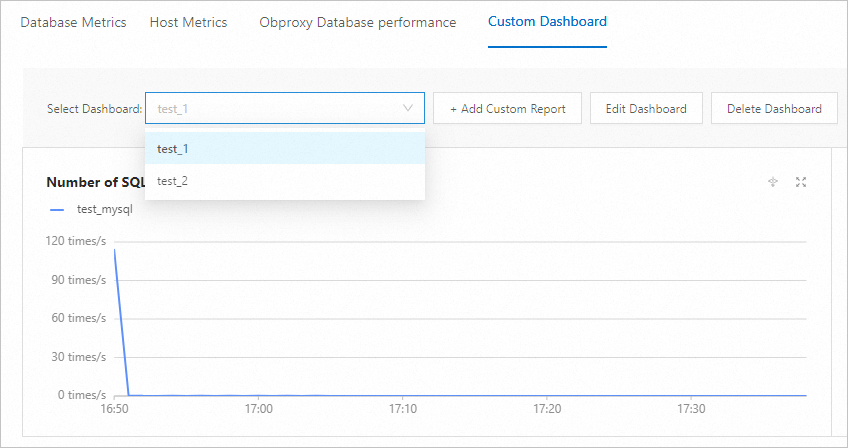
Within the Custom Dashboard tab, you can manage your custom reports. Then you can select the desired custom report by using the 'Choose Report' function to specify which report you wish to view.

Add a Custom Report
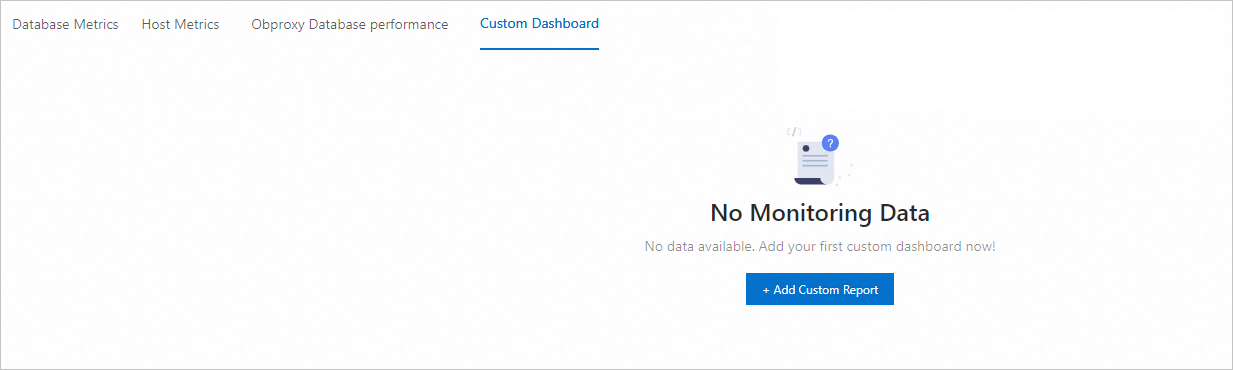
Within the Custom Dashboard tab, click Add Custom Report.
When creating a custom report for the first time, the interface appears as follows:
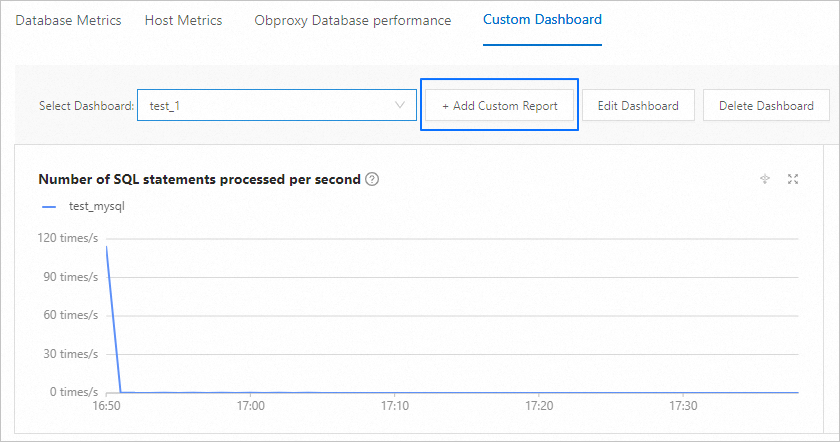
If custom reports already exist, the interface will appear as follows:
Enter the name of the monitoring report, select the tenant for which you want to create the report, and select metrics for the report. For more information about the metrics, see Metrics.
NoteThe name of the report cannot exceed 20 characters in length.
At present, you can create at most seven custom monitoring reports.
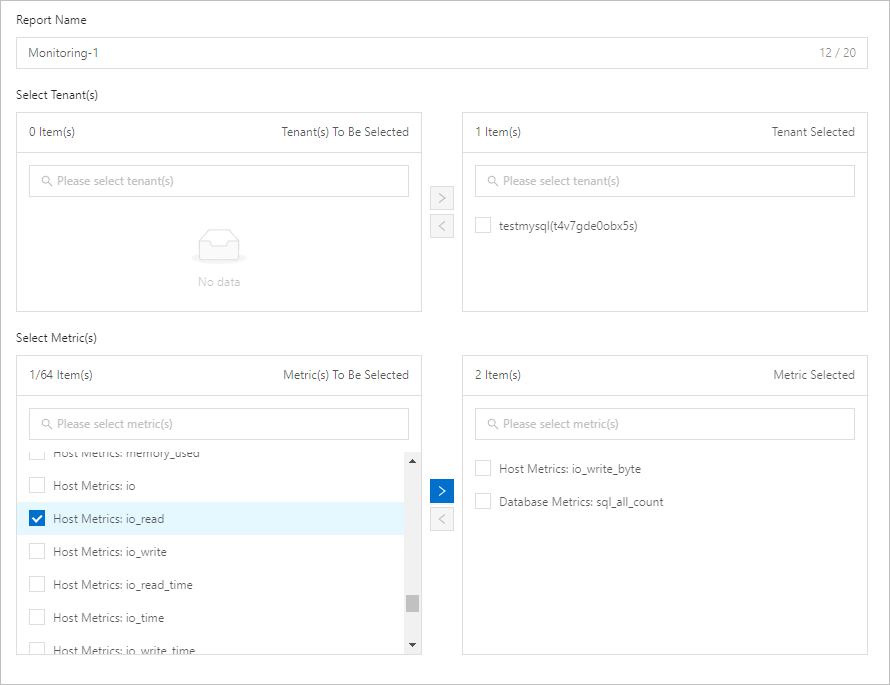
click OK.
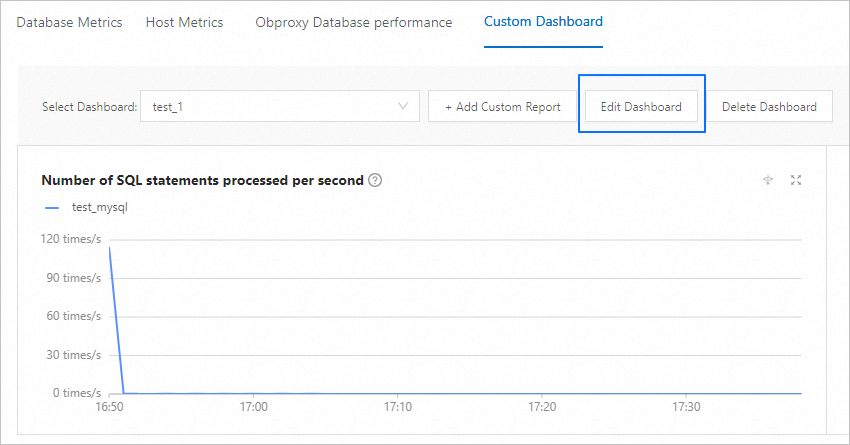
Edit a custom report
Within the Custom Dashboard tab, choose the target custom report.
click Edit Costom Report.

On the Edit Custom Report page, modify the report name, tenant, and metrics. For more information about the metrics, see Metrics.
Click OK.

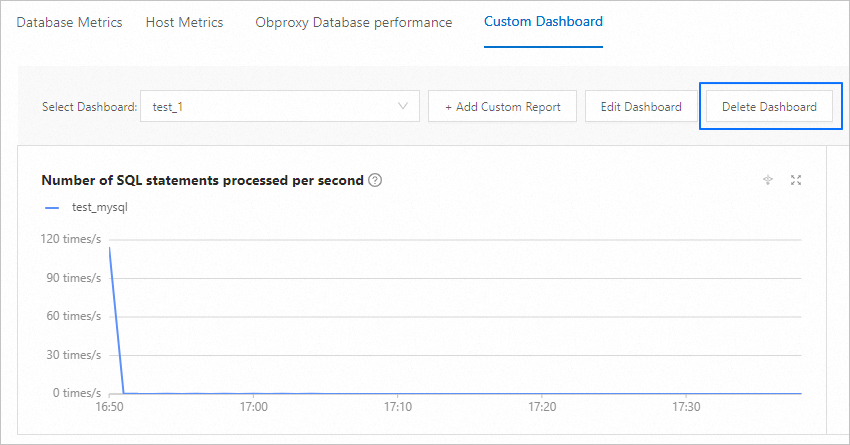
Delete a custom report
Within the Custom Dashboard tab, choose the target custom report.
click Delete Custom Report.
In the pop-up window that appears, click OK.

Metrics
Metrics for database proxies and proxy hosts are available only if you have enabled proxy monitoring. Proxy-related monitoring is available for only customers on the allowlist. To enable proxy-related monitoring, contact Alibaba Cloud Technical Support.
Metric category | Metric | Description |
Database Metrics | sql_all_count | Number of SQL statements processed per second. |
Database Metrics | sql_delete_count | Number of DELETE statements processed per second. |
Database Metrics | sql_insert_count | Number of INSERT statements processed per second. |
Database Metrics | sql_other_count | Number of other statements that are processed per second, such as data definition language (DDL), data control language (DCL), and data transaction language (DTL) statements. |
Database Metrics | sql_replace_count | Number of REPLACE statements processed per second. |
Database Metrics | sql_select_count | Number of SELECT statements processed per second. |
Database Metrics | sql_update_count | Number of UPDATE statements processed per second. |
Database Metrics | sql_all_rt | Average amount of time spent in processing an SQL statement. |
Database Metrics | sql_delete_rt | Average amount of time spent in processing a DELETE statement. |
Database Metrics | sql_insert_rt | Average amount of time spent in processing an INSERT statement. |
Database Metrics | sql_other_rt | Average amount of time spent in processing each of other statements such as DDL, DCL, and DTL statements. |
Database Metrics | sql_replace_rt | Average amount of time spent in processing a REPLACE statement. |
Database Metrics | sql_select_rt | Average amount of time spent in processing a SELECT statement. |
Database Metrics | sql_update_rt | Average amount of time spent in processing an UPDATE statement. |
Database Metrics | transaction_commit_count | Number of transactions committed per second. |
Database Metrics | transaction_count | Number of transactions processed per second. |
Database Metrics | transaction_rollback_count | Number of transactions rolled back per second. |
Database Metrics | transaction_timeout_count | Number of transactions that time out per second. |
Database Metrics | transaction_commit_rt | Average amount of time spent in committing a transaction. |
Database Metrics | transaction_rollback_rt | Average amount of time spent in rolling back a transaction. |
Database Metrics | transaction_rt | Average amount of time spent in processing a transaction. |
Database Metrics | active_session | Number of active sessions. |
Database Metrics | all_session | Total number of sessions. |
Database Metrics | request_queue_time | Average waiting time of an SQL statement in a queue. |
Database Metrics | trans_commit_log_count | Number of transaction logs committed per second. |
Database Metrics | clog_trans_log_total_size | Total size of transaction logs committed per second. |
Database Metrics | io_count | Average number of I/O operations per second in the SSStore. |
Database Metrics | io_read_count | Number of reads from the SSStore per second. |
Database Metrics | io_write_count | Number of writes to the SSStore per second. |
Database Metrics | io_read_rt | Average amount of time spent on each SSStore read. |
Database Metrics | io_rt | Average amount of time spent on each I/O operation. |
Database Metrics | io_write_rt | Average amount of time spent on each SSStore write. |
Database Metrics | io_read_size | Amount of data read from the SSStore per second. |
Database Metrics | io_size | Amount of data processed per second in the SSStore. |
Database Metrics | io_write_size | Amount of data written to the SSStore per second. |
Database Metrics | transaction_multi_partition_count | Number of distributed transactions per second. |
Database Metrics | transaction_partition_count | Number of transactions per second. |
Database Metrics | transaction_single_partition_count | Number of regular transactions per second. |
Database Metrics | uptime | Active time. |
Database Metrics | trans_commit_log_sync_rt | Average amount of time spent on each synchronization of transaction logs over the network. |
Host Metrics | load1 | Average system load in the last minute. |
Host Metrics | load15 | Average system load in the last 15 minutes. |
Host Metrics | load5 | Average system load in the last 5 minutes. |
Host Metrics | cpu_percent | CPU utilization. |
Host Metrics | memory_buffers | Size of the kernel buffer cache. |
Host Metrics | memory_cached | Size of the memory used by caches. |
Host Metrics | memory_free | Size of the available physical memory. |
Host Metrics | memory_used | Size of the physical memory used. |
Host Metrics | net_recv | Amount of data received per second. |
Host Metrics | net_send | Amount of data sent per second. |
Host Metrics | net_throughput | Network throughput. |
Host Metrics | ntp_offset_milliseconds | NTP clock offset. |
Host Metrics | ob_data_disk_percent | OceanBase Database data disk usage. |
Host Metrics | ob_clog_disk_percent | OceanBase Database log disk usage. |
Host Metrics | ob_data_disk_used_size | Size of occupied data disk space of the OBServer node. |
Host Metrics | ob_process_exists | Indicates whether the observer process of the OBServer node is alive. |
Host Metrics | ob_clog_io | Average number of I/O operations per second on the log disk of the OBServer node. |
Host Metrics | ob_clog_io_read | Average number of I/O reads per second from the log disk of the OBServer node. |
Host Metrics | ob_clog_io_write | Average number of I/O writes per second to the log disk of the OBServer node. |
Host Metrics | ob_clog_io_read_time | Average amount of time spent on each I/O read from the log disk of the OBServer node. |
Host Metrics | ob_clog_io_time | Average amount of time spent on each I/O operation on the log disk of the OBServer node. |
Host Metrics | ob_clog_io_write_time | Average amount of time spent on each I/O write to the log disk of the OBServer node. |
Host Metrics | ob_clog_io_byte | Average I/O throughput per second of the log disk of the OBServer node. |
Host Metrics | ob_clog_io_read_byte | Average throughput of I/O reads per second from the log disk of the OBServer node. |
Host Metrics | ob_clog_io_write_byte | Average throughput of I/O writes per second to the log disk of the OBServer node. |
Host Metrics | ob_clog_io_util | I/O usage of the log disk of the OBServer node. |
Host Metrics | ob_data_io | Average number of I/O operations per second on the data disk of the OBServer node. |
Host Metrics | ob_data_io_read | Average number of I/O reads per second from the data disk of the OBServer node. |
Host Metrics | ob_data_io_write | Average number of I/O writes per second to the data disk of the OBServer node. |
Host Metrics | ob_data_io_read_time | Average amount of time spent on each I/O read from the data disk of the OBServer node. |
Host Metrics | ob_data_io_time | Average amount of time spent on each I/O operation on the data disk of the OBServer node. |
Host Metrics | ob_data_io_write_time | Average amount of time spent on each I/O write to the data disk of the OBServer node. |
Host Metrics | ob_data_io_byte | Average I/O throughput per second of the data disk of the OBServer node. |
Host Metrics | ob_data_io_read_byte | Average throughput of I/O reads per second from the data disk of the OBServer node. |
Host Metrics | ob_data_io_write_byte | Average throughput of I/O writes per second to the data disk of the OBServer node. |
Host Metrics | ob_data_io_util | I/O usage of the data disk of the OBServer node. |
Obproxy Database performance | client_connections | Number of connected clients. |
Obproxy Database performance | server_connections | Number of connected servers. |
Obproxy Database performance | qps_rt | Average amount of time consumed by the OBServer in processing each SQL statement. |
Obproxy Database performance | tps | Number of transactions processed per second. |