This topic describes how to add an alert rule.
Procedure
Log in to the Cloud Monitor console.
In the left-side navigation pane, click Alerts > Alert Rules.
In the upper-left corner of the page, click Create Alert Rule.

Specify associated resources.
Product: Select OceanBase Cluster.
Resource Range: Select All Resources, Application Groups, or Instances.
If you select All Resources, CloudMonitor sends an alert when any metric of any instance of the specified service reaches the specified threshold.
If you select Application Groups, CloudMonitor sends an alert when a metric of an instance in a specified group reaches the specified threshold.
If you select Instances, CloudMonitor sends an alert when a metric of a specified instance reaches the specified threshold. To create an alert rule for a group, go to the group resource page.
Set the alert rule.

Rule Name: Enter a rule name. Make sure that it is different from the names of existing rules.
Metric Type: The metric type. Valid values:
Simple Metric: Select a metric and set the threshold and alert level for the metric.
Combined Metrics: Select an alert level and specify alert conditions for two or more metrics in the Multi-metric Alert Condition section.
Expression: Select an alert level and then configure an alert expression.
NoteIf a multi-metric alert rule is configured, the desired resource must have data on each metric. An alert can be triggered only if the related conditions are met. For example, if a multi-metric alert rule includes Internet metrics but the ECS instance is not configured with an elastic IP address (EIP), alerts cannot be triggered.
Dynamic Threshold: For more information about dynamic thresholds, see Overview and Create dynamic threshold-triggered alert rules.
Specify the metrics and thresholds for each alert level and select monitoring charts as needed.
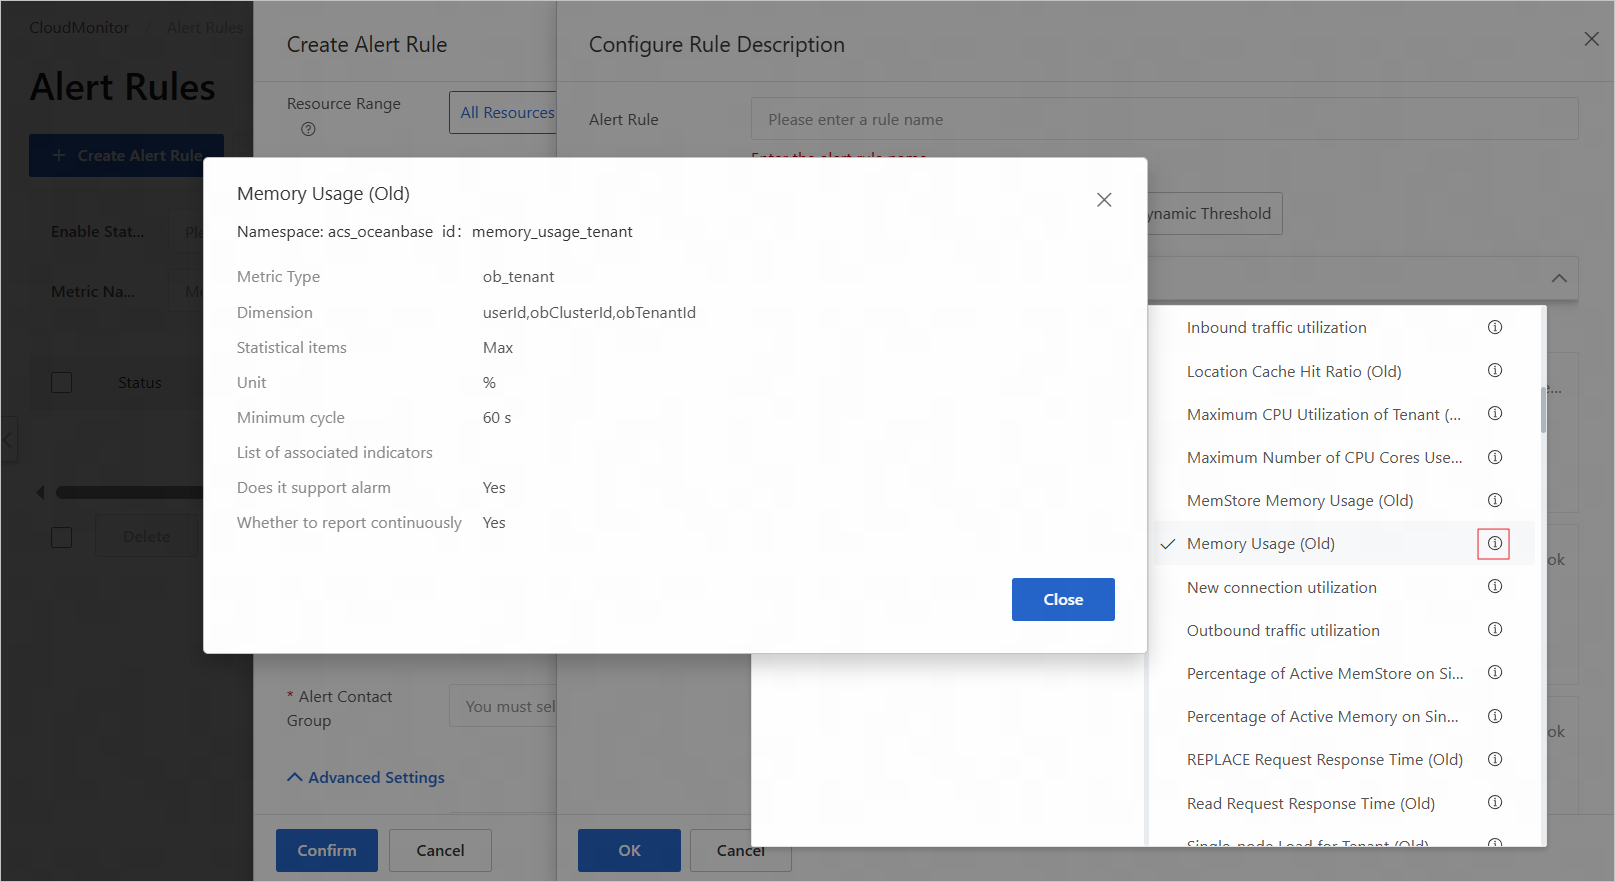
When you select a metric, you can click the information icon nect to it to view its details.
Specify other alert parameters.
Parameter
Description
Mute Period
The period during which CloudMonitor does not send the alert even when the service runs in the specified alert conditions. Valid values: 5 m, 15 m, 30 m, 60 m, 3 h, 6 h, 12 h, and 24 h.
CloudMonitor sends alerts when a metric reaches the alert threshold. However, CloudMonitor does not send the alert during the mute period even if the metric value remains higher than the alert threshold. If the metric value does not return to normal after the mute period ends, CloudMonitor starts sending the alert again.
For example, if you specify 12 h for Mute Period, and the metric value has not restored to normal after 12 hours, then CloudMonitor starts sending the alert again.
Effective Period
The period during which the alert rule takes effect. CloudMonitor sends alerts only during the validity period of the alert rule.
NoteWhen an alert rule expires, CloudMonitor does not send alerts. However, you can view historical alerts in Alert History.
Tag
The tags of the alert rule. You must specify the name and value of a tag.
NoteYou can set up to six tags for a rule.
Alert Contact Group
The group of contacts to whom CloudMonitor sends alerts.
Alerts of the Application Groups type will be sent to the alert contacts in the alert contact group. An alert contact group can be comprised of one or more alert contacts.
For more information, see Create an alert contact or alert group.
Advanced Settings
The advanced settings of the alert rule.
Recovery Notification: Chooses whether to send the corresponding recovery notification when the alert is recovered.
For Alert Callback, Push Channel, and Method to handle alerts when no monitoring data is found, see Create an alert rule.
Click Confirm.