On the cluster database details page, you can view monitoring information for the tenant’s databases.
View cluster database monitoring data
Go to the OceanBase Management Console.
In the left navigation pane, click Instances.
Find the target instance in the instance list and click the instance name to open the Instance Workspace.
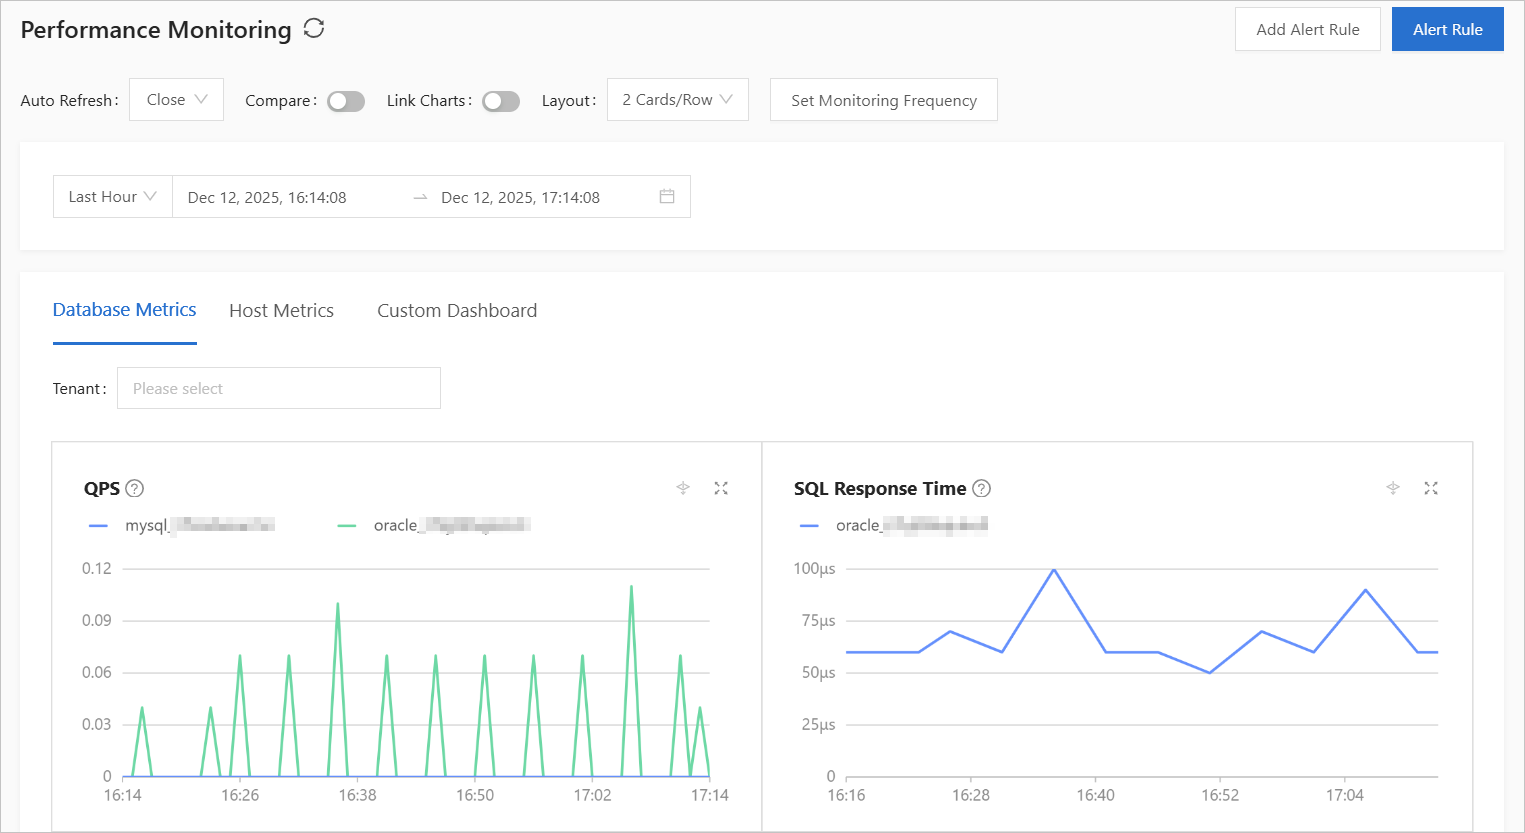
In the workspace, click Performance Monitoring in the left navigation pane.
Click the Cluster Databases tab.
The cluster database monitoring page shows monitoring data for all tenants over the last hour by default.
Select a tenant from the tenant drop-down list to view its monitoring data. If you select multiple tenants, click a tenant name in the chart to filter and view data for that tenant.
You can set a custom time range to view data for that period.
 You can view the following monitoring data:
Monitoring metric
Metric name
Unit
Description
QPS
sql_all_count
times/s
Number of SQL statements processed per second by the tenant database.
SQL response time
sql_all_rt
μs
Average processing time for SQL statements.
TPS
transaction_count
times/s
Number of transactions requested by the tenant database per second.
This monitoring data represents the total of the following request classes:
Insert
Replace
Update
Delete
Transaction response time
transaction_rt
μs
Average processing time for transactions.
Session count
all_session
count
Current number of sessions in the tenant database.
Request queue wait time
request_queue_time
μs
Time an SQL statement waits in the queue.
Transaction log count
trans_commit_log_count
times/s
Number of transaction logs committed per second by the tenant database.
Transaction log size
clog_trans_log_total_size
MiB
Total size of transaction logs committed per second by the tenant database.
IO count
io_count
times/s
Number of IO operations per second on SSStore.
IO time
io_rt
μs
Average time per read or write operation on SSStore.
IO throughput
io_size
byte
Data volume processed per second by SSStore.
Transaction count
transaction_partition_count
Count (times per second)
Number of transactions per second.
Uptime
uptime(s):
s
Available time
Network sync time for transaction logs
trans_commit_log_sync_rt
ms
Average network sync time per transaction log.
Database work time
ob_worktime
s
Database work time.
Database non-idle wait time
ob_no_idle_waiting_time
s
Database non-idle wait time.
Wait event count
ob_waiteven_count
count
Number of wait events while the database is in a specific state.
Number of execution events for the database in a specific state
ob_sql_event
count
Number of execution events while the database is in a specific state.
Total log disk space
ob_tenant_log_disk_total_bytes
GiB
Total log disk space.
Log disk usage
ob_tenant_log_disk_used_bytes
GiB
Log disk usage.
Data disk usage
ob_tenant_disk_used_percentage
GiB
Data disk usage.
Data volume
ob_tenant_data_size
GiB
Data volume.
Binlog disk usage
ob_tenant_binlog_disk_used
GiB
Binlog disk usage.
The following metrics are available only for key-value (KV) instances:
Monitoring metric
Metric name
Unit
Description
Average operations per second for single operations
single_kv_all_count
times/s
Average number of all operations per second for single operations.
Average time per single operation
sql_all_rt
ms
single_kv_all_rt: Average time per single operation.
Average operations per second for batch operations of the same type
multi_kv_all_count
times/s
Average number of operations per second for batch operations of the same type.
Average time per batch operation of the same type
multi_kv_all_rt
ms
Average time per batch operation of the same type.
TABLE operation response time quantile
kv_table_all_rt_p99
ms
P99 response time for TABLE operations.
Average rows per batch operation of the same type
multi_kv_all_row
rows
Average number of rows per batch operation of the same type.
Average operations per second for mixed batch operations
batch_kv_all_count
times/s
Average number of operations per second for mixed batch operations.
Average time per mixed batch operation
batch_kv_all_rt
ms
Average time per mixed batch operation.
Average rows per mixed batch operation
batch_kv_all_row
rows
Average number of rows per mixed batch operation.
Average query operations per second
query_kv_select_count
times/s
Average number of query operations per second.
Average query time
query_kv_select_rt
Average query time.
Average rows per query operation
query_kv_select_row
rows
Average number of rows per query operation.
Average query-and-modify operations per second
query_and_muate_kv_select_count
times/s
Average number of queries per query-and-modify operation.
Average time per query-and-modify operation
query_and_muate_kv_select_rt
ms
Average response time per query-and-modify operation.
Average rows per query-and-modify operation
query_and_muate_kv_select_row
rows
Average number of rows per query-and-modify operation.
HBase operations per second
hbase_all_count
times/s
Total number of HBase operations.
Average processing time for all HBase operations
hbase_rt
ms
Average processing time for all HBase operations.
HBase operation response time quantile
kv_hbase_all_rt_p999
ms
P999 response time for HBase operations.
Average rows per HBase operation
hbase_all_rows
rows
Total number of rows for all HBase operations.
NoteThe metric names listed above are valid values for the Metrics request parameter in the DescribeMetricsDataV2 - Query monitoring metrics OpenAPI.