After you enable the mitigation analysis feature, the Mitigation Logs page records traffic scrubbing, blackhole filtering, and traffic rerouting events for your Anti-DDoS Origin instance. Query and filter these logs to investigate when an attack occurred, what type of mitigation was applied, and how long it lasted.
Prerequisites
Before you begin, ensure that you have:
Enabled the mitigation analysis feature. For more information, see Enable mitigation analysis.
Query mitigation logs
Log on to the Traffic Security console.
In the left-side navigation pane, choose Network Security > Anti-DDoS Origin > Mitigation Logs.
In the top navigation bar, select the resource group and region for your instance.
For an Anti-DDoS Origin 1.0 instance or an elastic IP address (EIP) with Anti-DDoS (Enhanced) enabled, select the region where the instance or EIP resides.
For an Anti-DDoS Origin 2.0 instance, select All Regions.
On the Mitigation Logs page, select an Anti-DDoS Origin instance.
Enter a query statement in the search box.
A query statement uses the format
Search statement|Analytic statement. For syntax details, see Search syntax and SQL syntax and functions.In the upper-right corner, set a time range for the query.
NoteResults may include logs from up to 1 minute before or after the specified time range.
Click Search & Analyze.
Analyze query results
The results page has four main areas, each suited to a different part of your investigation:
Query result histogram — shows the log volume distribution across time. Start here to identify when attack traffic spiked.
Raw Logs tab — shows the individual log entries matching your query. Use this to examine specific events and field values.
Graph tab — renders results as charts. Use this for trend analysis or to build dashboards.
LogReduce tab — clusters similar logs together. Use this to identify patterns across large log volumes.
By default, a query returns a maximum of 100 rows. To retrieve more rows, add a LIMIT clause to your analytic statement. For more information, see LIMIT clause.
Query result histogram
The histogram displays log distribution across time intervals. ![]()
Hover over a green rectangle to see the time interval and the number of logs in that interval.
Double-click a green rectangle to zoom in to a finer time granularity and view the matching raw logs.
Raw Logs tab
The Raw Logs tab shows the log entries that match your query. Switch between Table and Raw Data views depending on how you want to read the data. ![]()
The following operations are available on this tab:
Quick analysis: Analyze the distribution of a specific field within the selected time period. For more information, see Quick analysis.
Click the
 icon to toggle between field names and field aliases. Aliases are set when you create indexes. For example, if you set the alias of
 host_nametohost, selecting Show Field Aliases displayshostin the Quick Analysis list.NoteIf a field has no alias, the field name is displayed regardless of the Show Field Aliases setting.
Contextual query (Raw Data view only): Click the
 icon next to a log entry to view the surrounding context from the raw log file. For more information, see Contextual query.Important
Contextual query is supported only for logs collected by Logtail.
LiveTail (Raw Data view only): Click the
 icon next to a log entry to monitor logs in real time and extract key fields. For more information, see LiveTail.Important
LiveTail is supported only for logs collected by Logtail.
Tag Configurations (Raw Data view): Click the
 icon and select Tag Configurations to hide fields that are less relevant to your investigation.
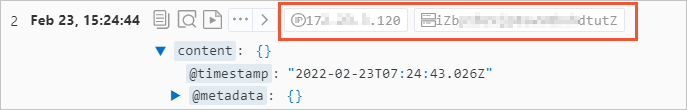
Column Settings (Table view): Click the
icon and select Column Settings to choose which fields appear as columns. Column names map to field names, and column values map to field values. 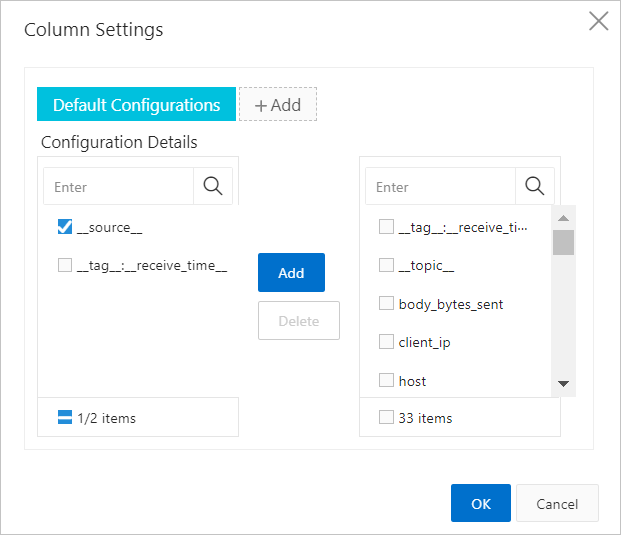
JSON Configurations (Table or Raw Data view): Click the
icon and select JSON Configurations to set the expansion level for JSON fields.Event Settings (Table or Raw Data view): Click the
icon and select Event Settings to configure events for raw logs. For more information, see Configure events.Download logs: Click the
 icon to download logs. Specify the download method and the log range. For more information, see Download logs.
Graph tab
After running a query, open the Graph tab to visualize the results.
View charts: Simple Log Service renders query results into charts. Available types include tables, line charts, and bar charts, in both Pro and Standard versions. For more information, see Overview of charts (Pro) and Chart overview.
Save to a dashboard: Click Add to New Dashboard to save the current chart to a dashboard for ongoing monitoring. For more information, see Overview of visualization.
Configure drill-down events: Set up drill-down interactions to switch between data dimensions and analysis granularities. For more information, see Drill-down events.
LogReduce tab
On the LogReduce tab, click Enable LogReduce to cluster similar logs. This is useful when investigating large volumes of mitigation events to identify repeated patterns. For more information, see LogReduce.
Set up alerts and saved searches
From the Search & Analyze page, you can save your query for future use or set up automated alerting:
Alerts: Click the
 icon to create an alert rule based on the current query results. For more information, see Configure an alert monitoring rule in Log Service.
Saved searches: Click the
 icon to save the current query statement as a saved search. Saved searches let you rerun frequently used queries without re-entering the statement each time. For more information, see Saved search.