With Simple Log Service (SLS), you can query and analyze billions of log entries in seconds using a powerful SQL-based syntax. This guide walks you through the basics of enabling indexing and performing your first queries using an NGINX log example.
Prerequisites
A project and a Standard Logstore are created, and logs are collected. For more information, see Manage projects, Create a Logstore, and Data collection overview.
Step 1: Create indexes
Log on to the Simple Log Service console.
In the Projects section, click the project you want.
On the tab, click the logstore you want.
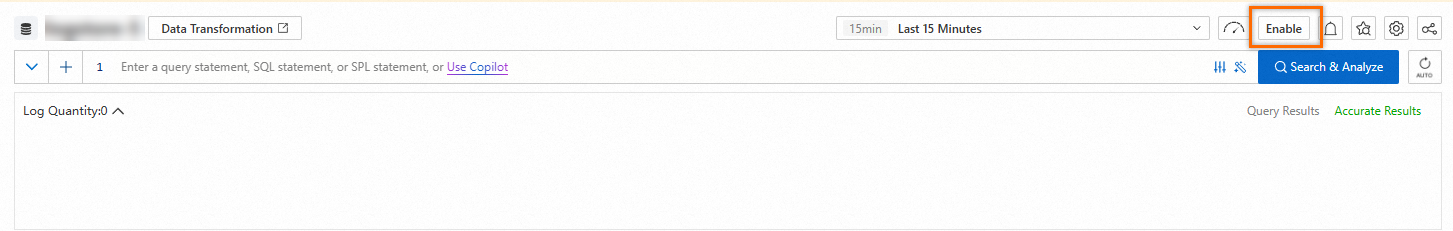
On the query and analysis page of the Logstore, click Enable.
NoteYou can query the latest data approximately 1 minute after you click Enable.
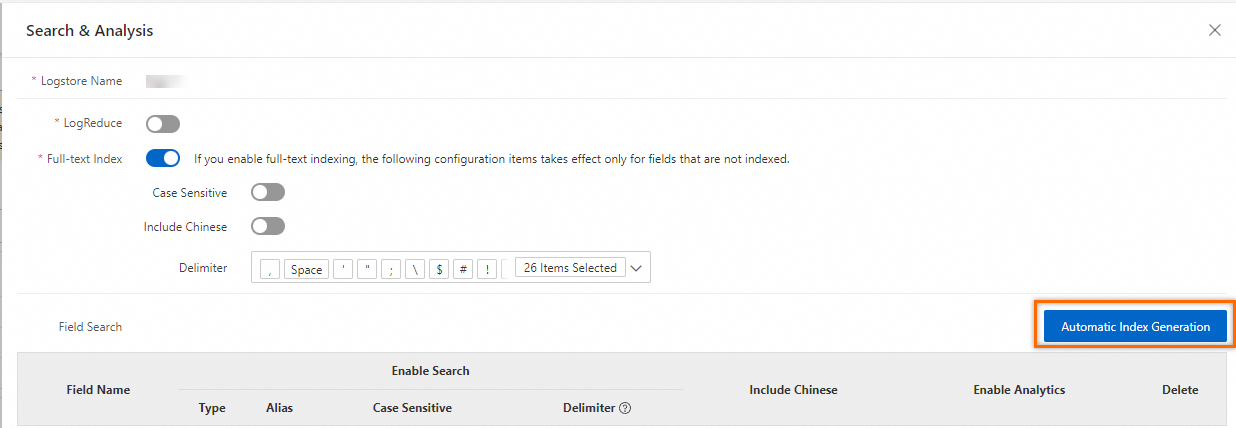
After you click Enable, Full-text Index is automatically turned on. In the Search & Analysis panel, click Automatic Index Generation. SLS automatically generates field indexes for you by inspecting the first captured log entry.
NoteRetain the default values for other parameters. For more information, see Create indexes.
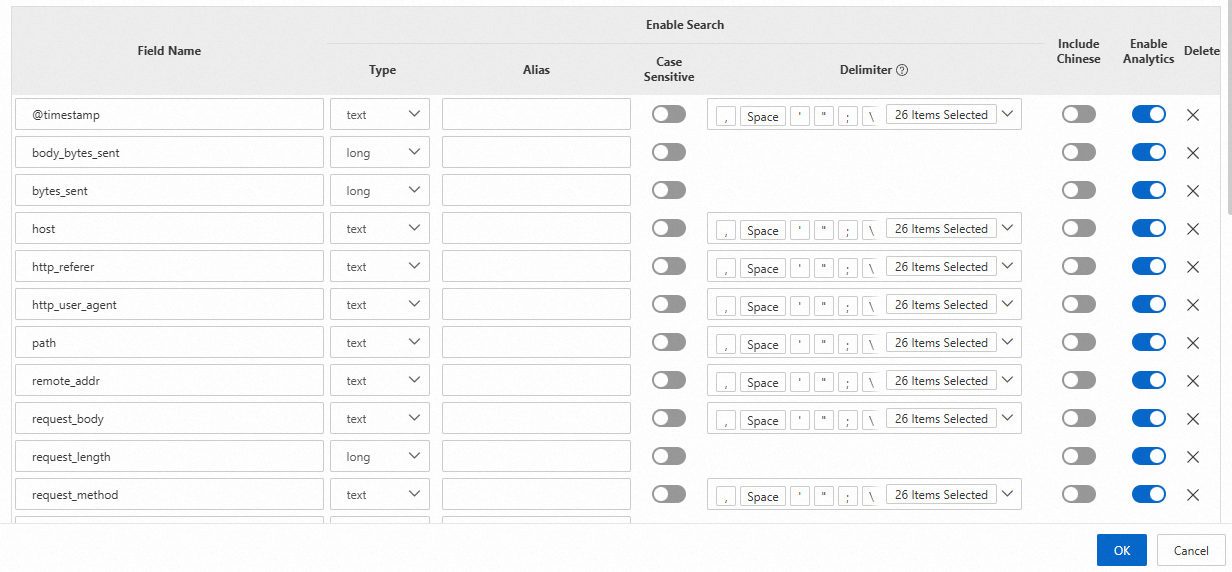
The following figure shows the settings of the generated field indexes.
Step 2: Query and analyze logs
On the query and analysis page of a Logstore, specify a search or an analytic statement and click Search & Analyze.
Search statement
Use a search statement for fast, keyword-based filtering of your logs. Specify conditions in a search statement to filter data. The conditions include time ranges, request types, and keywords. A search statement can be independently executed. For more information, see Query syntax and functions.
For example, execute the following search statement to query the logs whose request status code is
200:status :200For more information, see Query statement examples.
Analytic statement
Use an analytic statement to perform complex aggregations, calculations, and statistical analysis on your query results using SQL. For example, use an analytic statement to calculate an average value within a specific period of time or compare data in different periods of time. An analytic statement must be executed together with a search statement in the
Search statement|Analytic statementformat. For more information, see SQL syntax and functions.For example, execute the following analytic statement to query all log records and analyze the number of requests in different states:
* | SELECT status, count(*) AS PV GROUP BY statusFor more information about query and analysis examples, see SQL functions and SQL clauses.
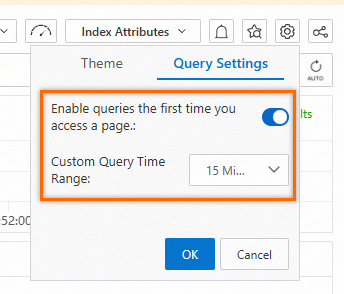
By default, when you click a Logstore in the Logstores list, the system automatically performs a query operation on the query and analysis page. To disable the feature or specify a query time range, perform the following operations: In the upper-right corner of the query and analysis page, click the  icon. On the Query Settings tab, turn off Enable queries the first time you access a page or configure the Custom Query Time Range parameter.
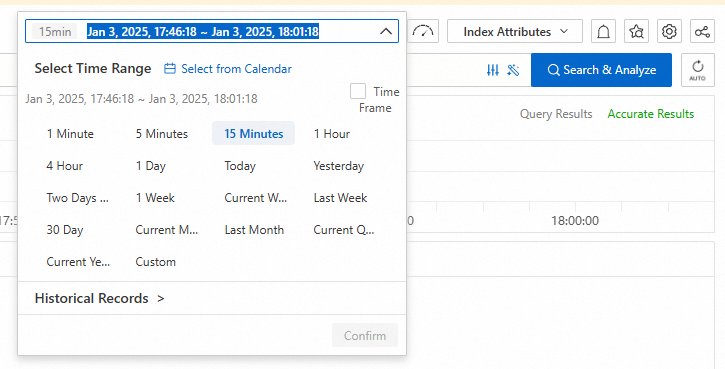
Specify a time range
Use one of the following methods to specify a time range for data that you want to query or analyze. If you specify a time range in an analytic statement, the time range is used for query and analysis.
In the upper part of the query and analysis page, select a time range from the drop-down list. Example: Last 15 Minutes.
In the analytic statement, use the
__time__field to specify a time range, which is a closed time interval. Example:* | SELECT * FROM log WHERE __time__>1731297600 AND __time__< 1731310038In the analytic statement, use the from_unixtime or to_unixtime function to convert the format of the specified time. Examples:
* | SELECT * FROM log WHERE from_unixtime(__time__) > from_unixtime(1731297600) AND from_unixtime(__time__) < now()* | SELECT * FROM log WHERE __time__ > to_unixtime(date_parse('2024-10-19 15:46:05', '%Y-%m-%d %H:%i:%s')) AND __time__ < to_unixtime(now())
By default, only 100 rows of data are returned after you execute a query statement. To increase the number of rows of data that are returned, use a LIMIT clause. For more information, see LIMIT clause.
Description of the query and analysis page
Page overview
Histogram
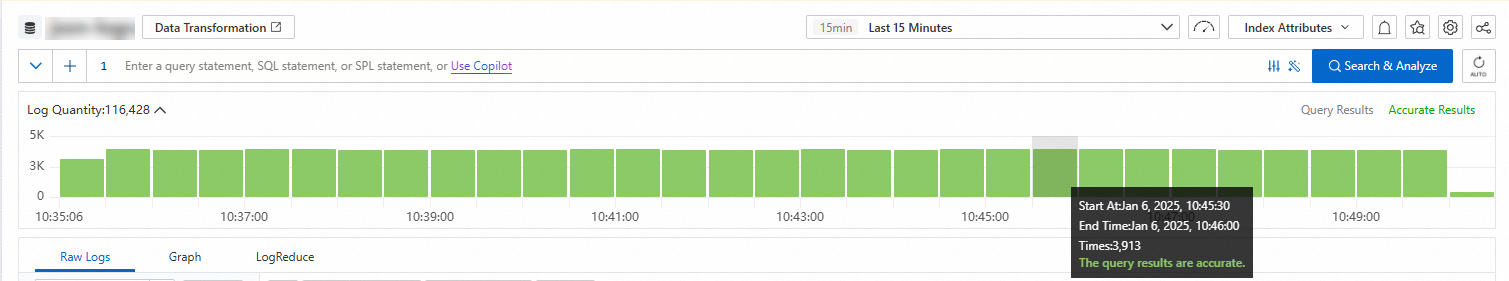
When you move the pointer over a green rectangle, view the period of time that is represented by the rectangle and the number of returned logs within the period of time.
If you double-click a green rectangle, view log distribution in a finer-grained manner. You can also view the returned logs within the specified period of time on the Raw Logs tab.
Raw Logs
Log details
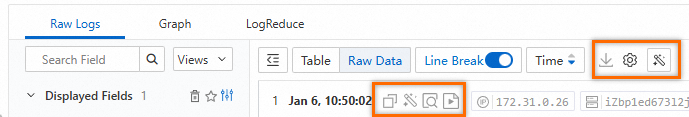
Click Table or Raw Data to switch between the display formats of logs.
 > Download Log: allows you to download logs to your computer. For more information, see Download logs.
  > JSON Configurations: allows you to specify the display type of JSON and the level of JSON expansion.
 - > Event Settings: allows you to configure events for raw logs. For more information, see Configure events.
 : allows you to copy log content.
  : allows you to label specific information or query error information in log content. This icon also serves as a copilot.
  : allows you to view the context information of a specific log in the raw log file. Use contextual query only on the logs that are collected by Logtail. For more information, see Contextual query.
  : allows you to monitor log content in real time and extract key log information. Use LiveTail only on the logs that are collected by Logtail. For more information, see LiveTail.
Displayed fields
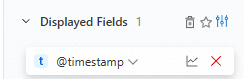
Below Displayed Fields, move the pointer over a field and click the
 icon to remove the field from Displayed Fields. Then, the field is no longer displayed in the log content on the right side.
  : allows you to add a view to your favorites. After fields are displayed in Section 5, add the current view to your favorites. Then select the view from the drop-down list above Section 4.
  > Tag Settings: allows you to add fields as system tags.
 - > Alias: After you turn on Alias, the names of fields are replaced with aliases. If you do not specify an alias for a field, the name of the field is retained. For more information about how to specify an alias for a field, see Create indexes.
Indexed fields
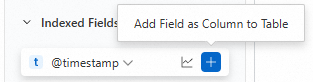
Below Indexed Fields, move the pointer over a field and click the
 icon to add the field to Displayed Fields. Then, the field is displayed in the log content on the right side.
  : allows you to view field details, including Basic Distribution and Statistical Metrics. For more information, see Field settings.
Graph
Simple Log Service renders the results of a query statement to charts. Simple Log Service provides various types of charts, such as tables, line charts, and column charts. For more information, see Charts. After you execute a query statement, view the query and analysis results on the Graph tab. 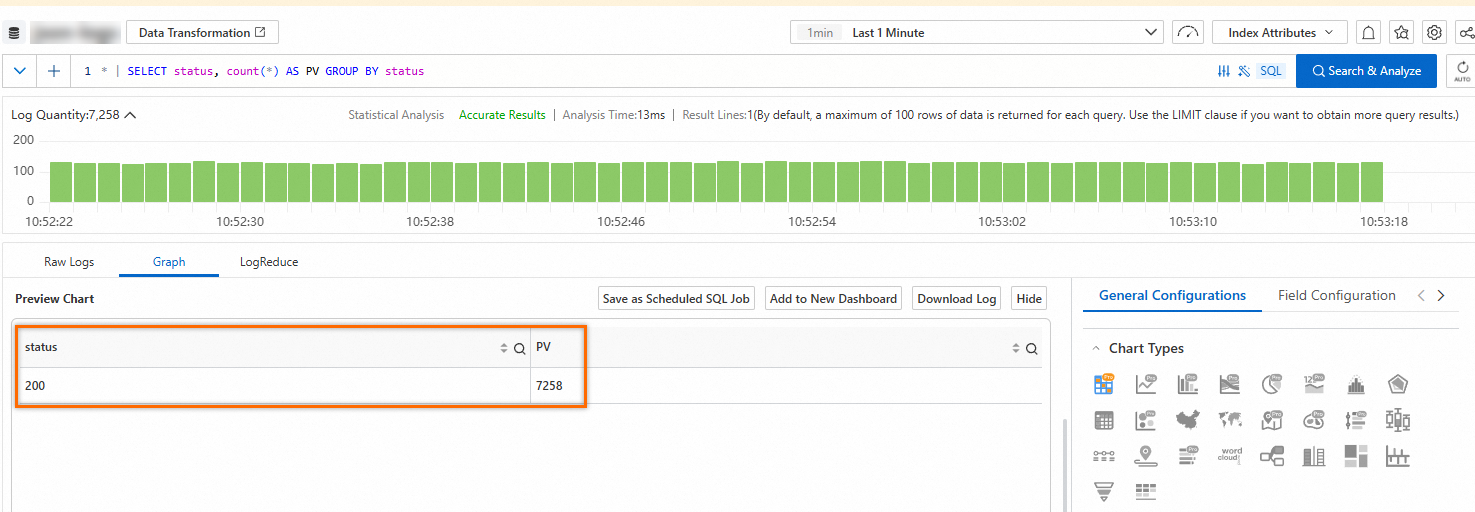
Description of other features on the Graph tab:
Add to New Dashboard: Simple Log Service provides dashboards on which you can analyze data in real time. Click Add to New Dashboard to save the query and analysis results as a chart to a dashboard. For more information, see Visualization overview.
Save as Scheduled SQL Job: Simple Log Service provides Scheduled SQL. Use it to automatically analyze data at a scheduled time and aggregate data for storage. You can also use it to project and filter data. For more information, see How Scheduled SQL works.
Interaction Occurrences: Interaction occurrences are important for data analysis. Use interaction occurrences to switch between the levels of data dimensions and the analysis granularities to obtain more detailed information. For more information, see Configure an interaction occurrence for a dashboard to perform drill-down analysis.
LogReduce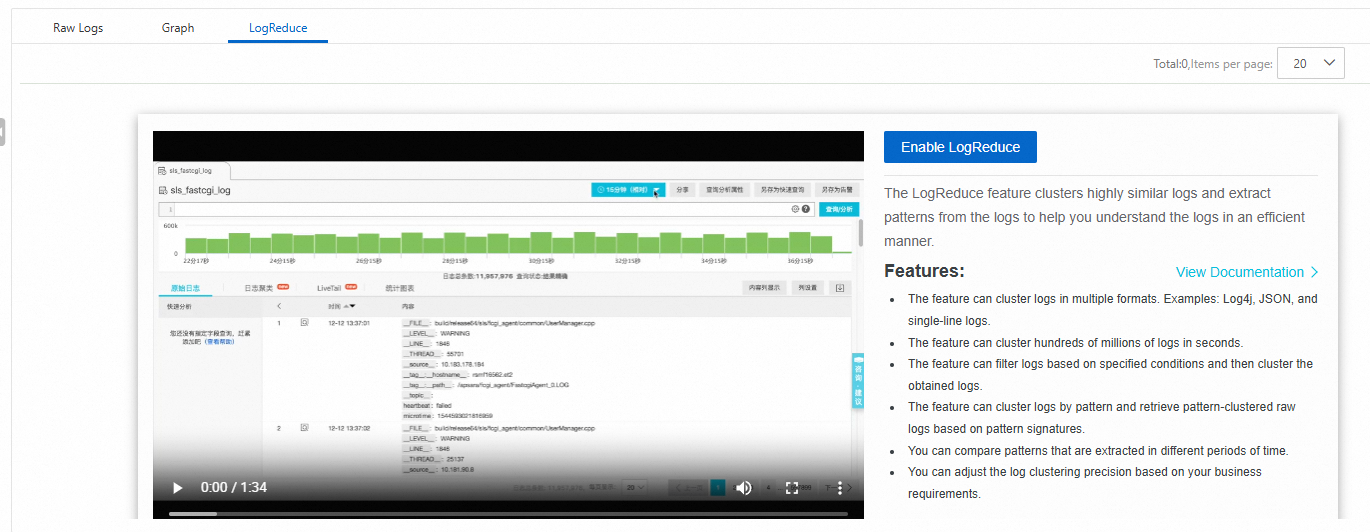
On the LogReduce tab, click Enable LogReduce to cluster similar logs during log collection. For more information, see LogReduce.
SQL Enhancement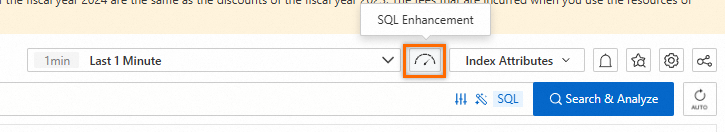
Click the ![]() icon in the upper-right corner to enable Dedicated SQL. If you use Standard SQL to analyze a large amount of data that is generated over a period of time, SLS cannot analyze all data in a single query request. Enable Dedicated SQL to increase computing resources and the amount of data that can be analyzed in a single query request. For more information, see Enable Dedicated SQL.
icon in the upper-right corner to enable Dedicated SQL. If you use Standard SQL to analyze a large amount of data that is generated over a period of time, SLS cannot analyze all data in a single query request. Enable Dedicated SQL to increase computing resources and the amount of data that can be analyzed in a single query request. For more information, see Enable Dedicated SQL.
Alerting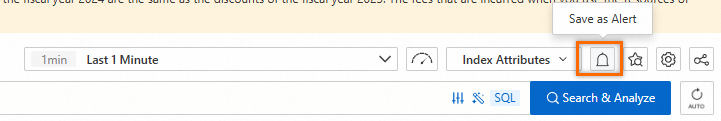
Click the  icon in the upper-right corner to configure alerts for the query and analysis results. For more information, see Quickly set up log-based alerting.
Saved search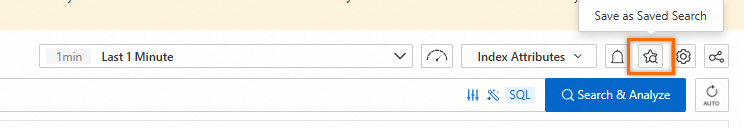
Click the  icon in the upper-right corner to save a query statement as a saved search. Use a saved search to quickly perform query and analysis operations. For more information, see Saved search.
Sharing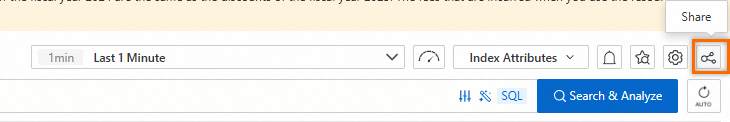
Click the  icon in the upper-right corner to copy the link to the current page and share the link with other users. For more information, see Embed console pages and share log data.
Data transformation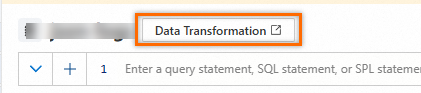
Click Data Transformation in the upper part of the query and analysis page to go to the data transformation page. Data transformation lets you standardize data, extract information, cleanse and filter data, and distribute data to multiple logstore. For more information, see Create a data transformation job (new version).