I asked my coding agent to refactor a module last week. It thought for 17 seconds, called four tools, retried one of them, and got it right. Fine.
Then I wanted to know why it took 17 seconds. The session log had everything that happened, in order, with timestamps. So I started subtracting timestamps by hand — and gave up around the second tool call, because the log doesn't tell you which LLM call belonged to which step, or that one of those calls was a retry of a call that failed.
Logs answer what happened. They can't answer where the time went, because that's a question about a tree, and a log is a flat list.
That's what traces are for, and it turns out you can get proper ones out of DeepSeek Harness with one command.
DeepSeek Harness (DSH) is DeepSeek's open-source coding-agent runtime. The model generates, the harness is the layer that actually gets work done — it holds session state, drives the ReAct loop, executes tool calls, enforces permissions, and spawns sub-agents. It ships as an npm package (@deepseek-ai/dsh) with web, terminal, and headless front ends, and a plugin system built on Cordis whose user-level config file is watched and hot-reloaded on save.
If you're on Claude Code or Codex instead, skip to the last section — same data model, different install path.
@loongsuite/dsh-plugin is a native DSH plugin that turns session, agent-loop, LLM, and tool lifecycle events into OpenTelemetry GenAI spans and pushes them over plain OTLP/HTTP. No collector, no sidecar — it runs inside the harness process.
The repo ships a quickstart that spins up Jaeger v2, which speaks OTLP natively, so Jaeger is the only thing you need running:
docker compose -f examples/quickstart/docker-compose.yml up -d

dsh plugin --profile web add @loongsuite/dsh-plugin

OTEL_SERVICE_NAME=dsh-agent \
OTEL_EXPORTER_OTLP_ENDPOINT=http://localhost:4318 \
OTEL_METRICS_EXPORTER=none \
  dsh --profile web
Now ask the agent for something that takes a few steps — "summarize this repository and list its dependencies" does the job — then open http://localhost:16686, pick the dsh-agent service, and open the newest trace.
Two notes on that last command. OTEL_METRICS_EXPORTER=none is there because Jaeger has no metrics endpoint; leave it out and the metric exporter retries /v1/metrics forever. Those failures are isolated and never touch agent execution, but they're noise in your terminal. And that's the standard OTel variable, not something we invented — the plugin also honours OTEL_EXPORTER_OTLP_HEADERS, the signal-specific endpoint variants, and OTEL_RESOURCE_ATTRIBUTES, so containers and CI never need a config file.
One trace per turn. A two-step turn gives you eight spans:
ENTRY  enter_ai_application_system              605ms
└── AGENT  invoke_agent standard                605ms
    ├── STEP  react step                        255ms
    │   ├── LLM   chat deepseek-v4-pro           81ms
    │   └── TOOL  execute_tool read_file         40ms
    └── STEP  react step                        330ms
        ├── LLM   chat deepseek-v4-pro           81ms
        └── TOOL  execute_tool bash             120ms
Here's a real one, a 17-second turn in Langfuse:
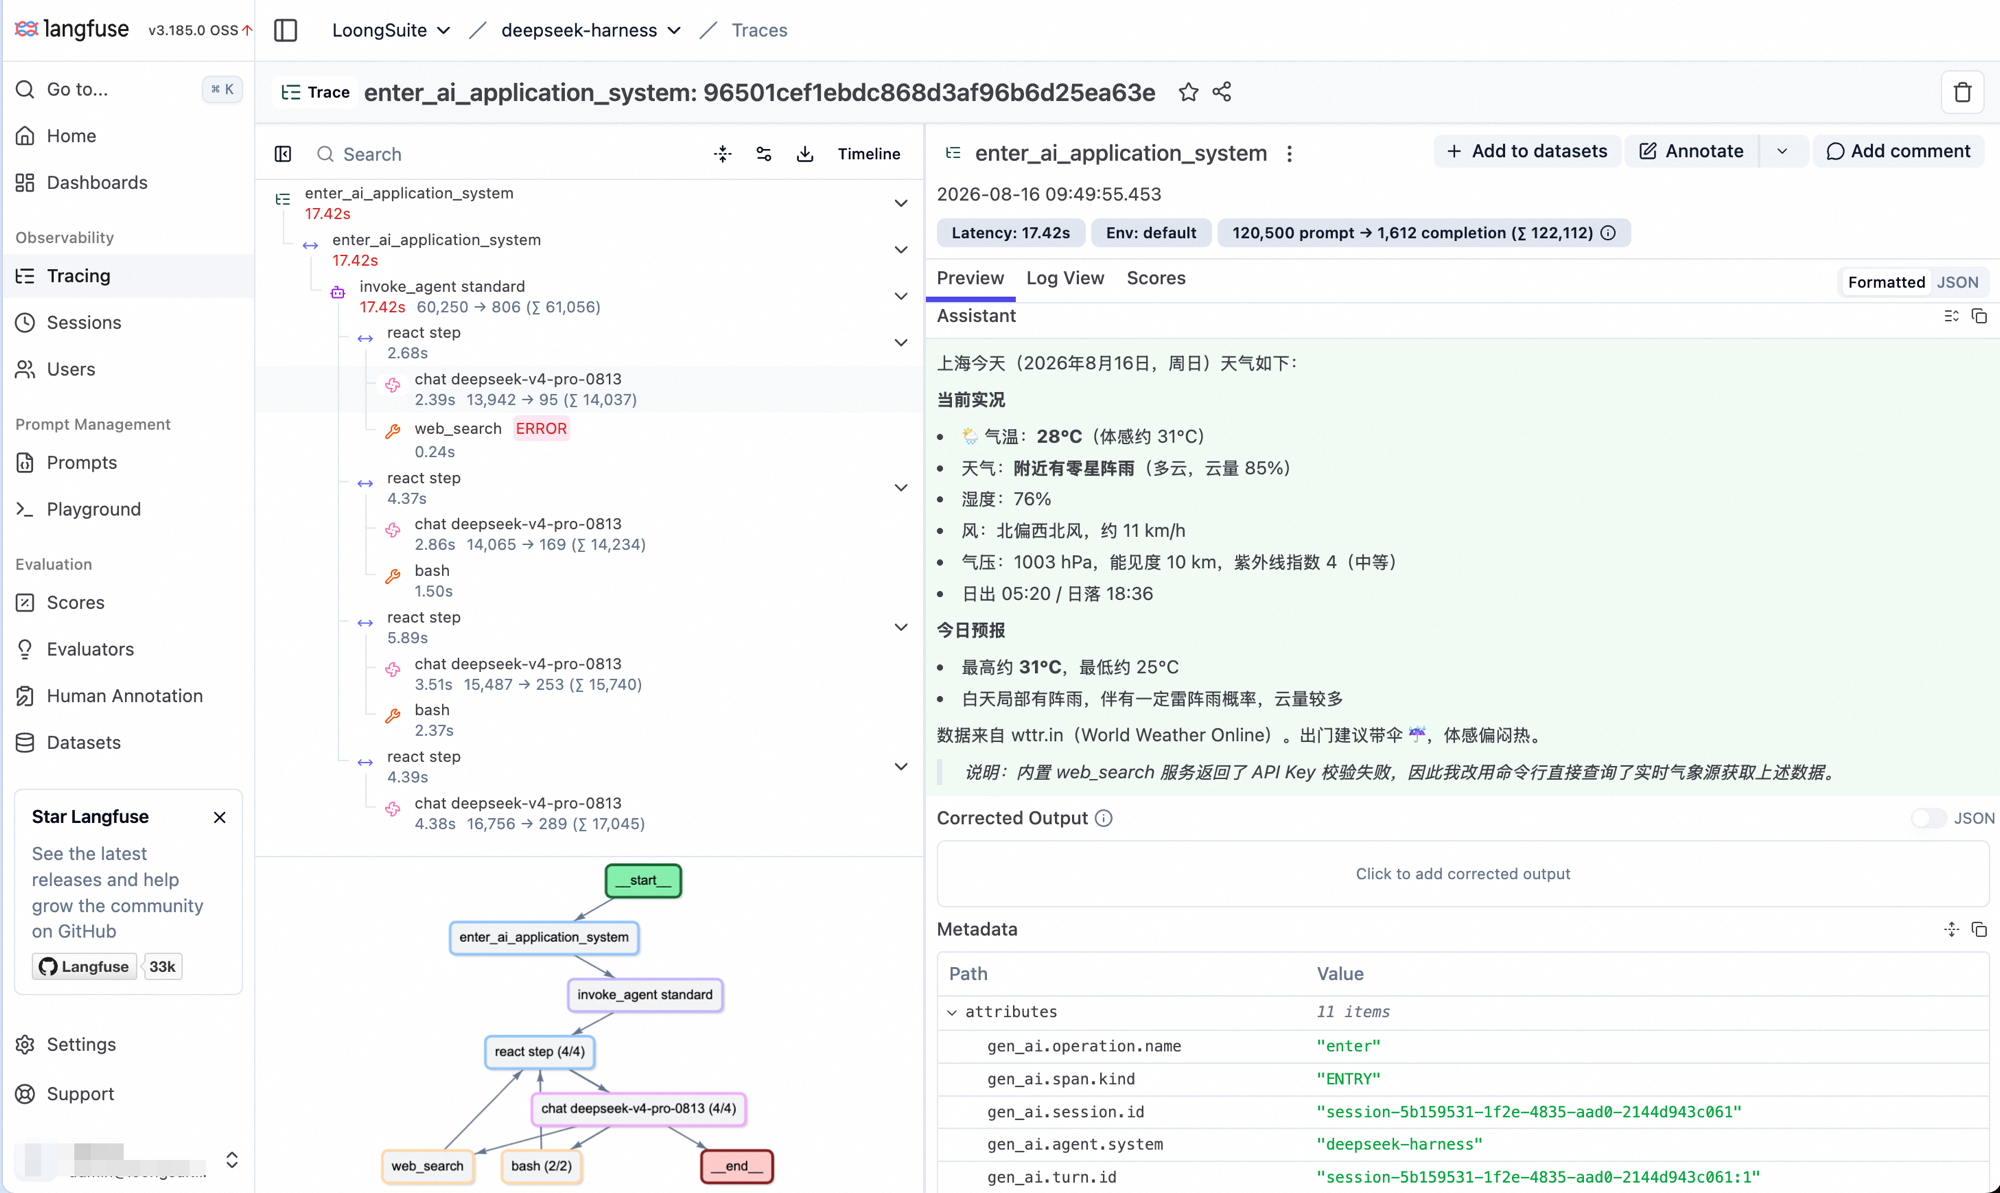
The 17.42 seconds resolve immediately: steps 3 and 4 ate five seconds each, while the slowest single model call was only 4.38s. So most of that turn was tool execution, not inference — the opposite of what I'd assumed.
A few other things the tree makes obvious that the log didn't:
STEP with three LLM children is a step that took three attempts.web_search errored twice and the model finished the job with bash instead. The error status sits on the TOOL spans; you don't go grepping for it.gen_ai.response.time_to_first_token per call, next to the token counts.gen_ai.session.id and gen_ai.turn.id are on the spans, so a backend like Langfuse can group many turns into one conversation.This part cost me an afternoon, so it's worth spelling out.
Two invariants hold on every LLM span:
gen_ai.usage.cache_read.input_tokens is included ingen_ai.usage.input_tokens, not a sibling of it.input_tokens + output_tokens == total_tokens. Reasoning tokens are reported separately but already counted inside output_tokens.That first one bit us. An earlier build reported cached tokens alongside input tokens, so any dashboard computing cache_read / input produced cache hit rates above 100%. If you're building cost dashboards on GenAI spans from any source, check which convention it follows before trusting the ratio — providers disagree about this, and the attribute names look identical either way.
There's a second gotcha, and this one is by design. The AGENT span carries the aggregate usage for the whole turn, because you usually want one number per turn. But a backend that sums usage across every span in a trace will therefore count that aggregate twice, once on AGENT and once across the LLM spans. Langfuse works this way. So when you quote a token total, read it off the AGENT span, or add up the LLM spans yourself — don't use the trace-level figure.
Jaeger is fine for "did this work", but Langfuse understands sessions and token costs, and it's straightforward to self-host. Its OTLP receiver lives at /api/public/otel and wants Basic auth:
export AUTH_STRING=$(echo -n "pk-lf-xxx:sk-lf-xxx" | base64)Then edit the plugin's row in $DSH_HOME/profiles/<profile>/cordis.patch.yml (~/.dsh by default — and remember DSH hot-reloads this file, so no restart):
- id: loongsuite-observability
  config:
    endpoint: http://localhost:3000/api/public/otel   # or https://cloud.langfuse.com/api/public/otel
    serviceName: dsh-agent
    headers:
      Authorization: Basic <AUTH_STRING>
      x-langfuse-ingestion-version: "4"
    exportMetrics: false
The base URL is enough; the plugin appends /v1/traces itself. The x-langfuse-ingestion-version: 4 header opts into Langfuse's v4 data model — without it your spans land on the old one. And exportMetrics: false (or OTEL_METRICS_EXPORTER=none) is required rather than optional here, because Langfuse's OTLP endpoint accepts traces only.
Anything else that speaks OTLP works the same way: Grafana Tempo, SigNoz, whatever you already run.
The plugin only knows about DSH. If you switch between several agents during the day — and most people do — there's a sibling project, LoongSuite Pilot, that covers around 19 of them (Claude Code, Codex, Cursor, Qwen Code, OpenCode, DSH, and friends) from a single local daemon.
It detects which agents are actually installed, deploys whatever integration each one needs (DSH gets a reversible YAML patch), and normalizes every native format into the same GenAI event schema. Usefully, it needs no backend at all to be worth running: by default it writes normalized JSONL locally and serves a dashboard showing per-agent token usage, sessions, models, and tools. Point it at Langfuse when you want to:
{
  "collectTrace": true,
  "serviceName": "my-agents",
  "otlpTrace": {
    "endpoint": "http://localhost:3000/api/public/otel",
    "headers": {
      "Authorization": "Basic <AUTH_STRING>",
      "x-langfuse-ingestion-version": "4"
    },
    "captureMessageContent": false
  }
}
Running both the plugin and Pilot on one machine is fine — they use different injection points and don't fight — but don't send both copies to the same backend unless you enjoy duplicate traces.
Prompts, responses, tool definitions, tool arguments, and tool results are not collected by default, in either project. Spans carry structural metadata and token counts, nothing you wrote.
Turning it on is captureContent: true in the plugin (or OTEL_INSTRUMENTATION_GENAI_CAPTURE_MESSAGE_CONTENT=SPAN_ONLY), and otlpTrace.captureMessageContent in Pilot. One deliberate asymmetry: an explicit captureContent: false in the profile always beats the environment variable, so you can pin a profile to "never capture content, no matter what the shell says".
Two more design choices worth knowing about, since instrumentation that misbehaves is worse than no instrumentation:
TracerProvider and MeterProvider. It never replaces the global OTel providers, so it can't disturb instrumentation your own code already has.Before you enable content capture, think about where it ends up: source code, credentials, and personal data all ride along inside prompts. Check your backend's retention and access controls first. Pilot additionally supports per-agent content policies and secret masking before export.
If you use a coding agent daily and have started wondering where the time and tokens actually go, this is a two-minute experiment: dsh plugin add, an endpoint, and a Jaeger container.
Both are Apache-2.0 and follow the OpenTelemetry GenAI semantic conventions, so your data isn't locked into anyone's UI.
It's early — the plugin is on a 0.1.x line — and I'd particularly like to hear from anyone whose provider reports cached or reasoning tokens differently than described above. Issues and PRs welcome.
From 'Seeing' to 'Self-Healing': Chanjet's Observability and AIOps Practice

776 posts | 60 followers
FollowOpenAnolis - September 8, 2026
Alibaba Cloud Native Community - April 18, 2025
Alibaba Cloud Native Community - June 25, 2026
Alibaba Cloud Native Community - September 4, 2025
Alibaba Cloud Native - August 14, 2024
Alibaba Cloud Community - September 14, 2026
776 posts | 60 followers
Follow Managed Service for Prometheus
Multi-source metrics are aggregated to monitor the status of your business and services in real time.
Learn More CloudMonitor
Automate performance monitoring of all your web resources and applications in real-time
Learn More AgentLoop
An Agent self-evolution platform designed to make your Agents progressively smarter and more attuned to users.
Learn More Bastionhost
A unified, efficient, and secure platform that provides cloud-based O&M, access control, and operation audit.
Learn MoreMore Posts by Alibaba Cloud Native Community

