By Feng Su and Huaixin Chang
Editor's Note: Performance bottlenecks in LLM inference often hide within the interleaved scheduling of Prefill and Decode phases, data synchronization across multiple GPUs, and the dynamic orchestration of Continuous Batching. To truly "see" these issues, request-level observability is indispensable. At the SGLang Technology Exchange MeetUp (themed "MetaX & Anolis: Co-creating in Open Source"; cohosted by MetaX and the OpenAnolis community), Feng Su, an SGLang developer from the OpenAnolis community, and Huaixin Chang, a committee member of the OpenAnolis Intelligent Computing Alliance, delivered a keynote titled "From End-to-End Observability to Intelligent Analysis: The Evolution and Practice of AI Performance Analysis Paradigms." In their speech, the two speakers reviewed the observability construction journey of SGLang Tracing—incubated within the OpenAnolis community and contributed upstream—and discussed how to leverage AI agents for performance optimization in the SGLang framework through specific case studies. The following is the full text of the speech:
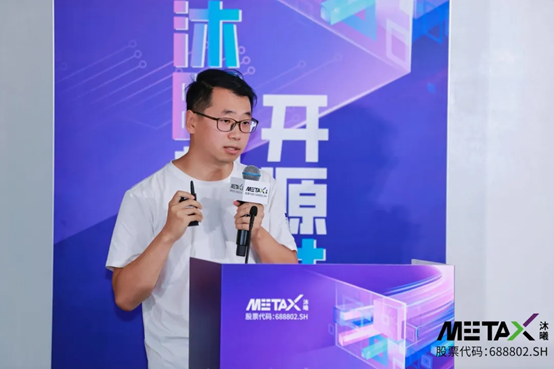
(Image/Feng Su)
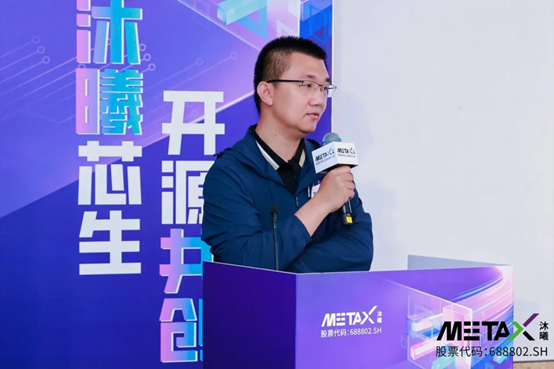
(Image/Huaixin Chang)
Current inference engines face numerous performance challenges during deployment. Whether managing online services, deploying new models, or developing new instances, we frequently encounter scenarios where test metrics are unusually high, requests are aborted or time out, or GPU and CPU resources are not fully utilized yet throughput hits a ceiling. These are typical performance bottlenecks.
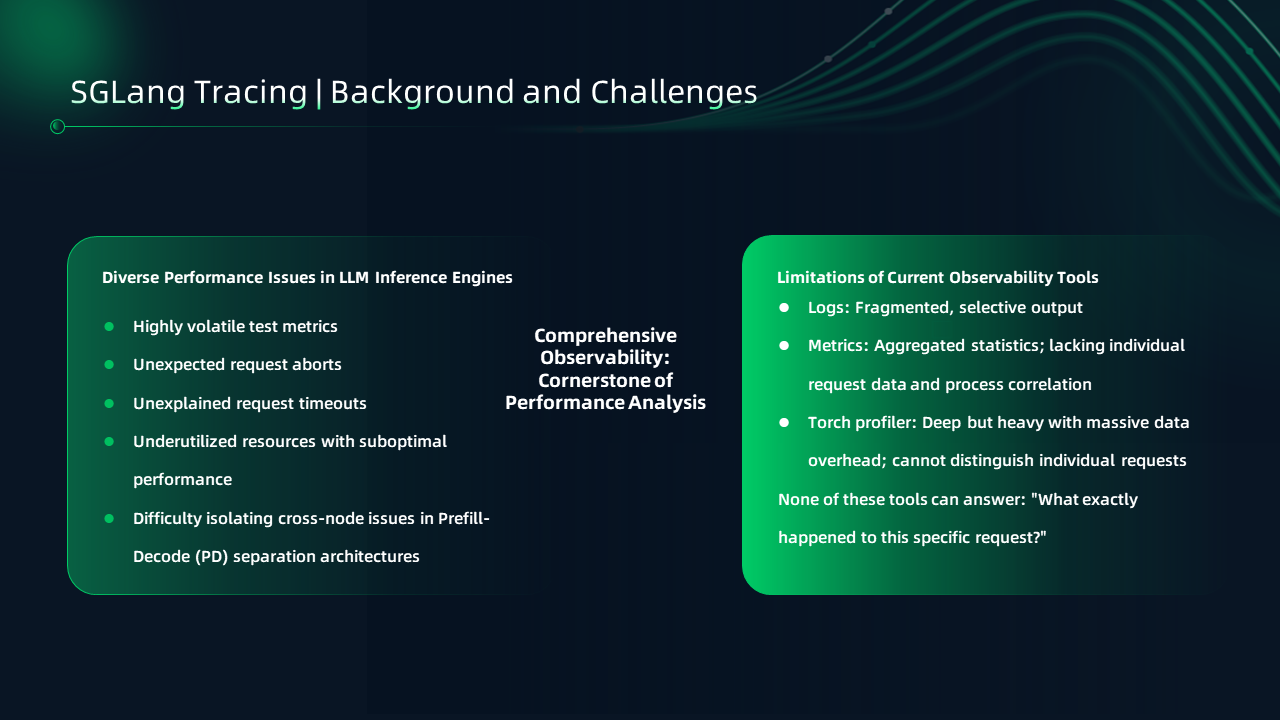
To effectively analyze these issues, comprehensive observability is the cornerstone. Previously, SGLang relied on three primary observation methods:
First, logs. We generally use logs to monitor overall system health, but their output is fragmented. Moreover, not all information is logged, meaning extensive post-processing is usually required to troubleshoot effectively.
Second, metrics. Typically used for online health monitoring, metrics are presented as line charts or histograms representing aggregated statistics. While they offer a solid macro-level view, they lose individual request details, making it impossible to map out the execution lifecycle of a single request.
Third, torch profiler. This is arguably our go-to tool for offline performance analysis, and it is highly effective. However, its biggest drawback is its heavy footprint—just tens of seconds of profiling can generate gigabytes of data, making continuous tracking impossible. Consequently, capturing intermittent issues relies heavily on luck. Another downside is that it does not differentiate between requests; it displays data strictly as function call stacks. Regardless of how many requests are in a batch, it merely shows the result of a single forward pass for that batch.
Yet, what we intuitively want to know most is: Which specific request slowed down? At what stage did the slowdown occur? Our ideal observability system lacks precisely this: request-level tracing capabilities. In mature Internet services, tracing is essentially a mandatory feature.
The essence of tracing is to establish end-to-end correlation. It allows us to clearly observe the execution sequence and actions of various stages within a single request. At the same time, to address the scheduling interruptions caused by the random arrival of requests in LLM scenarios, tracing must extend to inter-request relationships. This means we must not only focus on single-request performance but also dive deep into how requests interact and impact one another.
For SGLang, building such a capability presents three main challenges:
First, multi-request concurrency. Unlike traditional multi-coroutine models used in web services—where OpenTelemetry natively supports automatic tracing context management during coroutine switching—SGLang executes concurrent requests collectively as a batch. Therefore, we must manually manage the tracing context for each individual request.
Second, the continuous batching mechanism. In any given batch cycle, new requests may join, and existing ones may terminate. The tracking points are scattered across the entire codebase, making them inherently difficult to manage.
Third, diverse parallelism strategies. SGLang utilizes various parallel execution modes like Tensor Parallelism (TP), Data Parallelism (DP), Pipeline Parallelism (PP), and Prefill-Decode (PD) separation. We want to observe not just the fine-grained execution of requests, but also exactly how they execute in parallel.
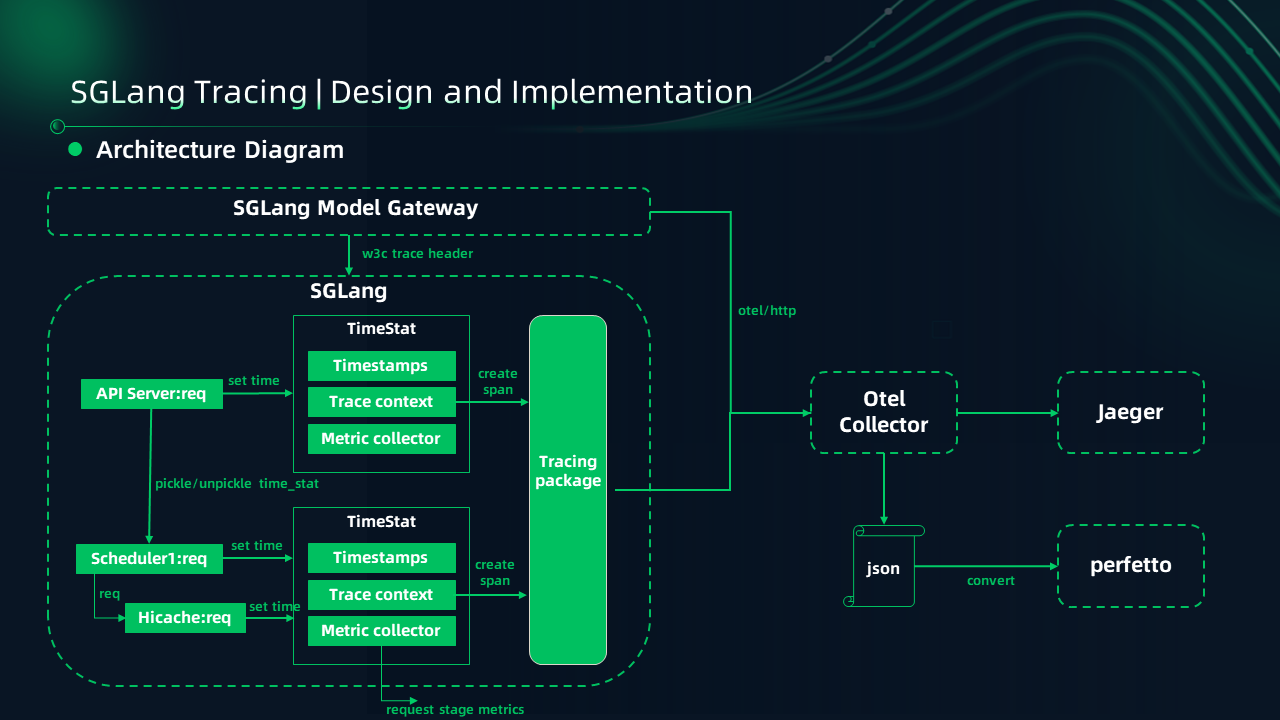
SGLang Tracing is built on the official OpenTelemetry API. By wrapping a tracing package layer for context management, it seamlessly integrates with mature ecosystems. Data can be exported to the OpenTelemetry Collector and routed to frontend visualization tools like Jaeger or Zipkin.
Tailored for LLM inference scenarios, SGLang also provides a file export and offline analysis solution. While it natively supports single-request observation, the data can also be converted into the Perfetto format via offline scripts. This empowers users to view all requests globally in a single dashboard, providing intuitive insights into inter-request dynamics.
The core implementation of SGLang Tracing is centralized in the TimeStats class. The community refactored the timestamp collection mechanism, consolidating all related logic into this single class so that it can centrally support the three major observability pillars: logs, metrics, and traces.
Inside TimeStats, the system is responsible for creating the tracing context. Upon completion of a specific execution stage, it generates a Span by tracing back to the preceding timestamp, and it achieves seamless context transfer from the tokenizer to the scheduler. The beauty of this centralized design lies in its decoupling and low intrusiveness: as long as the macro-execution stages and timestamp types remain unchanged, the tracing module requires no modification regardless of how SGLang's core code is refactored. Furthermore, when the feature is disabled, it has absolutely zero overhead on the main inference pipeline.
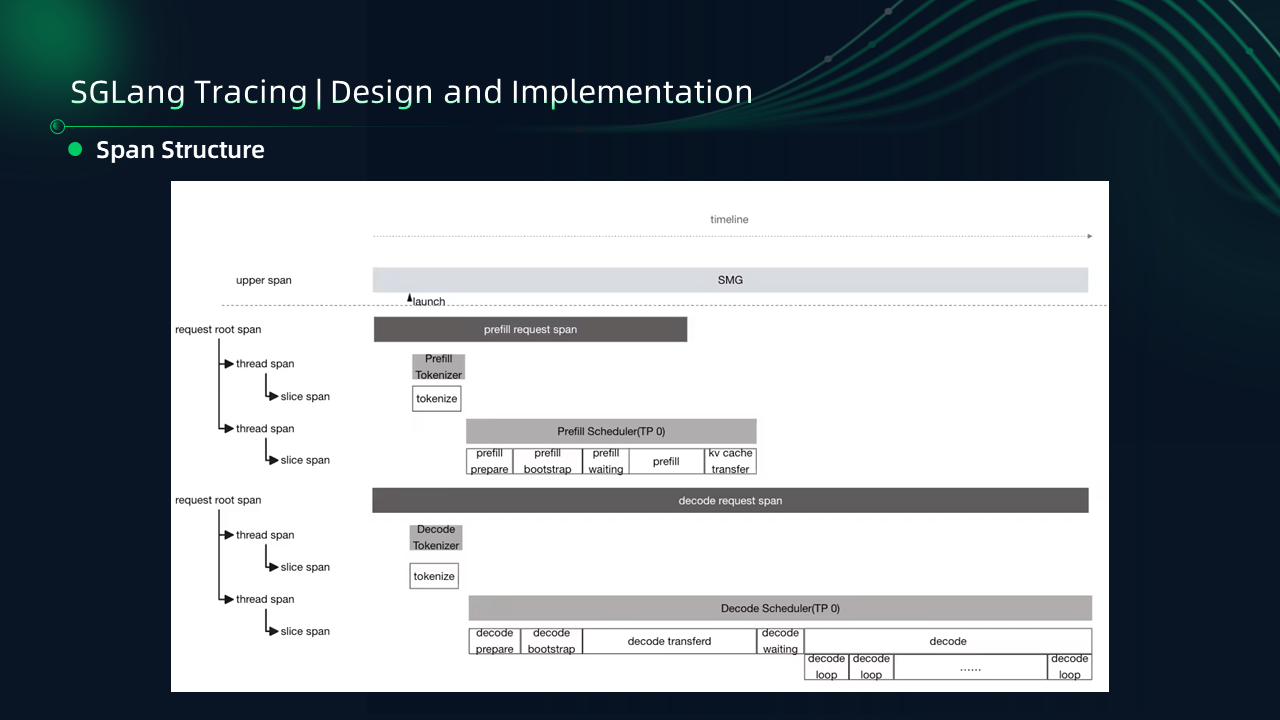
To tackle the aforementioned challenges, we designed a three-tier Span architecture:
• The first tier is the request-level Span, where each request generates a single, overarching Span.
• The second tier is the thread-level Span. A Span is inserted from the moment a request hits a specific thread to the end of its lifecycle within that thread. This tier aggregates the fine-grained execution steps of each request. Through thread Spans, we can visualize how a request is executed across different parallel modes.
• The third tier allows for attaching even more granular details beneath the thread Span, such as the generation process of each individual token. Moreover, tracking granularity can be dynamically adjusted via trace-level controls.
This three-tier Span structure also enables upper-layer systems to propagate the tracing context downward. Consequently, SGLang Tracing can be seamlessly linked with Spans generated by upstream applications (e.g., when Dynamo calls SGLang).
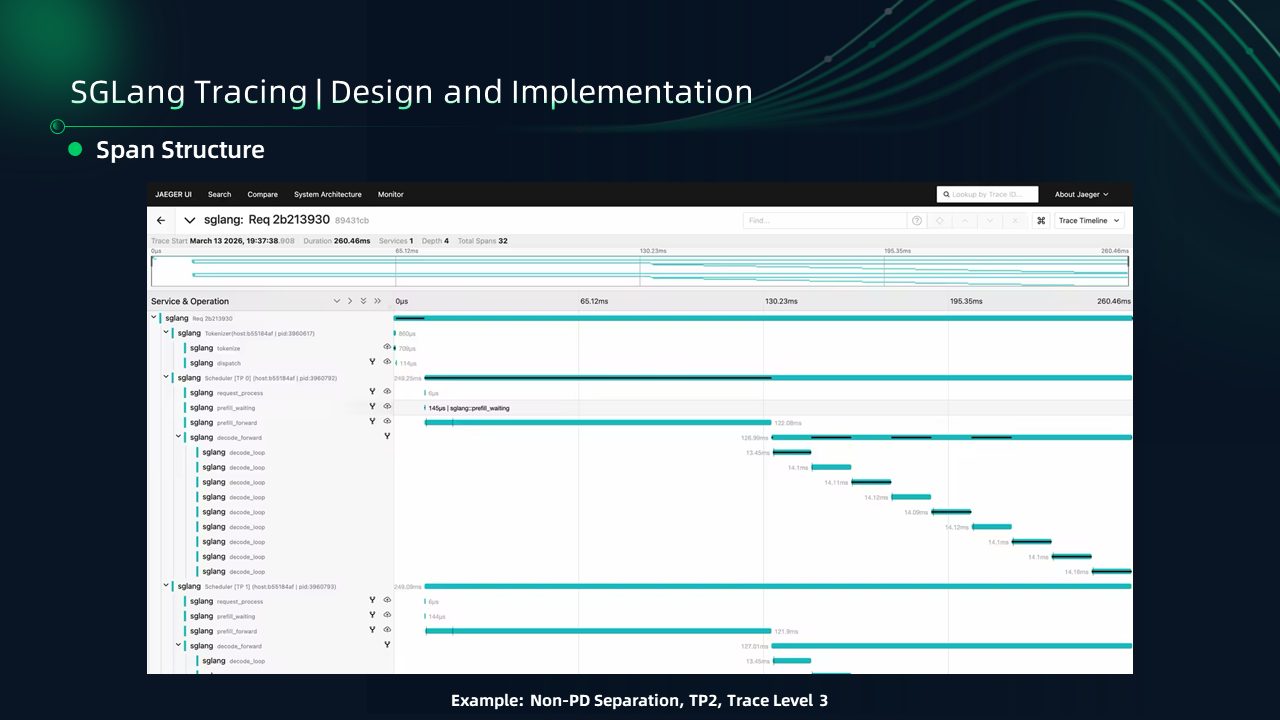
Single-request view: By exporting to Jaeger, users can visualize the complete execution lifecycle of a single request, including the Spans and timing information for each stage.
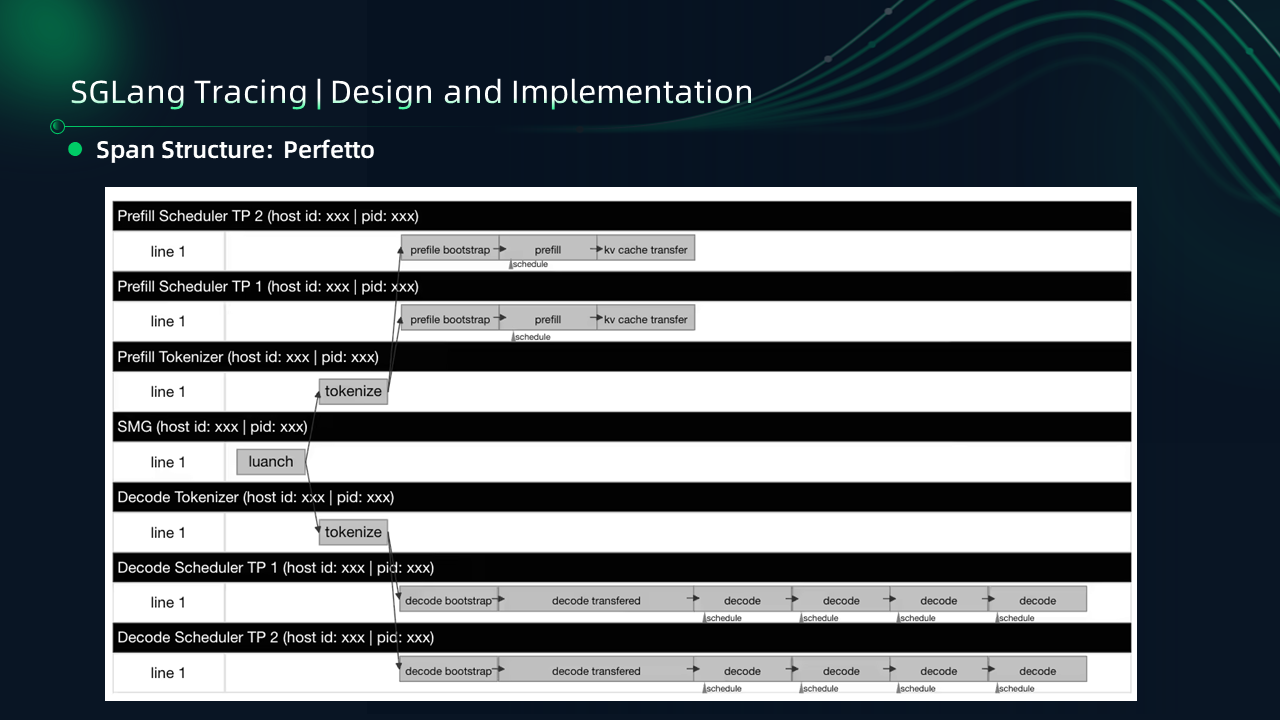
Multi-request view: Using offline scripts to convert data into the Perfetto format, a two-layer structure is presented. The first layer displays the various SGLang threads; underneath each thread, the execution Spans of all requests are arranged chronologically and concatenated via links, unveiling the complete execution flow of all requests.
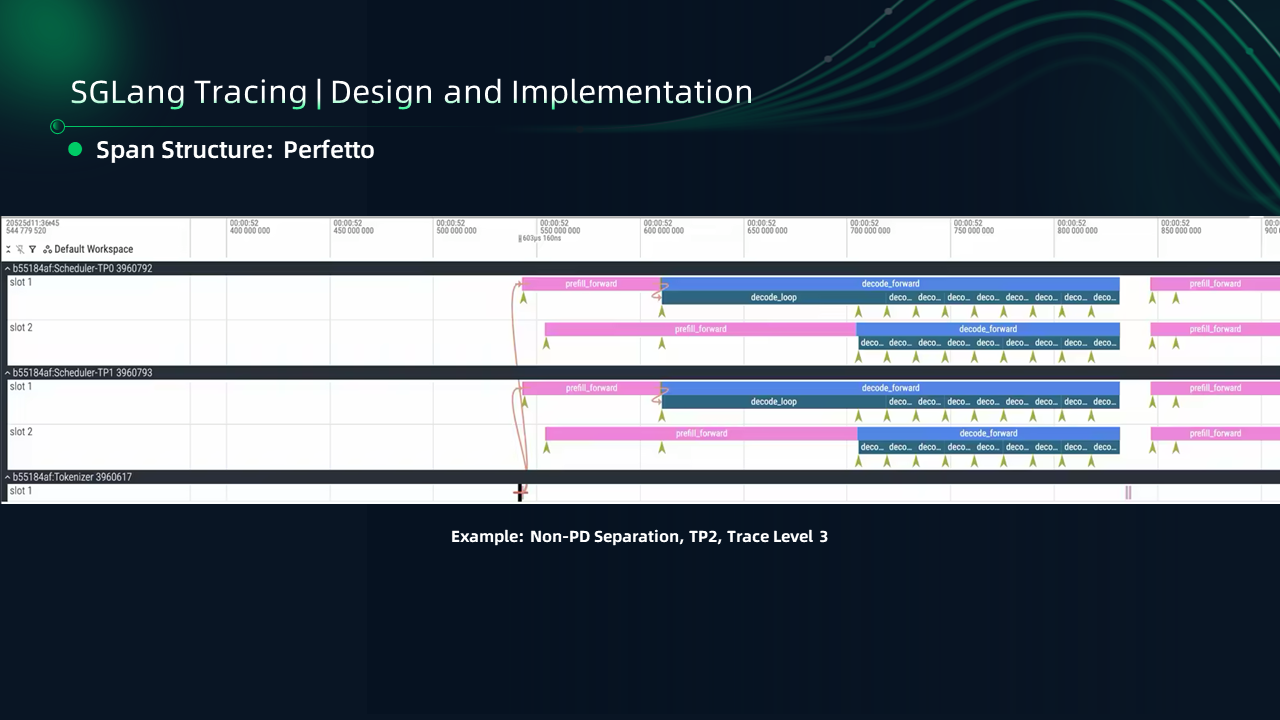
In our practical demonstration, we used a non-PD disaggregation setup deployed via TP, comprising three processes: one tokenizer and two TP ranks. Here, two requests are executing concurrently. Under each thread, we can see two rows, and through a unified timeline, it is clear how the two requests execute together—for instance, the Prefill forward passes are handled separately, while the Decode forward pass is executed together.
With the evolution of AI and the rise of agents, observability has become an indispensable foundation for performance analysis. If we liken observability to agile "hands" responsible for data collection and presentation, then the agent acts as the "brain," driving analysis and decision-making. Building upon this observability foundation, we have conducted a series of performance analysis and optimization practices. Moving forward, these agent-based practice skills are expected to be launched in the OpenAnolis community—stay tuned. Next, we will share our explorations and insights through four specific case studies: three on performance analysis and one on performance optimization.
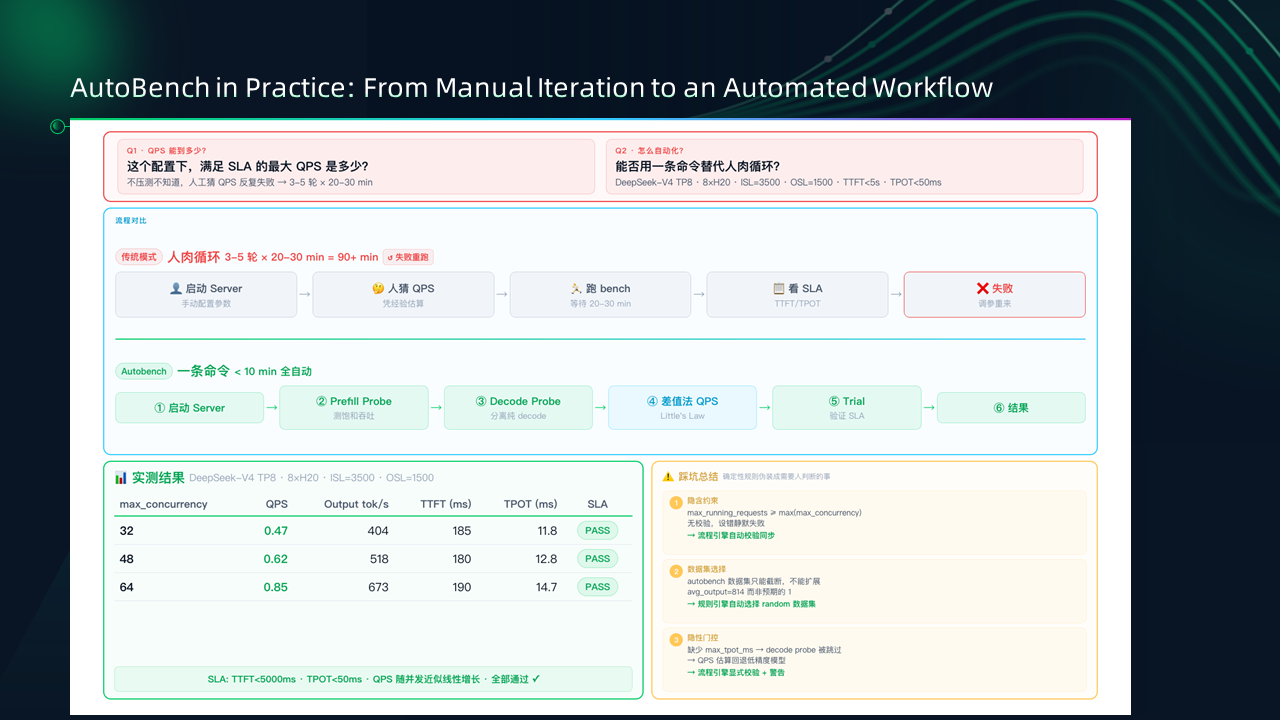
In our daily work, we constantly face a core task: finding the optimal QPS and its corresponding parameters that satisfy SLA constraints under a specific configuration (e.g., deploying DeepSeek V4 on H20 GPUs). Relying entirely on manual effort makes this process extremely time-consuming. Engineers have to repeatedly start and stop services, manually tweak the QPS, and make educated guesses. A single test often takes 20–30 minutes and requires deep, continuous human intervention.
Today, by introducing automation techniques and solidifying testing methodologies, agents can rapidly pinpoint the optimal SLA solution for a given configuration in just over ten minutes. For instance, when running DeepSeek V4 with a TP8 configuration on the H20s, the agent successfully generated the optimal test results automatically.
However, practice has also shown that relying solely on a skill or an agent introduces uncertainty. For example, regarding specific parameters like max_running_requests and QPS, the agent's initial understanding might deviate from the engineer's exact intent. Therefore, the most efficient approach currently is "human-machine collaboration": first aligning understanding through several rounds of interaction, solidifying deterministic logic into scripts, and then letting the agent skill orchestrate the remaining workflow. This approach preserves precise human judgment while fully leveraging the agent's execution efficiency, ultimately leading to better results while saving effort.
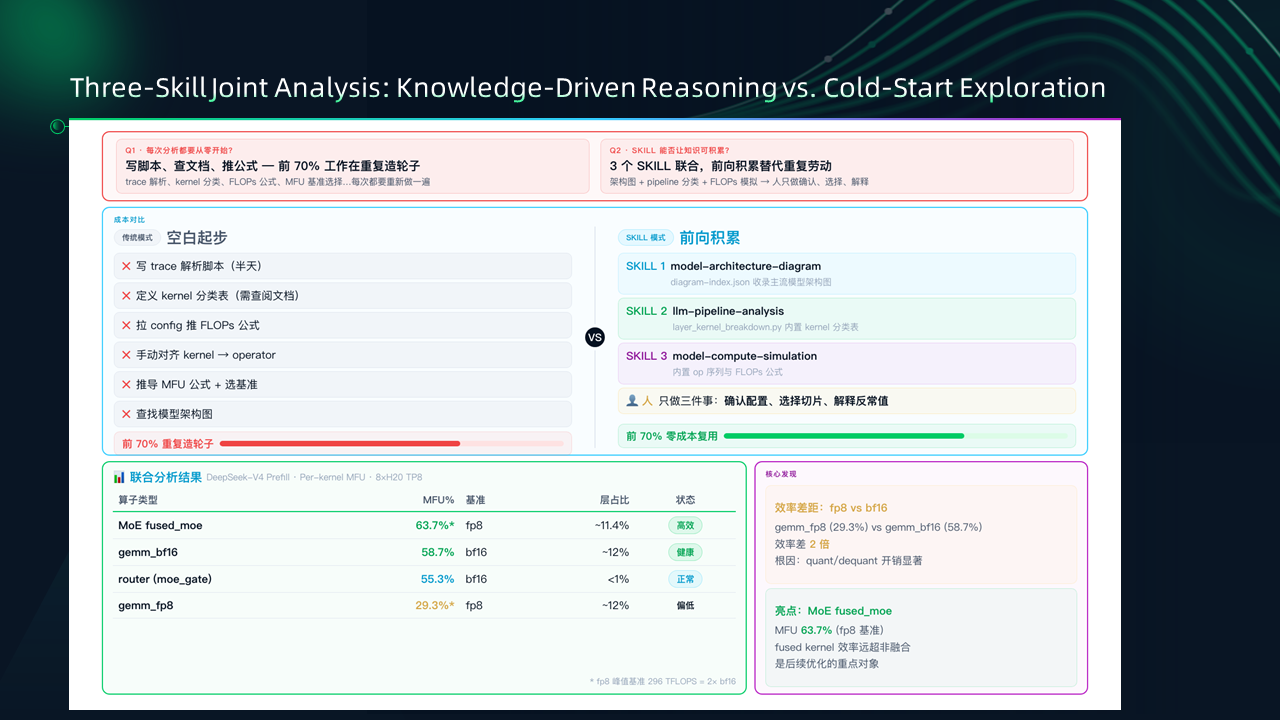
The context for this practice is: during actual test runs, we want to identify current performance bottlenecks and determine whether different operators have achieved optimal Model FLOPs Utilization (MFU) and resource utilization.
Before applying these skills, this process was highly manual. Engineers had to sift through massive amounts of data and perform complex analysis based on model architecture. The workflow was not only tedious but also made it difficult to accumulate and reuse experience. Leveraging AI agents, we streamlined this task by orchestrating the following three skills:
1. Model architecture skill: Primarily displays structural details of specific models, with data sourced from upstream open-source projects.
2. Pipeline analyzer skill: Conducts step-by-step analysis from torch profiler data—selecting appropriate profiler batches and profiler layers, and conducting targeted analysis on the operators within a layer.
3. Model compute simulation skill: Analyzes the data flow within a layer. Combining data flow with foundational knowledge, this skill calculates the actual output tensor type of each operator and provides an estimated MFU.
When these three skills are combined, the output is multi-dimensional: it details model architecture, batch and layer execution results from the torch profiler trace, and specific operator information. In the analyzed case for the fused MoE operator, we can clearly see the MFU execution status of key operators, and the LLM can even provide its own insights and judgments.
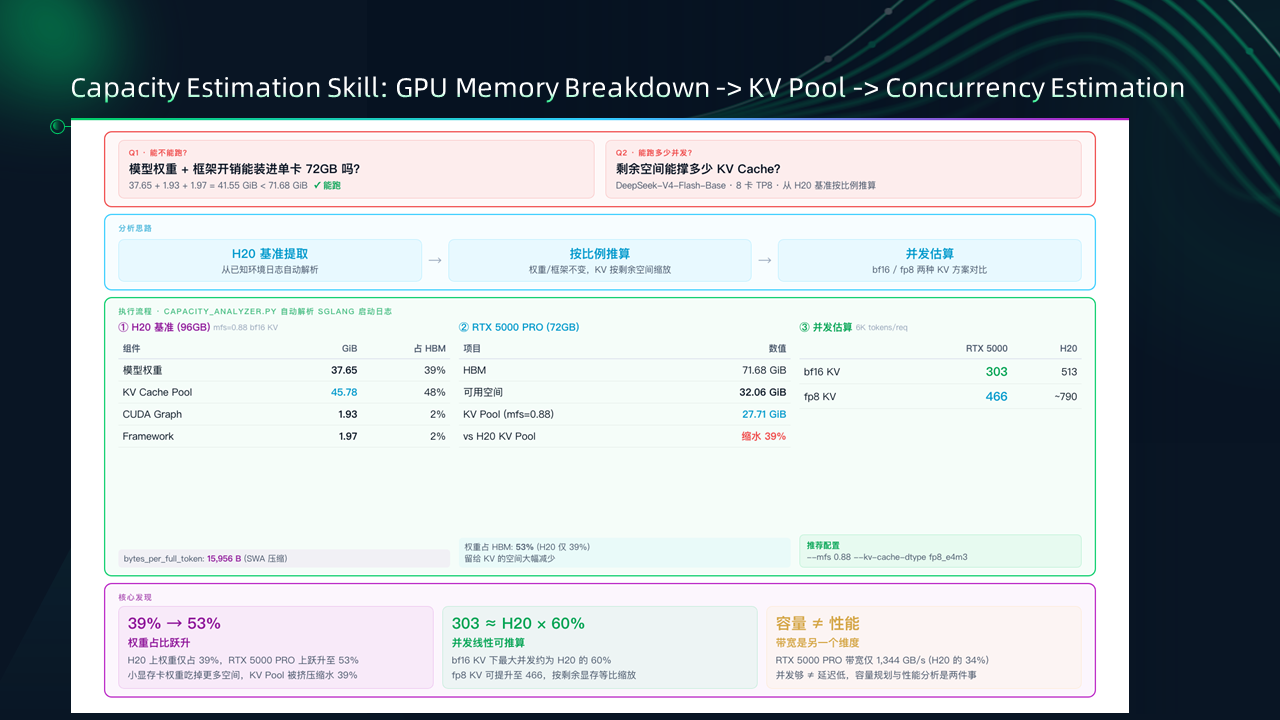
We are frequently asked: Can a new model run on a specific hardware platform (like H20s)? And if it runs, is there sufficient GPU memory?
GPU memory consumption during the Prefill phase is generally less of a concern. The real bottleneck lies in the Decode phase, which requires a relatively high batch size to drive up the MFU of core operators. At this point, GPU memory may hit its limit. Therefore, the core question is: For a specific output pattern, how high of a concurrency level can be achieved? Can a satisfactory MFU be reached?
The capacity estimation skill is designed for these preliminary assessments. It uses a combination of static and dynamic data, alongside extracted edge-case limits. It categorizes GPU memory usage into key segments: model weights, KV Cache footprint, and the framework's primary dynamic memory at runtime. With this breakdown, combined with the GPU memory footprint per token or per request in a given scenario, it estimates the potential request concurrency for specific configurations. Experience shows that hitting a concurrency of 200 or more on H20s or similar GPUs usually yields excellent utilization.
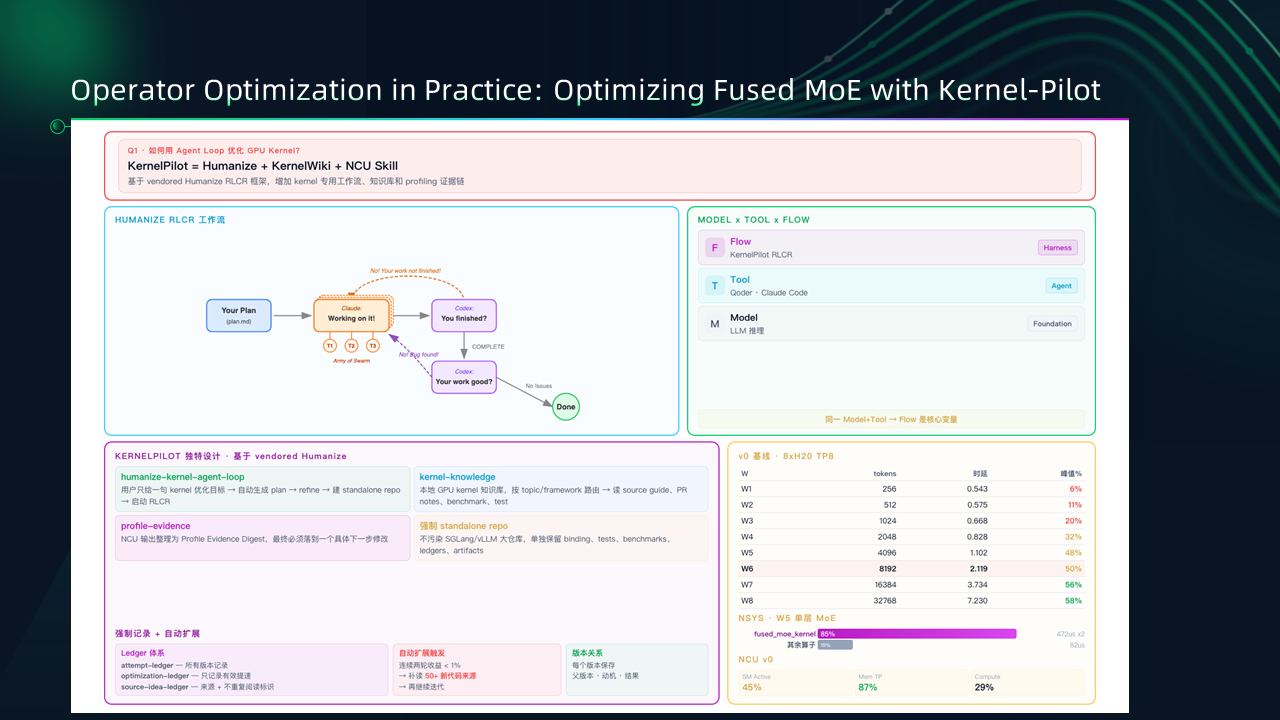
Beyond performance analysis, we have also practiced operator optimization and tuning using the open-source project Kernel-Pilot. Unlike the aforementioned performance analysis agents, Kernel-Pilot stands out with its meticulously designed triple architecture:
1. Humanizer: An agent flow-based architecture. The core philosophy here is that for long-running or complex tasks, a simple, single-pass flow rarely delivers top-tier results. Therefore, an agent loop or multi-agent architecture is employed to let the task run automatically over an extended period, yielding much better optimization. The architecture utilizes three agents: a model optimization agent (powered by Claude), a code review agent, and a status evaluation agent (the latter two powered by Codex).
2. Kernel knowledge: Incorporates kernel optimization insights extracted from historical web sources and other data.
3. NCU skill: Features the capability to conduct deep analysis using NVIDIA Nsight Compute (NCU).
Furthermore, this practice strongly emphasizes the concept of a "workload set," meaning workloads must be clearly defined prior to optimization. Taking the fused MoE kernel as an example, we attempted tuning across different input sequence lengths.
The results were remarkable: after about three rounds of iteration, the system delivered the final optimization. Had we used a simple, single flow, the process might have output a result in the first round and stopped. Thanks to the intervention of code review and other Codex agents, the workflow iteratively drilled down for two more rounds, leveraging NCU analysis data to discover new optimization points. Ultimately, by tweaking MoE-related configurations, performance improved by an average of 20% across various workloads.
Looking at our current progress and future roadmap, foundational tracing capabilities for scenarios like TP, DP, PP, and PD separation have been successfully merged. We recently completed architectural support for SD/EPD separation, alongside Mooncake backend tracing functionality for PD separation scenarios. Ongoing work includes deepening data transfer tracking for the KV Cache across L1-L3 tiers, advancing the PR review for the eagle V2 release, and optimizing the performance overhead introduced by asynchronous OpenTelemetry exports under large batch sizes to prevent disruption to the main pipeline's time window. Moving forward, we plan to tackle incomplete component coverage, coarse Span attribute granularity, and arbitrary trace level settings. We aim to systematically refactor the trace configuration and develop a native backend feature to directly export to the Perfetto format. This will replace the current offline script conversion method, further elevating both the usability and performance of our observability framework.
A Comprehensive Performance Analysis of Alibaba Cloud Linux 4

117 posts | 6 followers
FollowAlibaba Cloud Native Community - August 30, 2022
OpenAnolis - November 19, 2024
OpenAnolis - August 3, 2022
ApsaraDB - May 22, 2026
Alibaba Cloud Community - June 25, 2026
ApsaraDB - December 29, 2025
117 posts | 6 followers
Follow Best Practices
Follow our step-by-step best practices guides to build your own business case.
Learn More Elastic High Performance Computing
A HPCaaS cloud platform providing an all-in-one high-performance public computing service
Learn More Remote Rendering Solution
Connect your on-premises render farm to the cloud with Alibaba Cloud Elastic High Performance Computing (E-HPC) power and continue business success in a post-pandemic world
Learn More Elastic High Performance Computing Solution
High Performance Computing (HPC) and AI technology helps scientific research institutions to perform viral gene sequencing, conduct new drug research and development, and shorten the research and development cycle.
Learn MoreMore Posts by OpenAnolis

