By Zhang Zuowei (Youyi)
Kubernetes provides abstract capabilities for resources (such as CPU and memory). Users can declare resource specifications of containers based on the actual requirements. This method improves the efficiency of cluster resource management. However, knowing how to set the resource specifications of containers has always been a key problem for application administrators. High resource specifications will lead to a large amount of resource waste, while low specifications will bring potential stability risks to applications.
Alibaba Cloud Container Service for Kubernetes (ACK) provides the resource profiling capability for Kubernetes-native workloads. This allows the resource specification recommendations at the granularity of the container, simplifying the complexity of configuring requests and limits for pods.
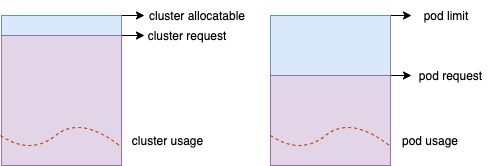
Kubernetes provides a resource semantic description of a request for container resource management. When a request is specified by the container, the scheduler matches it with the capacity of nodes to determine which node it should be assigned to. The request is specified based on experience. Application administrators will adjust the request based on the online performance of the container, the historical resource utilization, and stress test results.
However, this human experience-based pattern of resource specification configuration has the following limits:

The resource profile data of an application can provide help for administrators. The so-called resource profile refers to the characteristics of application resource consumption, including common physical cluster resources (such as CPU and memory) and relatively abstract resources (such as network bandwidth and disk IO). In daily resource management for containers, O&M personnel pay the most attention to CPU and memory. If we can collect the historical data on resource consumption and perform a summary analysis, the administrator can set specifications for the container flexibly.
In addition to the resource specification, the resource profile of the application contains the characteristics of the time dimension. The traffic of Internet services will be affected by people's activities, showing clear peaks, valleys, periodicity, and predictability. For example, there will be midday and evening peaks in local life applications, clock-in and clock-out peaks in office applications, and peaks in e-commerce applications during the promotion period, which are expected to be several times as high as the traffic valleys. If the scheduling system can capture this information and flexibly allocate resources according to the cluster and application status, the traffic peak cutting and traffic valley filling in resource allocation can be implemented.
In summary, a stable resource profiling system can improve the management efficiency of O&M personnel, ensure the stable operation of applications, and improve the utilization of cluster resources.
The profile results of container resource specifications can be used in various scenarios (including instructing application administrators to set the Request/Limit configurations of containers), providing data reference for resource scheduling and rescheduling algorithm optimization and instructing peripheral elastic components (such as VPA) to dynamically perform scaling on applications. These scenarios have general requirements for the algorithm model:
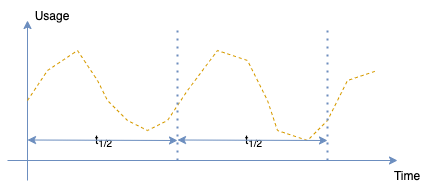
The requirements above can be met by a typical sliding window model. On this basis, to make the profile results smoother, the weight factor can be attenuated based on the timeliness of the data to ensure that the new data has a greater impact on the algorithm and the old data has a smaller impact on the algorithm results. The half-life sliding window is a typical algorithm model:

τ is the time point of the data sample and t1/2 is the half-life, indicating that for every t1/2 time interval, the weight of the data sample in the previous t1/2 time window is reduced by half.

Resource profiling depends on the usage data of container resources. The granularity of these data is usually in a minute or even a second level. The data model based on the half-life sliding window requires a large amount of historical data accumulation. If all the data is saved for the regular iterative analysis, the cost of storage and computing would be too high, and serious performance problems will occur during the cold start phase.
We have a variety of available statistical tools for the data model of the profile. In terms of historical data storage, we can use statistical histograms to achieve the effect of data compression. As shown in the following figure, we define the horizontal axis as the number of resources, and the vertical axis as the counts on the corresponding sampling points, with each statistical interval increasing by about 5%. As such, container historical data for each workload only needs around 200 counts to be completely saved. At the same time, this method is convenient for regular storage, which can improve the performance of the cold start phase.

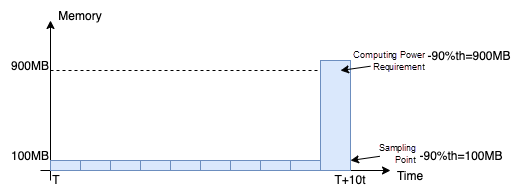
There are various computing methods for profiling specification recommendations, such as peak sampling, weighted average, and quantile. Practical experience shows that the quantile algorithm can be applied to various scenarios, and the resource specifications for different types of workloads can be accurately described based on the quantile algorithm. It should be noted that the quantile algorithm here is not for simple statistics of sampling points but for the quantile of computing power requirements for workloads. The difference between the two is shown in the following figure. The memory usage of nine sampling points is low, only 100MB, while the memory usage of the tenth sampling point is high, reaching more than 900MB. If the 90% quantile obtained by the time sampling point is only 100MB, it is impossible to describe the resource requirements of the application accurately, while the 90% quantile obtained by computing power requirements is 900MB, which is more accurate. In addition, the profiling algorithm takes a variety of other factors into account, such as the half-life, the confidence coefficient of sample data, and the OOM of containers mentioned above.

We deployed a test application with deployment types to an ACK cluster, enabled the resource profile of the application, and summarized the container specifications (request), the actual resource usage, and the resource profile result (recommend) to the Prometheus monitoring page. As shown in the following figure:

The blue polyline indicates the actual CPU usage of the application, the orange polyline indicates the resource profile result, and the green polyline indicates the original request specification. The administrator can shrink the request specifications by referring to the profile results of the container, which can effectively reduce the consumption of cluster resources.
We are planning relevant product capabilities around resource profiling. Stay tuned!
Koordinator Community:
https://github.com/koordinator-sh/koordinator
Joining Slack Channel:
https://koordinatorgroup.slack.com/archives/C0392BCPFNK
A Study on the Deployment of Istio Microservice Application Based on ASK
A Summary of the Five Conditions and Six Lessons of Auto Scaling

212 posts | 13 followers
FollowAlibaba Cloud Native - September 12, 2024
Alibaba Container Service - July 25, 2025
Alibaba Cloud Native - July 29, 2024
Alibaba Cloud Native Community - August 25, 2025
Alibaba Container Service - November 15, 2024
Aliware - March 19, 2021

212 posts | 13 followers
Follow Container Compute Service (ACS)
A cloud computing service that provides container compute resources that comply with the container specifications of Kubernetes
Learn More Container Service for Kubernetes
Alibaba Cloud Container Service for Kubernetes is a fully managed cloud container management service that supports native Kubernetes and integrates with other Alibaba Cloud products.
Learn More ACK One
Provides a control plane to allow users to manage Kubernetes clusters that run based on different infrastructure resources
Learn More Resource Management
Organize and manage your resources in a hierarchical manner by using resource directories, folders, accounts, and resource groups.
Learn MoreMore Posts by Alibaba Cloud Native