By Yuange
This article consists of four parts: the overview of Cassandra, the interpretation of common key metrics, the interpretation of common alert rules, and how to use Prometheus to establish a monitoring system.
What is Cassandra?
Apache Cassandra is an open-source, distributed, decentralized, elastically scalable, highly available, fault-tolerant, tunably consistent, and row-oriented database. Its distribution design is based on Amazon's Dynamo, and its data model is based on Google's BigTable. Cassandra was created by Facebook and is currently widely used by major IT enterprises.
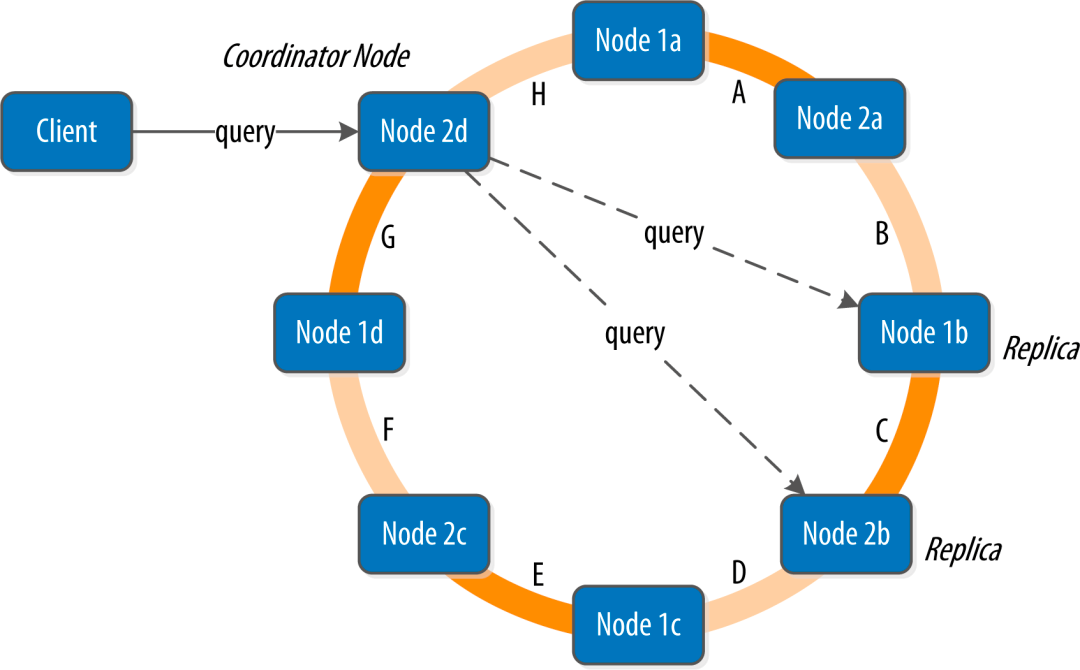
• Large-scale scalable storage
Cassandra can be scaled out to hundreds of terabytes and delivers outstanding performance on commercial clusters.
• Easy to manage
Cassandra clusters are easy to manage at scale and can dynamically scale out as per changing needs.
• High availability
Cassandra is designed to be "always on" and has a proven track record of being used in production environments for over a decade. It supports features like zero-downtime upgrades.
• Write-intensive applications
Cassandra is well-suited for time-series data in write-intensive applications such as time series streaming data, sensor log data, and Internet of Things (IoT) applications.
• Statistics and analysis
Cassandra can be integrated with big data computing frameworks like Spark. This allows users to leverage Spark's powerful in-memory analytics capabilities for statistics and analysis on large-scale data.
• Active geo-redundancy
Cassandra supports multiple data centers in different locations, enabling data replication and backup across multiple clouds and data centers.
Cassandra is a highly flexible distributed NoSQL database system that can be applied to various scenarios. Here are detailed descriptions of the usage scenarios for Cassandra:
1. Large data volume and high write frequency.
One of Cassandra's design goals is to handle large-scale data sets and scenarios with high write frequency, such as social media, Internet of Things (IoT), and real-time data analysis. Cassandra easily scales horizontally, allowing it to handle workloads with billions of rows of data and support fast write and read operations.
2. High availability and fault tolerance.
Cassandra is suitable for scenarios that require high availability and fault tolerance, thanks to features like automatic partitioning, replication, and failover. Examples of such scenarios include financial transactions and online games. Cassandra's distributed architecture ensures the system can continue operating and maintaining consistency even in the event of node failure.
3. Data replication and synchronization across data centers and geographic locations.
With support for multi-data center replication, Cassandra facilitates easy data synchronization and backup between different data centers. This makes Cassandra an ideal choice for scenarios that necessitate global expansion, such as online advertising and e-commerce.
4. Support for distributed transactions.
Cassandra ensures data consistency by supporting lightweight transactions that can span multiple nodes and data centers. These transactions can be executed with high throughput and low latency, making Cassandra suitable for scenarios that require distributed transactions, such as financial transactions.
5. Flexible data model to support multiple query methods.
Cassandra's flexible data model and support for multiple query methods make it suitable for scenarios that require storing and querying flexible data models. It is particularly useful for storing time series data and tracking order statuses. Additionally, Cassandra supports various data structures, including sets, maps, and lists, making it ideal for storing semi-structured and unstructured data.
While Cassandra is applicable to many scenarios, there are situations where it may not be suitable for use. The following are some scenarios where Cassandra may not be the best fit:
In summary, Cassandra is suitable for scenarios with large-scale data sets and high write frequency. However, it may not be the best choice for small-scale data sets and scenarios requiring complex queries and analysis. When selecting a database, it is essential to consider specific application requirements comprehensively.
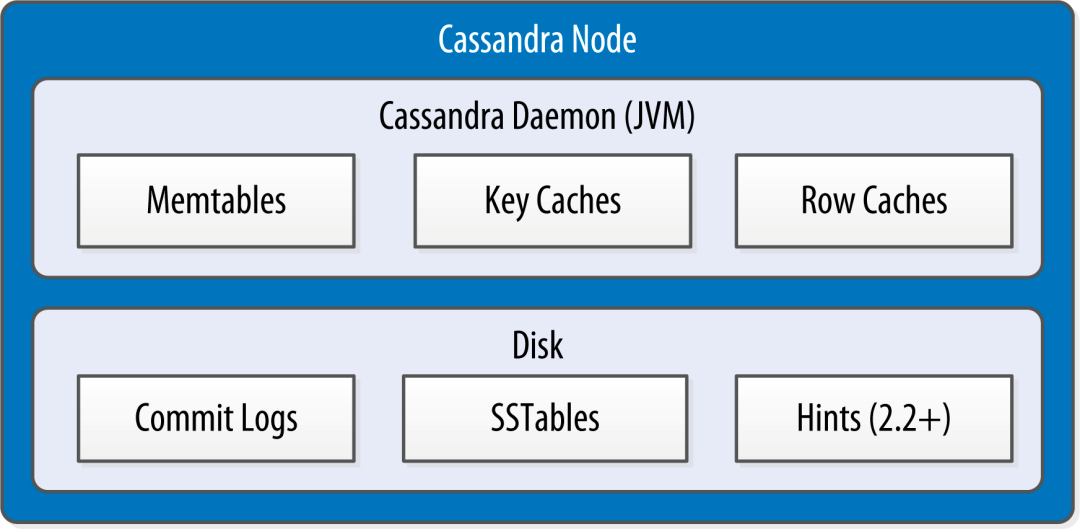
1. Cassandra Node
A Cassandra node is an instance in a Cassandra cluster, which is responsible for storing a part of data, processing read and write requests, and communicating with other nodes. Cassandra nodes communicate with each other through the Gossip protocol to maintain node status and topology.
2. Memtable (Memory Table)
Similar to SkipList, Memtable is a memory structure used to improve write performance. Memtable is a temporary data structure used by Cassandra during the write process to hold data to be written to the disk. When the Memtable is full, Cassandra will write the data in it to disk and continue to write new data in memory.
3. Key Caches
The key cache is a cache used by Cassandra to read data to accelerate read operations. The key cache is stored in the memory of each node and caches recently used data items for fast lookup and access to data. Cassandra uses hash tables to store key/value data and manages data items in the key cache based on the LRU (Least Recently Used) algorithm. When the key cache is full, Cassandra removes the least recently used data items from the key cache to release space.
4. Row Caches
The row cache is an in-memory cache used to store row-level data in Cassandra. The Row cache is a cache used by Cassandra to read data to accelerate read operations. The row cache is stored in the memory of each node and caches recently used row-level data for fast lookup and access to data. Unlike the key cache and Memtable, the row cache caches complete row-level data instead of key/value data in it.
5. Commit Logs
The Commit Logs mechanism is actually one of the ways to implement the WAL (Write Ahead Log) mechanism in Cassandra to ensure data persistence and consistency when you write data. When Cassandra receives a write request, it first writes the data to the Memtable in memory and appends the data to the Commit Logs. This ensures that data can be restored from the Commit Logs to the last committed state in the event of a system failure.
6. SSTable (Sorted String Table)
SSTable is the physical format of stored data in Cassandra. Each SSTable is a sorted string table containing data from multiple data partitions which is sorted based on partition keys and column names. Cassandra uses multiple SSTables to store data and uses Bloom filters and indexes to quickly locate data.
7. Hints
Hint is a mechanism used in Cassandra to ensure data consistency and reliability when a node fails. When a node fails to respond to write requests, Cassandra will save these requests in Hints and retries to process these requests after the node recovers. The Hint mechanism can improve the reliability of the system, but may degrade the performance.
8.Tombstone
In Cassandra, the delete operation is actually a "write" operation, and Cassandra marks the data to be deleted as Tombstone. Tombstone is a special data type that contains information about the data to be deleted (such as table name, key name, timestamp, etc.) and occupies a certain amount of space on the disk. When reading data, Cassandra will check for Tombstone. If the data is marked as Tombstone, it is considered deleted and will not be returned to the client.
9. Bloom filter
In Cassandra, a Bloom filter is mainly used to query whether the data in Memtable and SSTable exists or not. It is a mechanism used in Cassandra to quickly query whether the data exists and is used to accelerate the search of data during read operations. When Cassandra needs to query data, it first searches for the Bloom filter. If the data does not exist in the Bloom filter, you can skip the read operation because the data must not exist in the Memtable and SSTable. If the data may exist in the SSTable, continue to read the data in the SSTable for verification.
In this example, the Cassandra component of Alibaba Cloud is used to introduce the key metrics that are commonly used to monitor the Cassandra service.
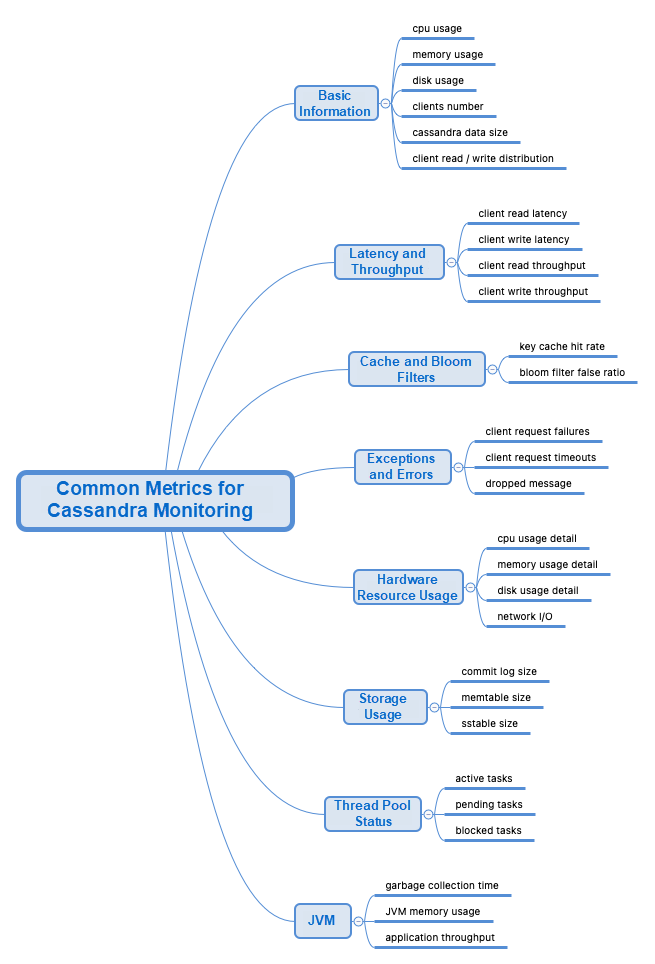
1. CPU/memory/hard disk usage
As a distributed database with high throughput and low latency, Cassandra needs to make full use of the hardware resources of nodes to provide high-performance data storage and query services. If the resource usage of nodes exceeds expectations or reaches the limit, performance degradation or system breakdown may occur, affecting the normal operation of the business. Therefore, we first need to pay attention to the real-time CPU, memory, and hard disk usage of the node to ensure the stability of the Cassandra service.
2. Client connections
The number of clients connected to the current Cassandra server is also one of the metrics to be monitored. The client connections indicate the number of clients that are communicating with the Cassandra cluster. If the number of client connections is too high, the cluster resources may be insufficient, which affects the performance and availability of the system. Especially in the case of high concurrency, it is particularly important to monitor and optimize the client connections. If the number of connections is too high, you can optimize the node configuration and increase the number of nodes to relieve the pressure, so as to ensure the high availability and high performance of the system.
3. Cassandra data volume
Cassandra is a database, so its data volume is also one of the monitoring data that requires close attention. Cassandra allows you to store and query large amounts of data. Therefore, in actual use, its data volume will continue to grow. If the data volume is too large, problems such as insufficient node resources and poor query performance may occur, affecting the normal operations of your business. Therefore, monitoring and optimizing the data volume of Cassandra clusters can help us better manage and maintain Cassandra clusters. You can monitor data volume by monitoring metrics such as disk usage and data distribution in distributed storage. If the data volume is too large, you can take measures such as increasing the number of nodes, upgrading the hardware configuration, and migrating data to relieve the pressure, thereby improving the availability and performance of the system.
4. Client read/write distribution ratio
Finally, one metric that we recommend monitoring is the read/write distribution ratio of clients. Cassandra is a distributed database that supports high throughput and low latency. It is usually used to store a large amount of read and write data. If the read/write distribution ratio is not balanced, the clusters may have a bottleneck, which affects the performance and availability of the system. By monitoring the read/write distribution ratio of clients, we can find problems in time and take measures to optimize the read and write performance of the clusters. For example, you can increase the number of nodes, adjust the partitioning policy, and optimize the query statement.
Cassandra is a database service, so its read/write latency and throughput are metrics that we must pay attention to. Cassandra is famous for its high throughput and low latency. Therefore, in actual use, read/write latency and throughput are important metrics to measure the performance of Cassandra clusters.
1. Read/write latency
The read/write latency is an important metric of the performance of a Cassandra cluster. If the read/write latency is high, it may lead to long system response time, slow data synchronization between nodes that affects data consistency, high load on nodes, and bottlenecks in the system. Therefore, maintaining a reasonable level of read/write latency is one of the important factors to ensure the high availability and performance of Cassandra clusters. If the read/write latency is high, O&M personnel can pay attention to other monitoring data to troubleshoot the problem. The increase in read/write latency may be caused by various factors, such as cache, bloom filter, and hard disk usage. Therefore, for different problems, different troubleshooting and optimization measures can be taken to improve the performance and availability of the clusters.
2. Throughput
The read/write throughput is a metric that indicates the number of read and write requests that are processed by a Cassandra cluster per second. If the throughput is too high, the node is overloaded, which may affect the stability and availability of the system. The high load may cause bottlenecks on nodes, which may affect the response time and availability of the system. Therefore, if the throughput is too high, O&M personnel need to be vigilant and take effective measures to relieve the load pressure, such as increasing the number of nodes and modifying the routing policy.
If the performance of the clusters is high, you can raise the monitoring threshold of the throughput to reflect the actual performance of the clusters. This can better reflect the performance and availability of Cassandra clusters, thereby better supporting business requirements. However, it should be noted that the threshold of throughput should not be too optimistic, and multiple factors such as the hardware performance, business requirements, and system characteristics of the clusters need to be comprehensively considered to ensure the high availability and performance of the clusters.
Cache and Bloom filters can directly and significantly affect the performance of a Cassandra database. Cache can improve the performance and efficiency of queries and reduce the number of disk reads, thereby improving the response speed and throughput of the system. If the cache hit ratio is high, you can significantly improve the performance and availability of Cassandra clusters. Bloom filters can reduce the query load of the database and improve the throughput and performance of the clusters by reducing unnecessary query requests. If the false positive rate of the Bloom filter is low, the number of query operations can be reduced to improve the performance and availability of the clusters.
We recommend that you monitor the key cache hit rate and the false positive rate of the Bloom filter in the Cassandra service.
1. Key cache hit rate
The key cache is a cache mechanism of Cassandra, which is used to store the most commonly used data blocks and index data. When an application requests data, Cassandra first searches for the key cache. If the data block or index data already exists in the key cache, it can directly return the result, avoiding access to the disk. Therefore, the key cache hit rate directly reflects the performance and efficiency of Cassandra clusters. If the key cache hit ratio is low, the response time of Cassandra clusters may be longer, which affects the performance and availability of the system.
2. Bloom filter false positive rate
A Bloom filter is a data structure in Cassandra that is used to quickly query whether data exists. Although the Bloom filter can quickly determine whether data exists, misjudgments may occur. The false positive rate of the Bloom filter reflects the accuracy and efficiency of the data queried by Cassandra clusters. If the false positive rate of the Bloom filter is high, the query efficiency of Cassandra clusters may decrease, which affects the performance and availability of Cassandra clusters.
Exceptions and errors are core metrics that need to be monitored in the Cassandra service. They reflect system problems, such as node downtime, data loss, and network faults. When the exception and error metrics are not 0, it usually means that the system has problems and needs to be troubleshot and solved in time. For example, if a node goes down, you may need to restart or replace the node to restore the cluster to normal operation. If data is lost, data recovery measures may be required to ensure data integrity and reliability.
In some cases, exceptions and error metrics may be misreported or misjudged. For example, some exceptions and errors may be temporary and can be automatically recovered without manual intervention. Therefore, when analyzing exceptions and error metrics, you also need to combine other metrics, such as read/write latency, throughput, CPU usage, and memory usage, to determine and troubleshoot problems.
We recommend that you monitor the three metrics: exception request, error request, and dropped message.
1. Exception request:
An exception request refers to a situation in which exceptions occur when a Cassandra cluster processes read and write requests, such as request timeout and request rejection. The occurrence of exception requests usually means that problems occur in Cassandra clusters, and you need to troubleshoot and solve them in a timely manner. Therefore, the exception request is one of the key metrics to ensure the high availability and performance of Cassandra clusters.
2. Error request:
An error request refers to a situation in which errors occur when a Cassandra cluster processes read or write requests, such as the requested data does not exist or data type mismatches. The occurrence of error requests may affect the query efficiency and accuracy of Cassandra clusters, affecting the performance and availability of the system. Therefore, the error request is also one of the important metrics for Cassandra cluster monitoring.
3. Dropped message:
A dropped message refers to a situation in which messages are lost during communication between nodes in Cassandra clusters. The occurrence of dropped messages usually means that communication between Cassandra clusters is abnormal, which may affect the availability and performance of the cluster. Therefore, the dropped message is also one of the important metrics for Cassandra cluster monitoring.
In Cassandra monitoring, the CPU, memory, hard disk, and network usage are important monitoring metrics. In this module, we can drill down into the monitoring data of these metrics to better understand the performance and availability of Cassandra clusters.
1. CPU usage:
The CPU is the computing resource of Cassandra clusters. The CPU usage reflects the computing load of the clusters. High CPU usage may cause slow cluster response and affect system performance and availability. Therefore, CPU usage is one of the important metrics to ensure high performance and high availability of Cassandra clusters.
2. Memory usage:
Memory is an important Cassandra cluster resource. Memory usage reflects the memory load of the clusters. High memory usage may cause high loads on clusters, affecting the performance and availability of the system. Therefore, memory usage is also one of the important metrics for Cassandra cluster monitoring.
3. Hard disk usage:
Hard disks are the storage resources of Cassandra clusters. Hard disk usage reflects the load of cluster storage. High hard disk usage may cause excessive storage pressure on clusters and affect the performance and availability of the system. Therefore, hard disk usage is also one of the important metrics for Cassandra cluster monitoring.
4. Network usage:
The network is the communication resource of Cassandra clusters, and the network usage reflects the load of communication between cluster nodes. High network usage may cause cluster communication exceptions and affect the performance and availability of the system. Therefore, network usage is also one of the important metrics for Cassandra cluster monitoring.
Memtable, SSTable, and Commit Log are the three parts that store data in Cassandra. They play different roles and play an important role in the read and write operations of Cassandra. We recommend that you monitor the storage usage of these three parts.
1. Memtable storage usage:
Monitoring the storage usage of Memtable can detect problems in write performance and efficiency in clusters in time. If the Memtable storage usage is too large, the write performance may degrade, which affects the performance and availability of the system. Therefore, monitoring the storage usage of Memtable can help O&M personnel take timely measures to optimize the write performance and efficiency of clusters.
2. SSTable storage usage:
Monitoring the SSTable storage usage can detect the problem of insufficient storage capacity in clusters in time. If the SSTable storage usage is too large, the storage capacity may be insufficient, which affects the performance and availability of the system. Therefore, monitoring the SSTable storage usage can help O&M personnel take timely measures to increase the storage capacity of clusters and ensure high availability and high performance of clusters.
3. Commit Log storage usage:
Monitoring the Commit Log storage usage can detect failure recovery problems in clusters in a timely manner. If the storage usage of Commit Logs is too large, the failure recovery time may be longer, affecting the reliability and stability of the system. Therefore, monitoring the storage usage of Commit Logs can help O&M personnel take timely measures to optimize the failure recovery capability of clusters and ensure high reliability and high availability of clusters.
We recommend that you monitor the thread pool of Cassandra by counting the number of active tasks, blocked tasks, and pending tasks for real-time monitoring.
1. Active task:
The number of tasks that are being executed. If the number of active tasks is too high, the thread pool may be overloaded, affecting the performance and availability of the system.
2. Blocked tasks:
The number of tasks that are waiting to acquire locks. If the number of blocked tasks is too high, the thread pool may be blocked, affecting the performance and availability of the system.
3. Pending task:
The number of tasks that are waiting to be executed. If the number of pending tasks is too high, it may cause a backlog of tasks and affect the performance and availability of the system.
By monitoring these three metrics, you can detect performance problems in the thread pool in time, so as to take corresponding measures to optimize the performance and efficiency of the thread pool. At the same time, monitoring the thread pool can also help O&M personnel detect problems such as thread pool overload, blocking, and task backlog in a timely manner, thus ensuring high availability and high performance of Cassandra clusters.
As a Java-based application, Cassandra also needs to monitor three JVM-related metrics: JVM application throughput, JVM garbage collection time, and JVM memory usage. These metrics are important for ensuring high availability and high performance of Cassandra.
1. JVM application throughput rate:
It refers to the number of tasks completed by JVM in a unit of time, that is, throughput. A high throughput rate indicates better JVM performance, and vice versa. Therefore, monitoring the JVM application throughput rate can detect problems in time when the JVM performance drops, so as to take measures to optimize it.
2. JVM garbage collection time:
It refers to the time required for JVM garbage collection. High garbage collection time will cause JVM performance degradation. Therefore, monitoring the JVM garbage collection time can help O&M personnel detect performance problems in the garbage collection process in time, so as to optimize JVM performance.
3. JVM memory usage:
It refers to the memory size occupied by JVM during operation. If the JVM memory usage is too high, it may cause memory overflow and affect the performance and availability of the system. Therefore, monitoring the JVM memory usage can help O&M personnel to detect memory problems in time, so as to take measures to optimize it.
When you configure alert rules for Cassandra, we recommend that you configure alert rules based on the preceding metrics from the following aspects: cluster status, resource usage, read/write latency and throughput, exceptions and errors, and JVM. The following are some recommended alert rules.
We recommend that you monitor the proportion of Cassandra nodes that go down in the cluster and flexibly set the threshold as needed.
When you set the threshold, you must take into account the size, hardware configuration, data load, and business requirements of the Cassandra cluster. In general, if a cluster contains multiple nodes, we recommend that you keep the proportion of nodes that go down below 5%. If the cluster is small, you can set a stricter threshold. However, it should be noted that too strict thresholds may lead to misreporting, while too loose thresholds may lead to failure to report. Therefore, when you set the threshold, it is necessary to adjust and optimize it according to the actual situation.
In terms of resource usage, we recommend that you configure alert rules for the CPU, memory, and hard disk usage of each node in a Cassandra cluster:
1. CPU usage:
We recommend that you set an alert threshold for CPU usage. When the CPU usage of a node exceeds the threshold, an alert can be sent to notify relevant personnel to handle it in time. This prevents the Cassandra cluster from entering an unstable state or even experiencing downtime, ensuring high availability and high performance of the Cassandra cluster.
2. Memory usage:
We recommend that you set an alert threshold for memory usage. When the memory usage of a node exceeds the threshold, an alert can be sent to notify relevant personnel to handle it in time to prevent system crashes due to insufficient memory.
3. Hard disk usage:
We recommend that you set an alert threshold for hard disk usage. When the hard disk usage of a node exceeds the threshold, an alert can be sent to notify relevant personnel to handle it in time to prevent data loss due to insufficient disk space.
Cassandra is a database service, so its read/write latency and throughput are important performance metrics. Therefore, you need to configure alert rules for the two metrics.
1. Read/write latency:
We recommend that you set to trigger an alert rule when the read/write latency exceeds the threshold. In a Cassandra cluster, the read/write latency is a very important performance metric. When the read/write latency exceeds the threshold, the response of the application will slow down, and even the data is lost. Therefore, it is necessary to monitor and configure alerts for the metric. When you configure alert rules for read/write latency, you must adjust and optimize the alert rules based on your business requirements. In general, a shorter threshold can be set, such as 1 second or less. When the read/write latency exceeds the specified threshold, an alert is triggered to notify the relevant personnel to handle the problem in a timely manner. In addition, it can also be adjusted according to business requirements and data load to meet the requirements of the application as much as possible.
2. Throughput:
The throughput reflects the number of requests processed by the Cassandra service in a unit of time. Excessive throughput may cause the system to enter an unstable state or even go down. When the throughput of a Cassandra cluster is too high, system resources, such as CPU, memory, and disks, may be insufficient and reach bottlenecks, affecting the stability and availability of the system. In addition, excessive throughput may also cause data inconsistency, such as data loss due to write conflicts. Therefore, we recommend that you configure alert rules for the throughput of a Cassandra cluster to detect and handle excessive throughput problems in a timely manner. When you configure alert rules for throughput, you need to adjust and optimize them according to the actual situation. For example, adjust them according to business requirements and data load to meet the requirements of applications as much as possible.
You need to be vigilant when exceptions and errors occur in the Cassandra service. Cassandra is a distributed database system. Exceptions and errors may have a great impact on the consistency and availability of data, so they need to be monitored and handled.
We recommend that you configure alert rules for the following exceptions and errors: timeout requests, failed requests, and dropped messages. These exceptions and errors can affect the availability and performance of Cassandra clusters, so they need to be monitored and handled.
1. Timeout request:
A timeout request occurs when the Cassandra service cannot respond to the request within the specified time. It may cause the client to fail to obtain the required data, affecting the availability and performance of the system. Therefore, we recommend that you monitor timeout requests and configure corresponding alert rules to detect and handle problems in a timely manner.
2. Failed requests:
A failed request occurs when the Cassandra service cannot complete the request. It may cause data inconsistency and affect the availability and performance of the system. Therefore, we recommend that you monitor failed requests and configure corresponding alert rules to detect and handle problems in a timely manner.
3. Dropped messages:
Messages in a Cassandra cluster may be lost due to network problems or node failures. These lost messages may cause data inconsistency and affect the availability and performance of the system. Therefore, we recommend that you monitor dropped messages and configure alert rules to detect and handle problems in a timely manner.
We recommend that you configure alert rules for the proportion of garbage collection (GC) time in the Cassandra service. Frequent GC operations may have a great impact on the performance of the application, so they need to be monitored and handled.
In Cassandra, GC is an important operation to reclaim useless memory. When GC operations occur frequently, they may consume a large amount of CPU time and affect the performance and availability of the system. Therefore, we recommend that you monitor the proportion of GC time in the Cassandra service and configure corresponding alert rules to detect and handle problems in a timely manner.
When you configure alert rules, you need to adjust and optimize them according to the actual situation. In general, you can set a shorter GC time proportion threshold, such as 10% or less time. When the proportion of GC time exceeds the specified threshold, an alert is triggered to notify relevant personnel to handle the problem in a timely manner.
Currently, Cassandra monitoring schemes that are widely used are mainly JMX-based monitoring schemes. You can create an agent by yourself or select an agent from the open source community. Then, you can mount the agent when the Cassandra service is started to monitor the Cassandra cluster.
After the corresponding agent is mounted, you need to register the service in the self-managed Prometheus, and then customize the Cassandra monitoring dashboard based on tools such as Grafana.
In the self-managed Cassandra monitoring scheme, you may encounter some problems and challenges. Here are some of the problems and challenges that may arise:
1. The quality of agents in the community varies greatly:
There are many Cassandra monitoring agents to choose from in the open source community. However, the quality and performance of these agents varies. Some agents may have bugs or performance problems that may affect the performance and availability of Cassandra clusters.
2. Metrics lack explanation:
When you monitor Cassandra, there are many metrics to monitor. However, the meaning and explanation of these metrics may not be clear, which require O&M personnel to understand and explain them. If there is a lack of explanation of metrics, O&M personnel may not have a comprehensive understanding of the status and performance of Cassandra clusters and cannot detect problems in a timely manner.
3. Self-managed dashboards are not professional enough:
When you create a self-managed Cassandra monitoring dashboard, you need to process and visualize the data. However, if there is a lack of professional technology and tools, the self-managed dashboards may not be professional enough to meet the needs of O&M personnel.
To avoid these problems and challenges, we recommend that you use Alibaba Cloud Managed Service for Prometheus to monitor Cassandra databases, which is out-of-the-box and can implement one-click integration.
Only Prometheus instances for ECS type support this component. You need to connect VPC instances to Managed Service for Prometheus. For more information, see Create a Prometheus Instance to Monitor an ECS Instance.
Create a Prometheus Instance to Monitor an ECS Instance
Log on to the Prometheus console. In the upper-left corner of the page, select the target region, select a Prometheus monitoring instance in VPC, and then click Install Cassandra in the Integration Center.
Complete the installation steps as prompted. During the installation process, you need to download and deploy the JMX Agent (the download link of the agent is provided).

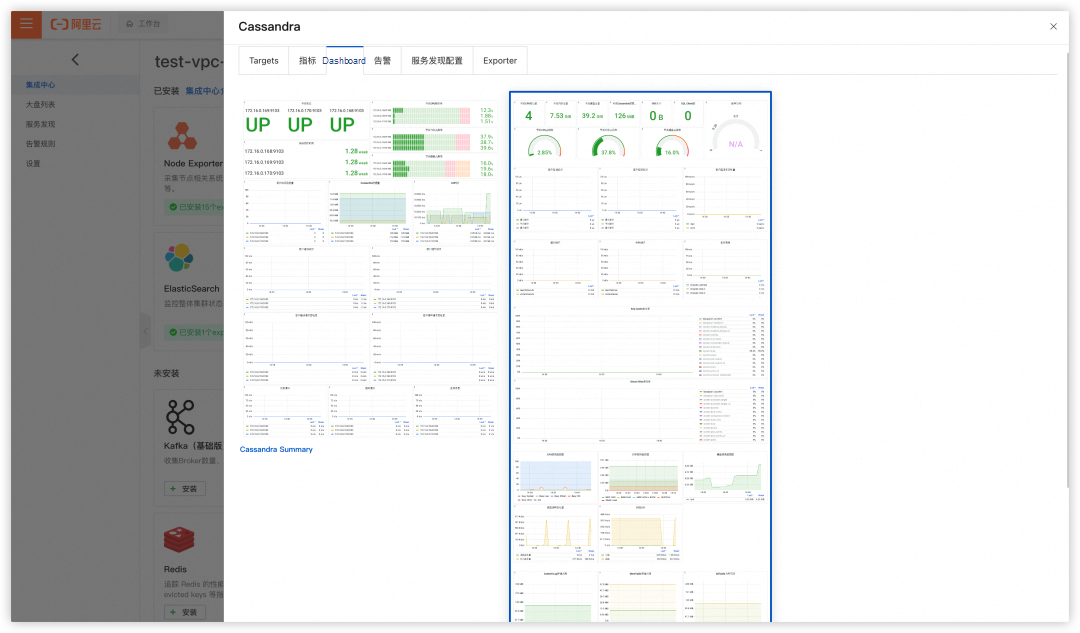
A large number of metrics are collected in Cassandra monitoring provided by Alibaba Cloud. You can click Cassandra and the Metric section to view the metrics.
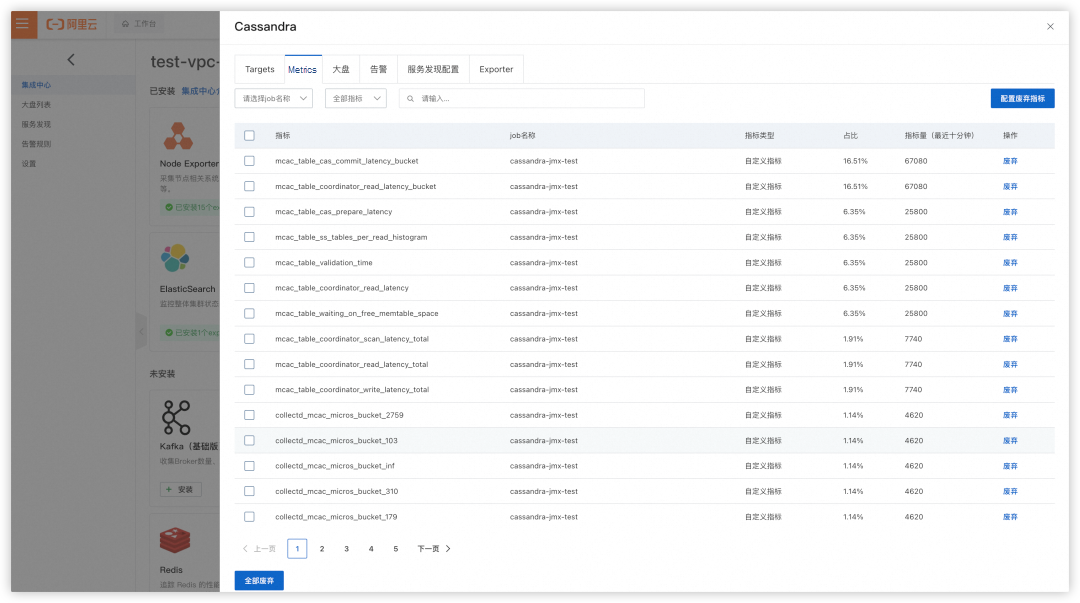
In addition, professional dashboards and built-in alert rules are provided to make it out-of-the-box.

[1] https://www.cloudwalker.io/2020/05/17/monitoring-Cassandra-with-prometheus/
[2] https://www.datadoghq.com/blog/how-to-monitor-Cassandra-performance-metrics/
[3] https://www.datadoghq.com/blog/how-to-collect-Cassandra-metrics/
[4] https://docs.datadoghq.com/integrations/Cassandra/
[5] https://www.jianshu.com/p/cc619b5bccf6
[6] https://www.jianshu.com/p/684a4a1715e4
[7] https://www.jianshu.com/p/8cf836a55a68
How Do Kubernetes Clusters in On-premises IDCs Use Cloud Resources in Serverless Mode
Service Mesh Optimization Center: Optimizing Service Mesh for Higher Performance and Availability

212 posts | 13 followers
FollowAlibaba Cloud Native - September 8, 2023
Alibaba Cloud Native - August 14, 2024
Alibaba Cloud Native Community - August 30, 2022
Alibaba Cloud Native - March 6, 2024
Alibaba Cloud Native - November 6, 2024
Alibaba Cloud Native Community - February 2, 2026

212 posts | 13 followers
Follow Best Practices
Follow our step-by-step best practices guides to build your own business case.
Learn More ApsaraDB for Cassandra
A database engine fully compatible with Apache Cassandra with enterprise-level SLA assurance.
Learn More Managed Service for Prometheus
Multi-source metrics are aggregated to monitor the status of your business and services in real time.
Learn More Application Real-Time Monitoring Service
Build business monitoring capabilities with real time response based on frontend monitoring, application monitoring, and custom business monitoring capabilities
Learn MoreMore Posts by Alibaba Cloud Native