By Baiyu
The vigorous development and implementation of container technology allows more enterprises to run their businesses in containers. As one of the mainstream deployment methods, containers separate the tasks and concerns of the team. The Development Team only needs to focus on application logic and dependencies, and the O&M Team only needs to focus on deployment and management. The O&M Team no longer needs to worry about application details, such as specific software versions and application-specific configurations. This means the Development Team and O&M Team can spend less time debugging and launching and more time delivering new functions to end users. Containers make it easier for enterprises to improve application portability and operational flexibility. According to a CNCF research report, 73% of respondents are using containers to improve production agility and speed up innovation.
Sometimes, we use containers on a large scale and may face a highly dynamic containerized environment that requires continuous monitoring. Thus, the establishment of a monitoring system is of great significance for maintaining a stable operating environment and optimizing resource costs. Each container image may have a large number of running instances. Due to the rapid introduction of new images and new versions, failures can easily spread through containers, applications, and architectures. This makes it crucial to locate the root cause of the problem immediately after it has occurred to prevent the spread of exceptions. After a lot of practice, we believe monitoring the following components is critical during container use:
Under a complete monitoring system, teams can understand what is happening in clusters, container runtimes, and applications by deeply understanding metrics, logs, and procedures. It is also helpful when making business decisions, such as the time to expand and reduce instances, tasks, and Pods and change instance types. DevOps engineers can also improve troubleshooting and resource management efficiency by adding automated alerts and related configurations. For example, they can actively monitor memory utilization to notify the O&M Team to add additional nodes before the available CPU and memory resources are exhausted when resource consumption approaches the threshold. The benefits include:
However, the O&M Team will feel that the benefits above are relatively insignificant during the implementation process. It seems the existing O&M tools can achieve the purposes above. However, if you cannot build a corresponding monitoring system for container-related scenarios, you have to face the following two troubles as your business continues to expand:
It is difficult for the Development Team and the O&M Team to understand what is running and its execution. Maintaining applications, meeting SLA requirements, and troubleshooting are extremely difficult.
The capability to quickly extend applications or microservice instances on-demand is an important requirement for containerized environments. The monitoring system is the only visual way to measure requirements and user experience. Delayed scale-out leads to a decline in performance and user experience, and delayed scale-in leads to a waste of resources and costs.
Therefore, when the problems and value of container monitoring constantly accumulate and appear, more O&M Teams begin to pay attention to the building of container monitoring systems. However, various unexpected problems are encountered during the process of real-world container monitoring implementation.
These problems include the tracking difficulty brought by the short-lived feature. Due to the complexity of the container, the container contains the underlying code and all the underlying services required for the application to run. As newly deployed applications are put into production and code and underlying services are changed, containerized applications are updated frequently, which increases the possibility of errors. The characteristics of fast creation and destruction make it extremely difficult to track changes in large-scale complex systems.
Due to the monitoring difficulties caused by shared resources, it is difficult to monitor the resource consumption on the physical host because the memory and CPU used by the container are shared among one or more hosts. This makes it difficult to obtain reliable indications of container performance or application health.
Finally, it is difficult for traditional tools to meet container monitoring requirements. Traditional monitoring solutions often lack the metrics needed for virtualized environments and the tools required for traces and logs, especially tools for container health and performance.
Therefore, considering the benefits, problems, and difficulties above, we need to design from the following dimensions when establishing a container monitoring system.
There are many open-source tools for O&M teams to choose from during the process of defining business demands and designing the monitoring system. However, the O&M Team also needs to evaluate possible business and project risks. These risks are listed below:
Therefore, based on the preceding insights and extensive practical experience, Alibaba Cloud has launched the Kubernetes monitoring service. Alibaba Cloud Kubernetes Monitoring is an all-in-one observability product developed for Kubernetes clusters. Kubernetes Monitoring provides IT developers and O&M personnel with a comprehensive observability solution based on multiple aspects of Kubernetes clusters, including metrics, traces, logs, and events. Alibaba Cloud Kubernetes Monitoring has the following six features.
At the same time, compared with open-source container monitoring, Alibaba Cloud Kubernetes Monitoring is closer to business scenarios.
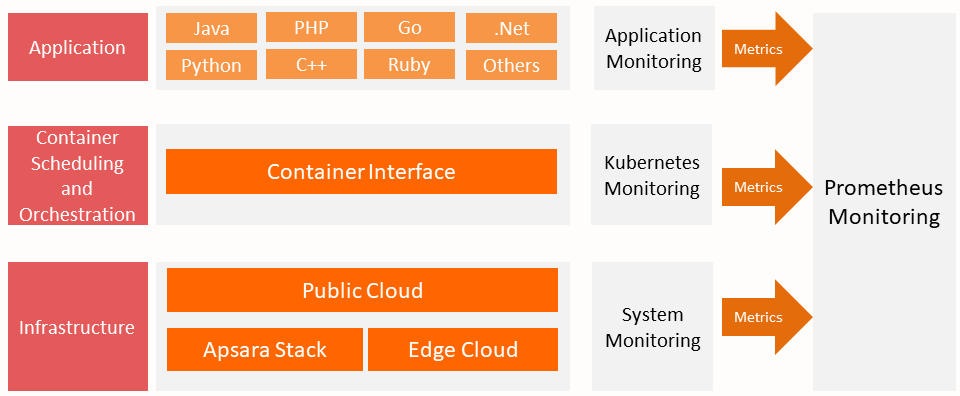
Based on the features and different values, we apply Kubernetes monitoring in the following scenarios.
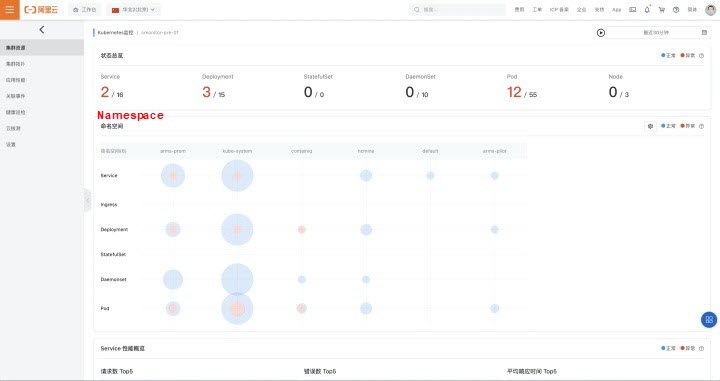
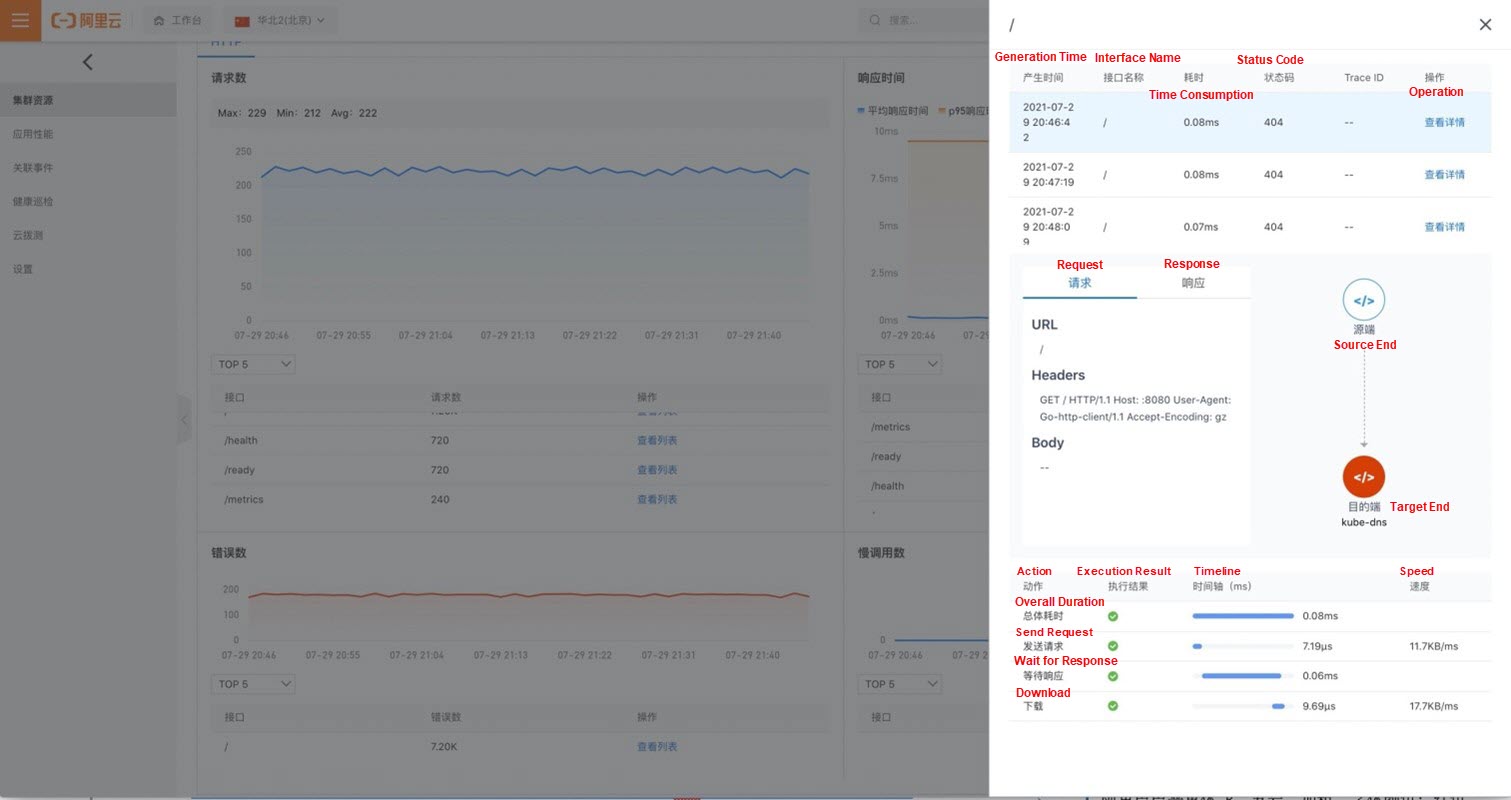
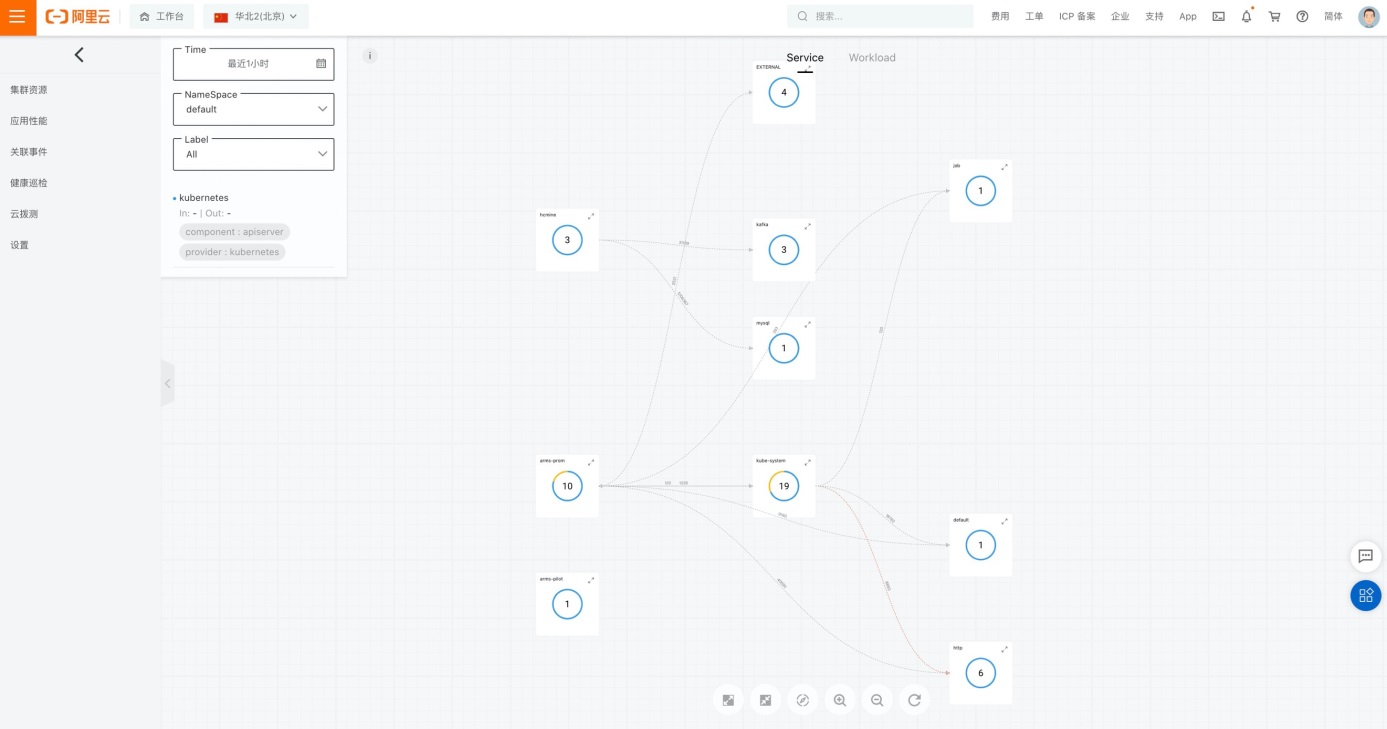
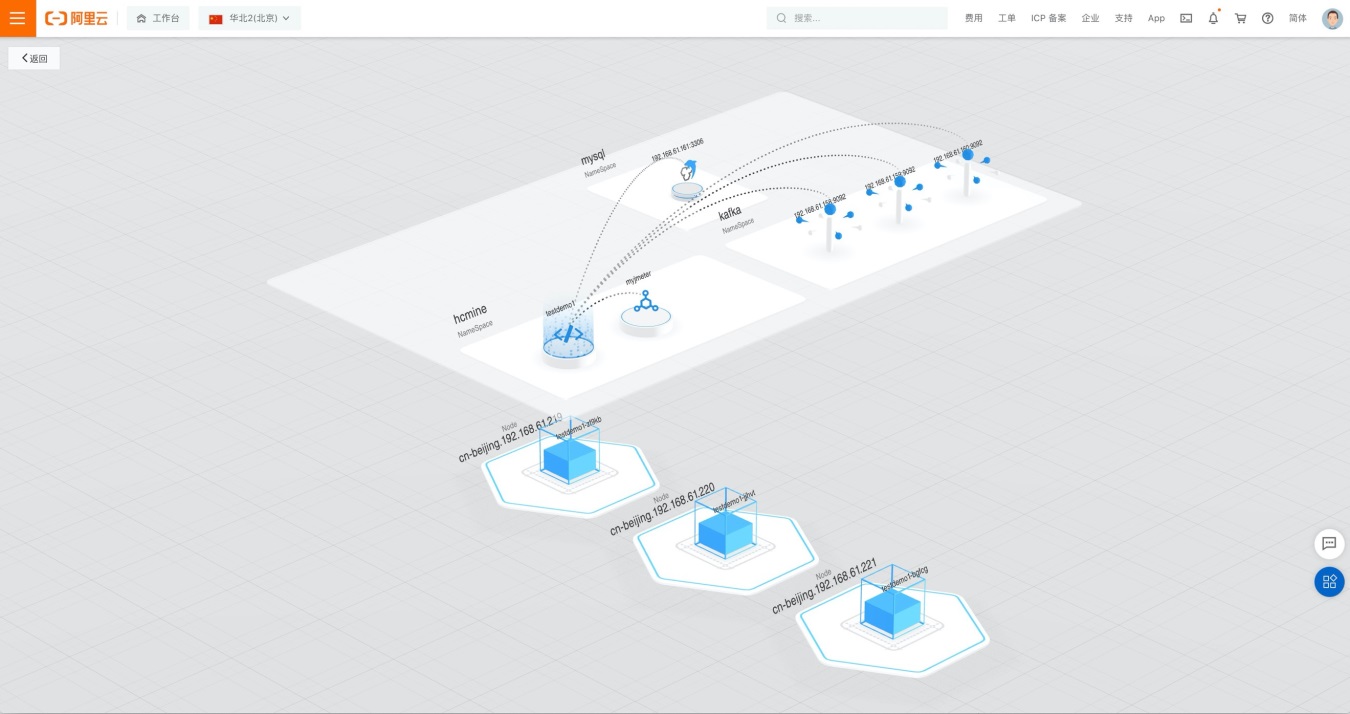
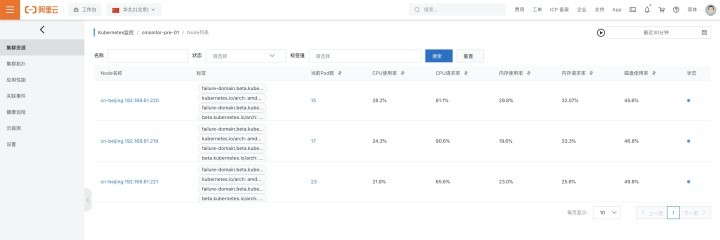
Currently, Kubernetes monitoring is in the public beta stage and is free to use. Let Kubernetes monitoring help you get rid of repeated and dull O&M work!
Serverless Engineering Practices: From Cloud Computing to Serverless

677 posts | 56 followers
FollowAlibaba Cloud Community - March 8, 2022
Alibaba Clouder - February 14, 2020
Alibaba Cloud Security - August 29, 2018
Alibaba Developer - June 23, 2020
Alibaba Cloud Community - October 16, 2025
OpenAnolis - June 9, 2022

677 posts | 56 followers
Follow Managed Service for Grafana
Managed Service for Grafana displays a large amount of data in real time to provide an overview of business and O&M monitoring.
Learn More Bastionhost
A unified, efficient, and secure platform that provides cloud-based O&M, access control, and operation audit.
Learn More Container Compute Service (ACS)
A cloud computing service that provides container compute resources that comply with the container specifications of Kubernetes
Learn More Container Service for Kubernetes
Alibaba Cloud Container Service for Kubernetes is a fully managed cloud container management service that supports native Kubernetes and integrates with other Alibaba Cloud products.
Learn MoreMore Posts by Alibaba Cloud Native Community