By Yangkun Ai (Apache RocketMQ PMC Member/Committer, CNCF OpenTelemetry Member, and CNCF Envoy Contributor)
In a distributed system, the interaction between multiple services involves complex network communication and data transmission, where each service may be maintained and developed by a different team or organization. Therefore, in such an environment, a request is sent and processed by multiple services. If a problem or error occurs, it is difficult to locate the root cause quickly. Distributed end-to-end tracing analysis technology can help solve this problem. It can track and record the transmission process of the request in the system and provide detailed performance and logs, so developers can quickly diagnose and locate the problem. It plays an important role in the reliability, performance, and maintainability of distributed systems.
As the largest iteration of Apache RocketMQ 5.0 in recent years, many improvements have been made in the overall observability. Among them, supporting standardized distributed end-to-end Tracing Analysis is an important feature.
RocketMQ 5.0 Observability
As the official successor of OpenTracing and OpenCensus, CNCF OpenTelemetry (jointly launched by Google, Microsoft, Uber, and LightStep) has become the de facto standard in the observability field. The distributed end-to-end tracing analysis of RocketMQ is also developed around OpenTelemetry.
The origins of distributed tracing analysis systems can be traced back to Google's 2007 paper entitled Dapper, a Large-Scale Distributed Systems Tracing Infrastructure [1]. This paper details the tracing analysis system Dapper used internally by Google, where the span concept was widely adopted and became one of the basic concepts in the later open-source tracing analysis system.
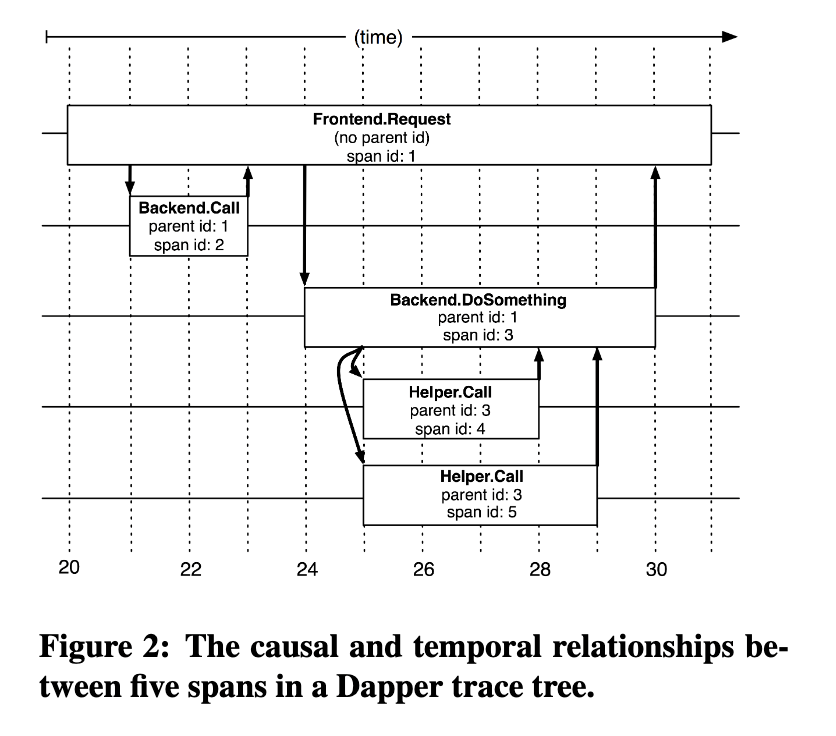
Dapper Trace Tree
In Dapper, a span is created when each request or transaction is tracked to record the time and status information of each component and operation during the entire request or transaction processing process. The span can be nested to form a tree structure, which is used to represent the dependencies and calling relationships between various components in the entire request or transaction process. Later, many open-source tracing analysis systems (such as Zipkin and OpenTracing) adopted a similar span concept to describe tracing analysis information in distributed systems. Now, CNCF OpenTelemetry, which combines OpenTracing and OpenCensus, has naturally adopted the span concept and further developed on this basis.
OpenTelemetry defines a set of semantic conventions [2] for the span related to messaging, which aims to develop a set of specifications independent of a specific messaging system. OpenTelemetry's development is driven by specifications.
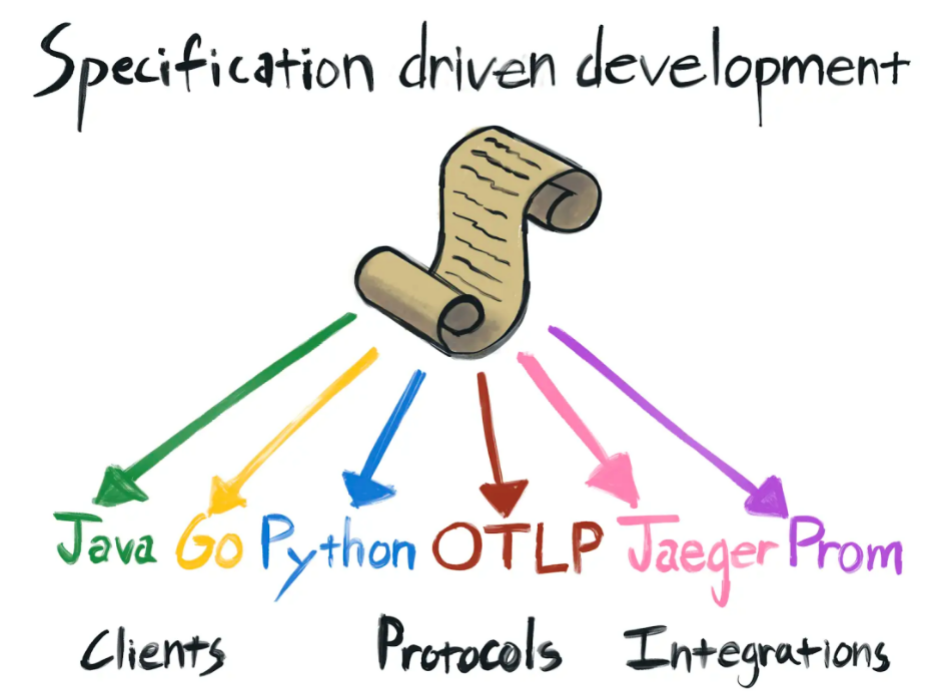
Specification Driven Development
The specification describes the topological relationships of messaging span, including the parent-child and link relationships between different spans that represent message sending, receiving, and processing. Please refer to Semantic Conventions of Messaging [3] for specific definitions. There are three different types of span in Message Queue for Apache RocketMQ.
| Span | Description |
| send | The sending process of a message. The span starts with a sending behavior and ends with a success or failure/exception. The internal retries of message sending are recorded as multiple span entries. |
| receive | The long polling process for receiving messages in consumers is consistent with the lifecycle of long polling. |
| process | Corresponding to the message processing process in the MessageListener of PushConsumer, the span starts with entering MessageListener and ends with leaving MessageListener. |
Specifically, the receive span is not enabled by default. The organizational relationship between the span is different in the two cases where the receive span is enabled and not enabled.
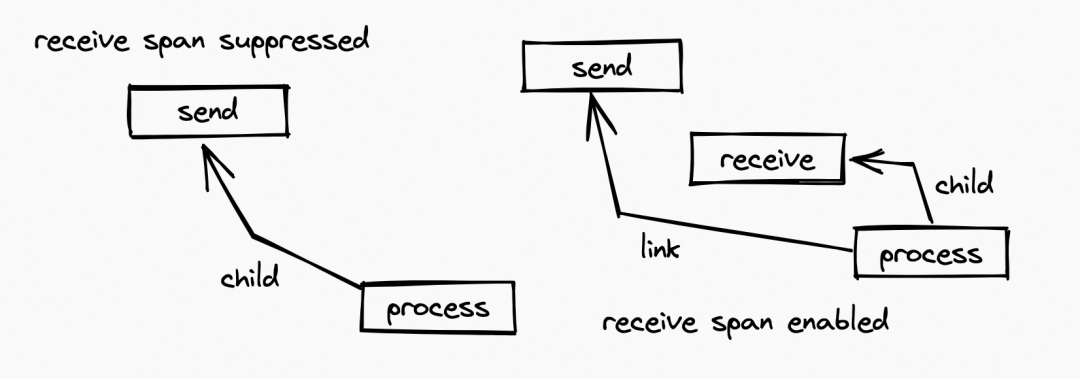
Span Relationships before and after Enabling Receive Span
If the receive span is not enabled, the process span is used as the child of the send span. If the receive span is enabled, the process span is used as the child of the receive span and is linked to the send span.
The semantic convention specifies the uniform names of the common attributes carried with the span, including (but not limited to):
Please see Messaging Attributes [4] for more information.
In particular, different message systems may have their specific behaviors and attributes. RocketMQ, together with Kafka and RabbitMQ, has promoted their unique attributes to the community specification [5], including:
| Attribute | Type | Description |
| messaging.rocketmq.namespace | string | The RocketMQ resource namespace is not enabled. |
| messaging.rocketmq.client_group | string | The RocketMQ producer/consumer load balancing group. RocketMQ 5.0 only takes effect for the consumer. |
| messaging.rocketmq.client_id | string | The unique identifier of the client |
| messaging.rocketmq.message.delivery_timestamp | int | The scheduled time of the scheduled message, which only takes effect for RocketMQ 5.0. |
| messaging.rocketmq.message.delay_time_level | int | The timing level of scheduled messages, which only takes effect for RocketMQ 4.0. |
| messaging.rocketmq.message.group | string | Ordered message grouping, which only takes effect for RocketMQ 5.0 |
| messaging.rocketmq.message.type | string | The type of message may be normal, fifo, delay, or transaction, which only takes effect for RocketMQ 5.0. |
| messaging.rocketmq.message.tag | string | Message tag |
| messaging.rocketmq.message.keys | string[] | Message keys (can have multiple keys) |
| messaging.rocketmq.consumption_model | string | The message consumption model, which may be clustering or broadcasting. RocketMQ 5.0 broadcasting was abandoned. |
There are two different ways to add observability information to an application in OpenTelemetry.
In the Java class library, the former is a more common form of use. The trace of the Message Queue for Apache RocketMQ 5.0 client is also implemented by the automatic instrumentation. In a Java program, the automatic instrumentation takes the form of mounting a Java agent. In the past year, we have introduced the RocketMQ 5.0 client instrumentation [6] to the OpenTelemetry community. Now, you only need to mount the OpenTelemetry agent when the Java program is running to implement distributed end-to-end tracing analysis transparent to the application.
In addition, Automatic Instrumentation does not conflict with Manual Instrumentation, and the key objects used in Automatic Instrumentation are registered as global objects, which can be easily obtained in the way Manual Instrumentation is used. It is very flexible and convenient when two Instrumentation share a set of configurations.
Prepare a Message Queue for Apache RocketMQ 5.0 client for Java. Please see example[7] for more information. Please refer to the RocketMq-clients repository [8] and RocketMQ official website [9] for more details about RocketMQ 5.0.
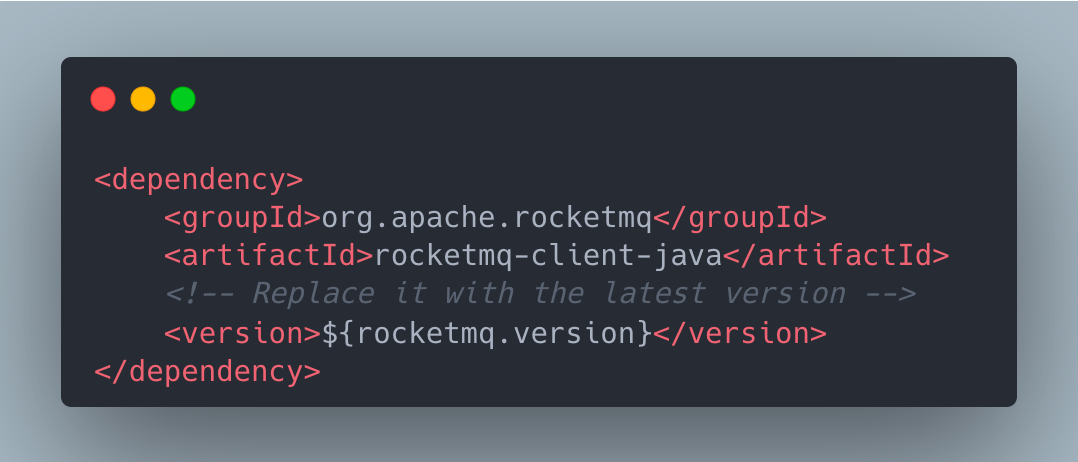
Then, prepare the OpenTelemetry agent jar. You can download the latest agent [10] from OpenTelemetry and add -javaagent:yourpath/opentelemetry-javaagent.jar when the application starts.
You can set the access point of the OpenTelemetry collector by setting the OTEL_EXPORTER_OTLP_ENDPOINT environment variable.
By default, only the span of send and process is enabled according to the specification on messaging in OpenTelemetry. The span of receive is not enabled by default. In order to enable receive span, you need to manually set-Dotel.instrumentation.messaging.experimental.receive-telemetry.enabled=true.
Currently, mainstream cloud service providers provide good support for OpenTelemetry. Both SLS and ARMS on Alibaba Cloud provide distributed end-to-end tracing analysis services based on OpenTelemetry.
This code example (rocketmq-opentelemetry[11]) demonstrates the process of distributed end-to-end tracing analysis. In this code example, three different processes are started, involving mutual calls between three different class libraries and business logic. This shows a typical case of interaction between more complex middleware in a distributed environment.
First, a request is sent from the gRPC client to the gRPC server. After receiving the request, the gRPC server sends a message to the producer of RocketMQ 5.0 and then returns a response to the client.
After receiving the message, the PushConsumer of RocketMQ 5.0 uses Apache HttpClient in the MessageListener to send a GET request to Taobao.com.

Sample Code Call Link
In particular, gRPC clients initiate specific calls within the lifecycle of an upstream service span, which we call ExampleUpstreamSpan.
After receiving a message, the RocketMQ 5.0 PushConsumer also performs other business operations in the MessageListener. The corresponding span is called ExampleDownstreamSpan. By default, if the receive span is not enabled, seven spans exist in order of start time. They are:
Create a trace service in Alibaba Cloud Log Service. Then, obtain the endpoint, project, and instance name. Please see Use OpenTelemetry to connect to Log Service Trace Service [12] for more information.
After you add the information, you can wait a moment to see that the corresponding trace information has been uploaded to the SLS trace service.
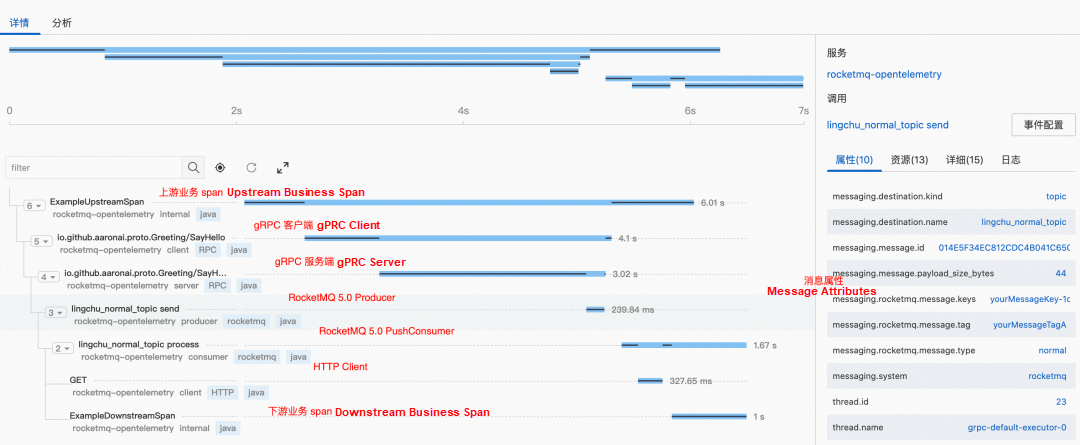
Distributed End-to-End Display of the Log Service Trace Service
The Trace service stores relevant data in logs, so these data can be queried using the SQL syntax of SLS.
Trace data allows you to easily know the user's operating system environment, Java version, and other basic information. A series of valid information (such as the message sending latency, failure or not, whether the message is delivered to the client on time, the local consumption time of the client, and whether the consumption fails or not) can help troubleshoot the problem effectively.
In addition, the demo page of the SLS trace service provides a message middleware dashboard customized based on RocketMQ 5.0, which vividly displays a series of metrics (such as the success rate of sending and end-to-end latency obtained) using trace data.
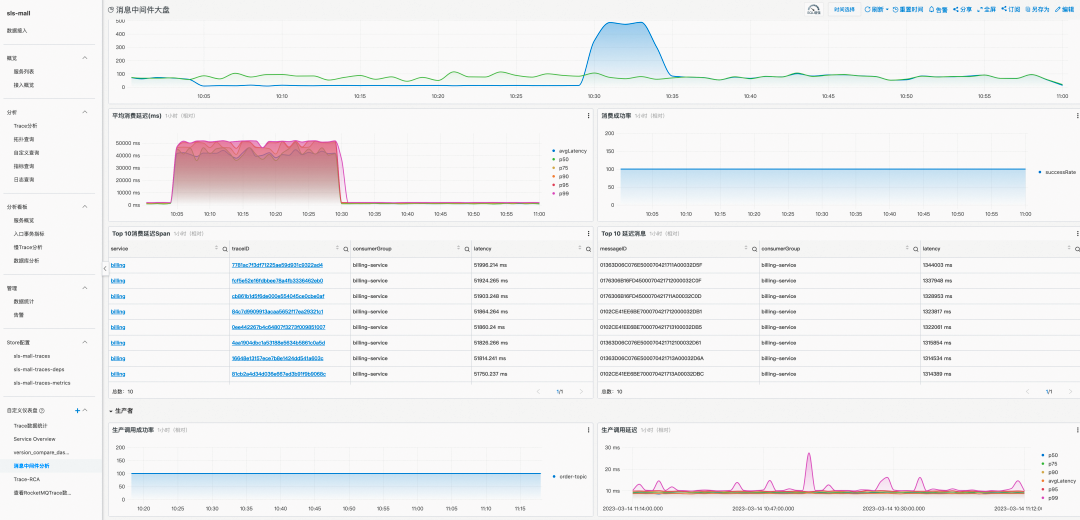
Message Middleware Analysis
Log on to the ARMS console, click OpenTelemetry in the access center, select Auto Detection under Java Applications, obtain the startup parameters, and modify the parameters to your Java application. Please see Use OpenTelemetry to access ARMS [15] for more information.
After configuring the parameters, start your related application. After a while, you can see the corresponding data in the ARMS Trace Explorer.

Trace Explorer
You can view the timing relationships between the span.

ARMS Trace Explorer Distributed End-to-End Tracing Analysis Display
Specifically, you can click each span to view detailed information (such as attributes, resources, and events). In addition, ARMS allows you to forward trace data from applications using OpenTelemetry Collector.
With the continuous evolution of modern application architecture, the importance of observability has become increasingly prominent. It helps us quickly find and solve problems in the system and improves the reliability and performance of the application. It is also a key part of implementing DevOps. Star companies like DataDog and Dynatrace were also created in related fields.
In recent years, some emerging technologies, such as (Extended Berkeley Packet Filter (eBPF) and Service Mesh, have also provided some new ideas for observability.
eBPF can run at the kernel level and dynamically inject code to monitorg the system behavior. It is widely used in real-time network and system performance monitoring, security auditing, and debugging tasks and has a little performance impact. It can also be used as an option for continuous profiling in the future. Service Mesh implements traffic management, security, and observability by injecting a proxy layer between applications. The agent layer can collect and report various metrics and metadata about traffic, which helps us understand the behavior and performance of various components in the system.
A large part of the technical trends reflected in Service Mesh has been applied to the RocketMQ 5.0 proxy, and we are also converging more observability metrics to the proxy. In the future, the current trace link is also considered to be associated with the server and to build an all-around tracing analysis system on the user side, the O&M side, and across multiple applications. In addition, you can use technologies (such as Exemplars) to link trace data with metrics data and realize the ultimate troubleshooting effect of surface-to-line and line-to-point.
In the observability field, RocketMQ is constantly exploring more advanced observability methods to help developers and customers find hidden dangers in the system faster and more easily.
[1] Dapper, a Large-Scale Distributed Systems Tracing Infrastructure https://storage.googleapis.com/pub-tools-public-publication-data/pdf/36356.pdf
[2] A set of semantic conventions
https://github.com/open-telemetry/opentelemetry-specification/blob/main/specification/trace/semantic_conventions/messaging.md
[3] Semantic Conventions of Messaging
https://github.com/open-telemetry/opentelemetry-specification/blob/main/specification/trace/semantic_conventions/messaging.md
[4] Part of Messaging Attributes
https://github.com/open-telemetry/opentelemetry-specification/blob/main/specification/trace/semantic_conventions/messaging.md#messaging-attributes
[5] RocketMQ, together with Kafka and RabbitMQ, has promoted their unique attributes to the community specification.
https://github.com/open-telemetry/opentelemetry-specification/blob/main/specification/trace/semantic_conventions/messaging.md#apache-rocketmq
[6] Instrumentation based on RocketMQ 5.0 client
https://github.com/open-telemetry/opentelemetry-java-instrumentation/tree/main/instrumentation/rocketmq/rocketmq-client/rocketmq-client-5.0
[8] rocketmq-clients Warehouse
https://github.com/apache/rocketmq-clients
[9] Official RocketMQ website
https://rocketmq.apache.org/
[10] Download the latest agent
https://github.com/open-telemetry/opentelemetry-java-instrumentation/releases/latest/download/opentelemetry-javaagent.jar
[11] rocketmq-opentelemetry
https://github.com/aaron-ai/rocketmq-opentelemetry
[12] Use OpenTelemetry to access the Log Service trace service
https://www.alibabacloud.com/help/en/log-service/latest/import-trace-data-overview
[13] Message middleware analysis Tab
https://1340796328858956.cn-shanghai.fc.aliyuncs.com/2016-08-15/proxy/demo/newconsoledemo/?spm=5176.2020520112.112.1.2a5334c0YSFKGv&redirect=true&type=42
[14] View RocketMQ Trace Tab
https://1340796328858956.cn-shanghai.fc.aliyuncs.com/2016-08-15/proxy/demo/newconsoledemo/?spm=5176.2020520112.112.1.2a5334c0YSFKGv&redirect=true&type=43
[15] Connect to ARMS by using OpenTelemetry
https://www.alibabacloud.com/help/en/application-real-time-monitoring-service/latest/access-arms-through-opentelemetry
Message Queue for Apache RocketMQ 5.0 Client:
https://github.com/apache/rocketmq-clients
OpenTelemetry Instrumentation for RocketMQ 5.0:
https://github.com/open-telemetry/opentelemetry-java-instrumentation/tree/main/instrumentation/rocketmq/rocketmq-client/rocketmq-client-5.0
An Example of OpenTelemetry in Message Queue for Apache RocketMQ:
https://github.com/aaron-ai/rocketmq-opentelemetry
In-depth Interpretation of OpenYurt v1.2: Five Steps to Build an OpenYurt Cluster

700 posts | 56 followers
FollowAlibaba Cloud Native Community - January 5, 2023
Alibaba Cloud Native - April 6, 2022
Alibaba Cloud Native Community - April 13, 2023
Alibaba Cloud Community - July 7, 2023
Alibaba Cloud Native Community - May 16, 2023
Alibaba Cloud Native Community - December 16, 2022

700 posts | 56 followers
Follow ApsaraMQ for RocketMQ
ApsaraMQ for RocketMQ is a distributed message queue service that supports reliable message-based asynchronous communication among microservices, distributed systems, and serverless applications.
Learn More AliwareMQ for IoT
A message service designed for IoT and mobile Internet (MI).
Learn More Application Real-Time Monitoring Service
Build business monitoring capabilities with real time response based on frontend monitoring, application monitoring, and custom business monitoring capabilities
Learn More Message Queue for RabbitMQ
A distributed, fully managed, and professional messaging service that features high throughput, low latency, and high scalability.
Learn MoreMore Posts by Alibaba Cloud Native Community