This topic describes how to send OpenTelemetry trace data to ARMS and how to use this data.
Send OpenTelemetry trace data
ARMS supports multiple methods for receiving OpenTelemetry trace data. You can send trace data directly to ARMS or forward it through an OpenTelemetry Collector.
Direct reporting
-
Report trace data using the ARMS Java Agent and the OpenTelemetry Java SDK
You can use ARMS Java Agent v2.7.1.3 or later to automatically collect trace data from common components and instrument custom methods with the OpenTelemetry SDK. For more information, see Add custom instrumentation to a trace by using the OpenTelemetry Java SDK.
-
Report trace data directly using OpenTelemetry
You can also instrument your application with the OpenTelemetry SDK and send trace data directly using a Jaeger Exporter. For more information, see Report data from a Java application by using OpenTelemetry.
Forward data through an OpenTelemetry Collector
Forward trace data using the open-source OpenTelemetry Collector
To forward trace data to ARMS using the open-source OpenTelemetry Collector, modify the endpoint and authentication token in the exporter configuration.
exporters:
  otlp:
    endpoint: <endpoint>:8090
    tls:
      insecure: true
    headers:
Authentication: <token>-
Replace
<endpoint>with the endpoint for your region. For example:http://tracing-analysis-dc-bj.aliyuncs.com:8090. -
Replace
<token>with the token that you obtain from the console. For example:b590lhguqs@3a7*********9b_b590lhguqs@53d*****8301.
Use OpenTelemetry traces
To help you get the most value from your OpenTelemetry trace data, ARMS provides a range of diagnostic features, including trace details, pre-aggregated metric dashboards, post-aggregated metric analysis in Trace Explorer, and trace-to-service log correlation.
-
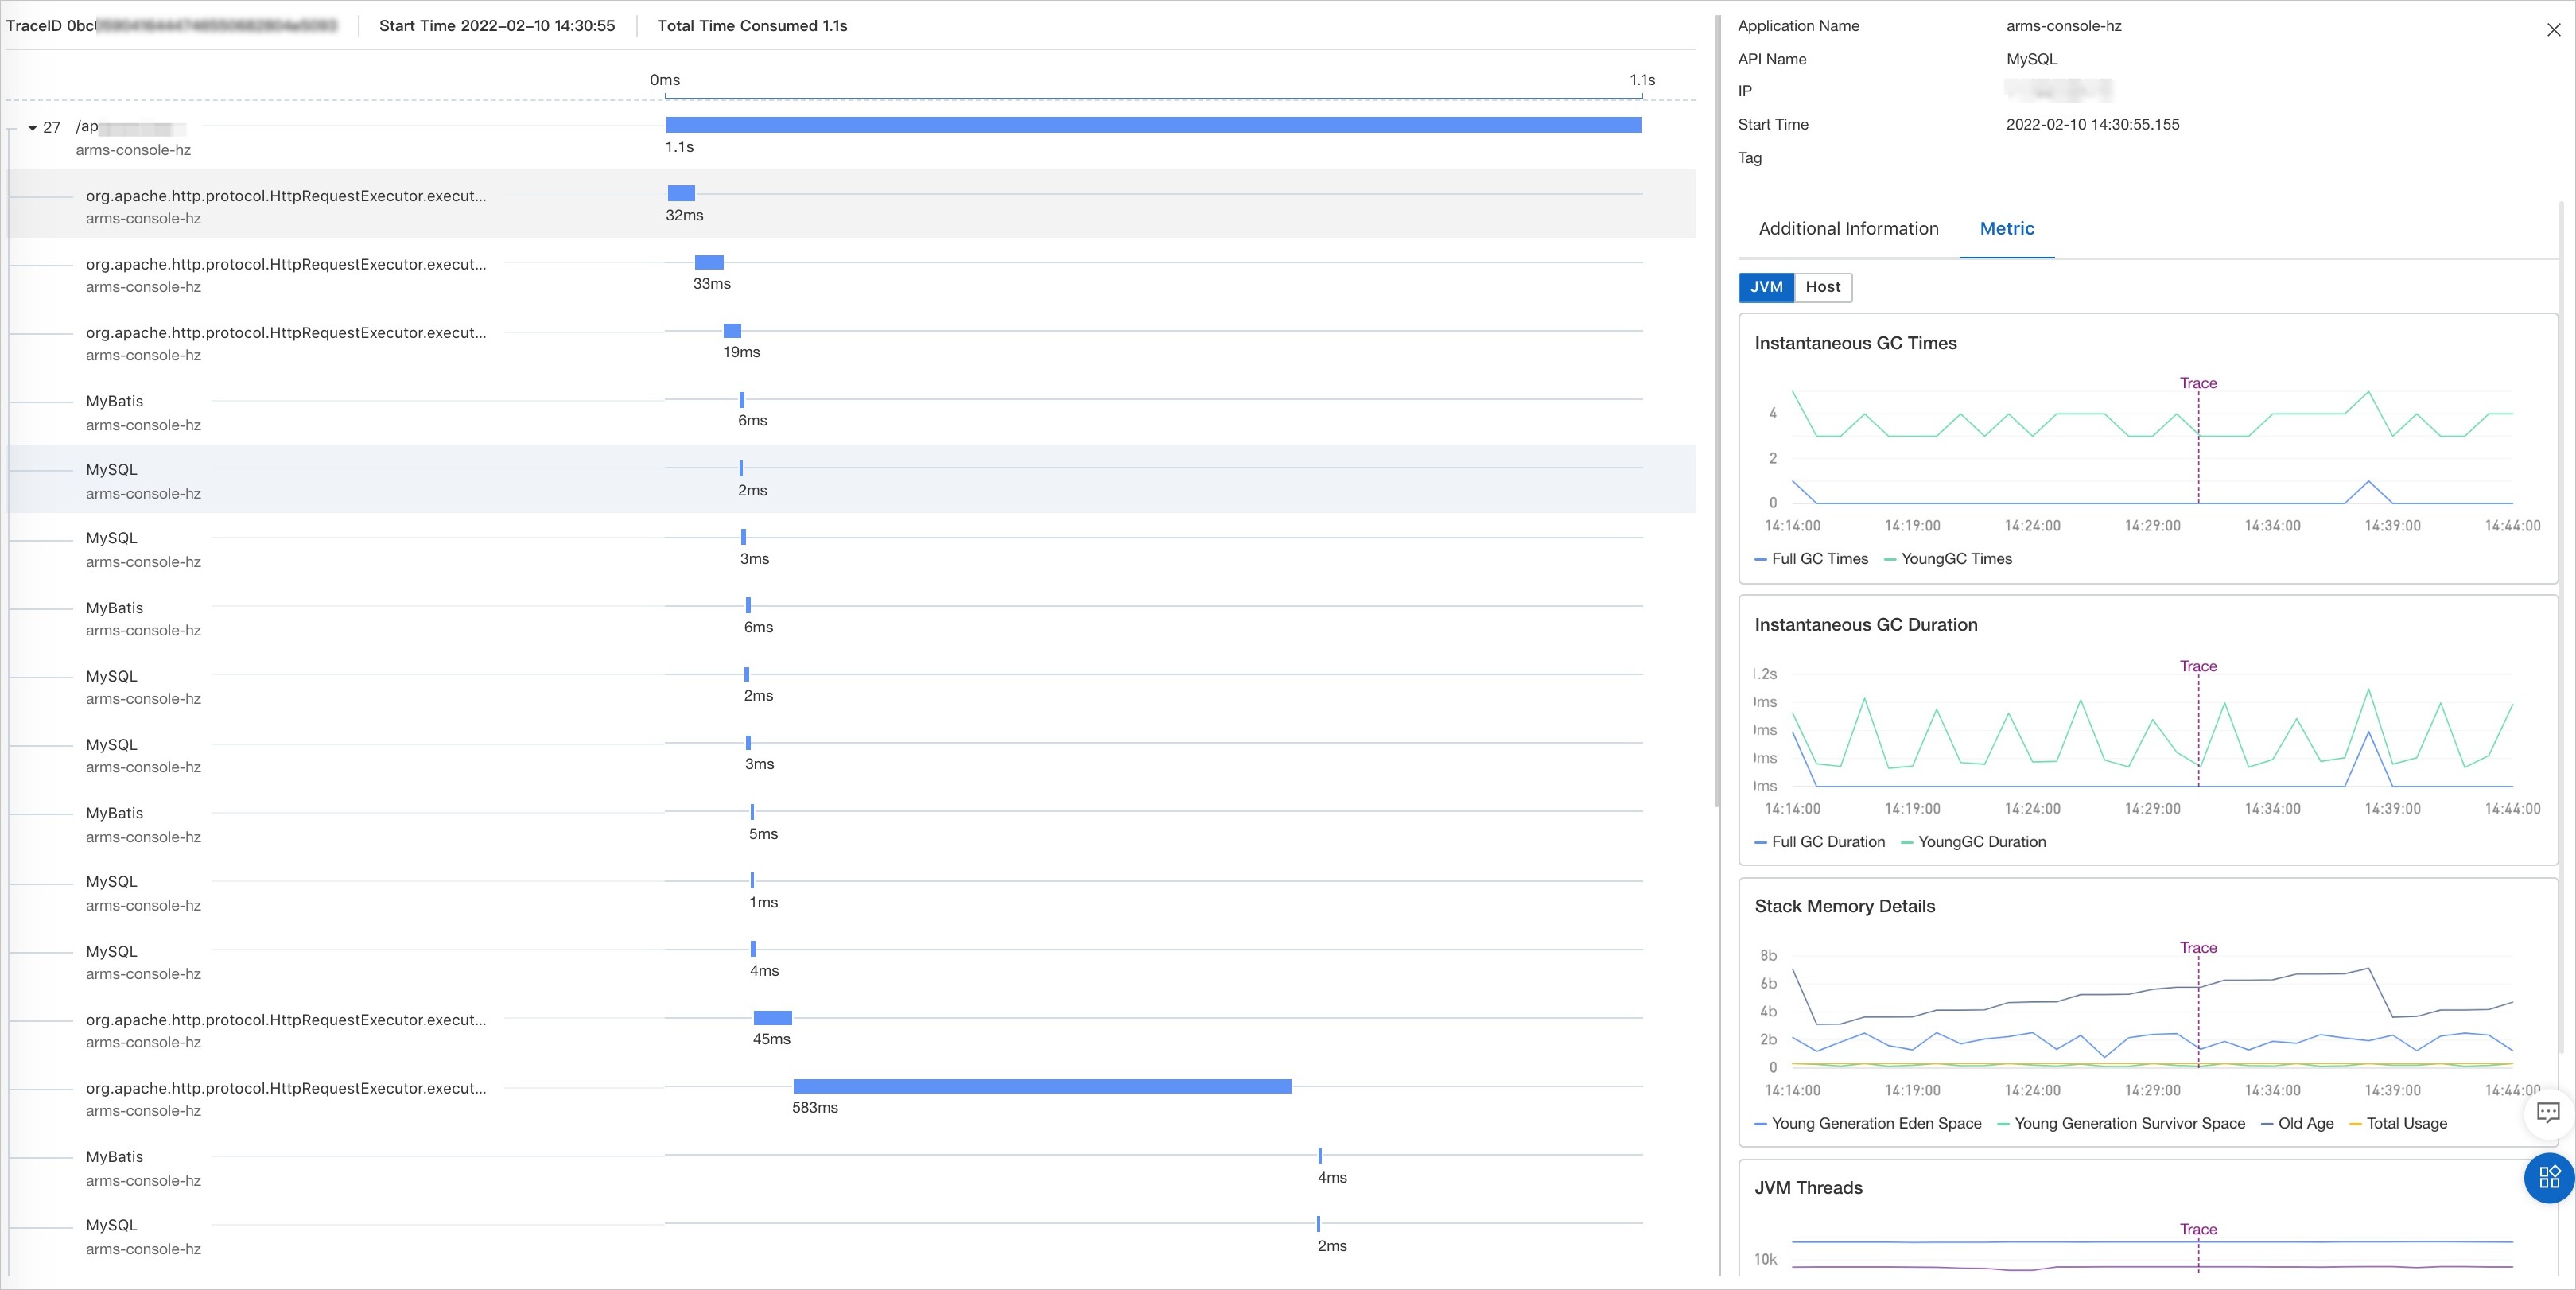
Trace details
The left side of the trace details panel shows the call sequence and latency of APIs in the trace. The right side displays detailed context and related metrics, such as database SQL, JVM metrics, and host metrics.
-
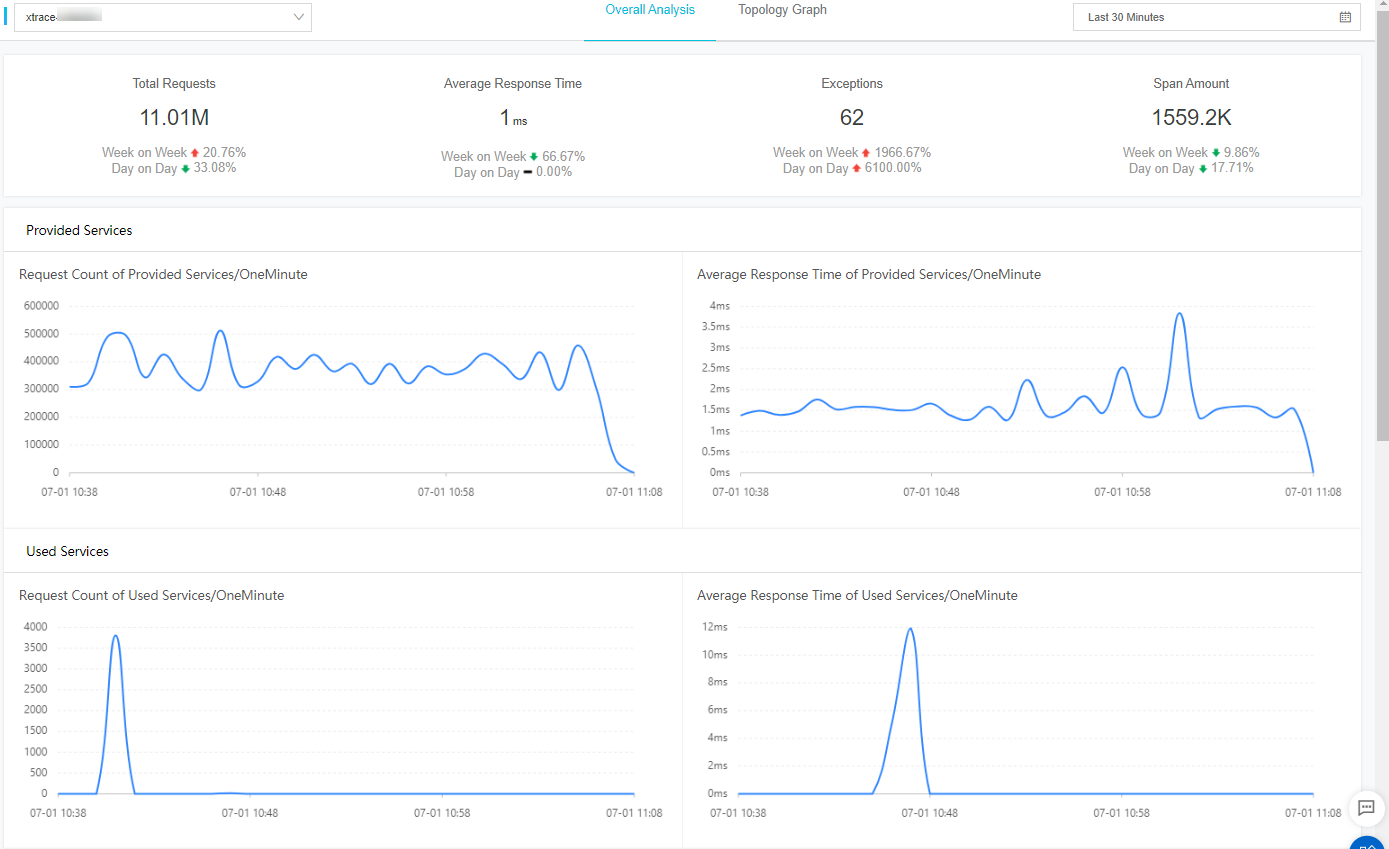
Pre-aggregated metric dashboards
ARMS provides various pre-aggregated metric dashboards based on OpenTelemetry trace data, including dashboards for application overview, API calls, and database calls. For more information, see Application overview.
-
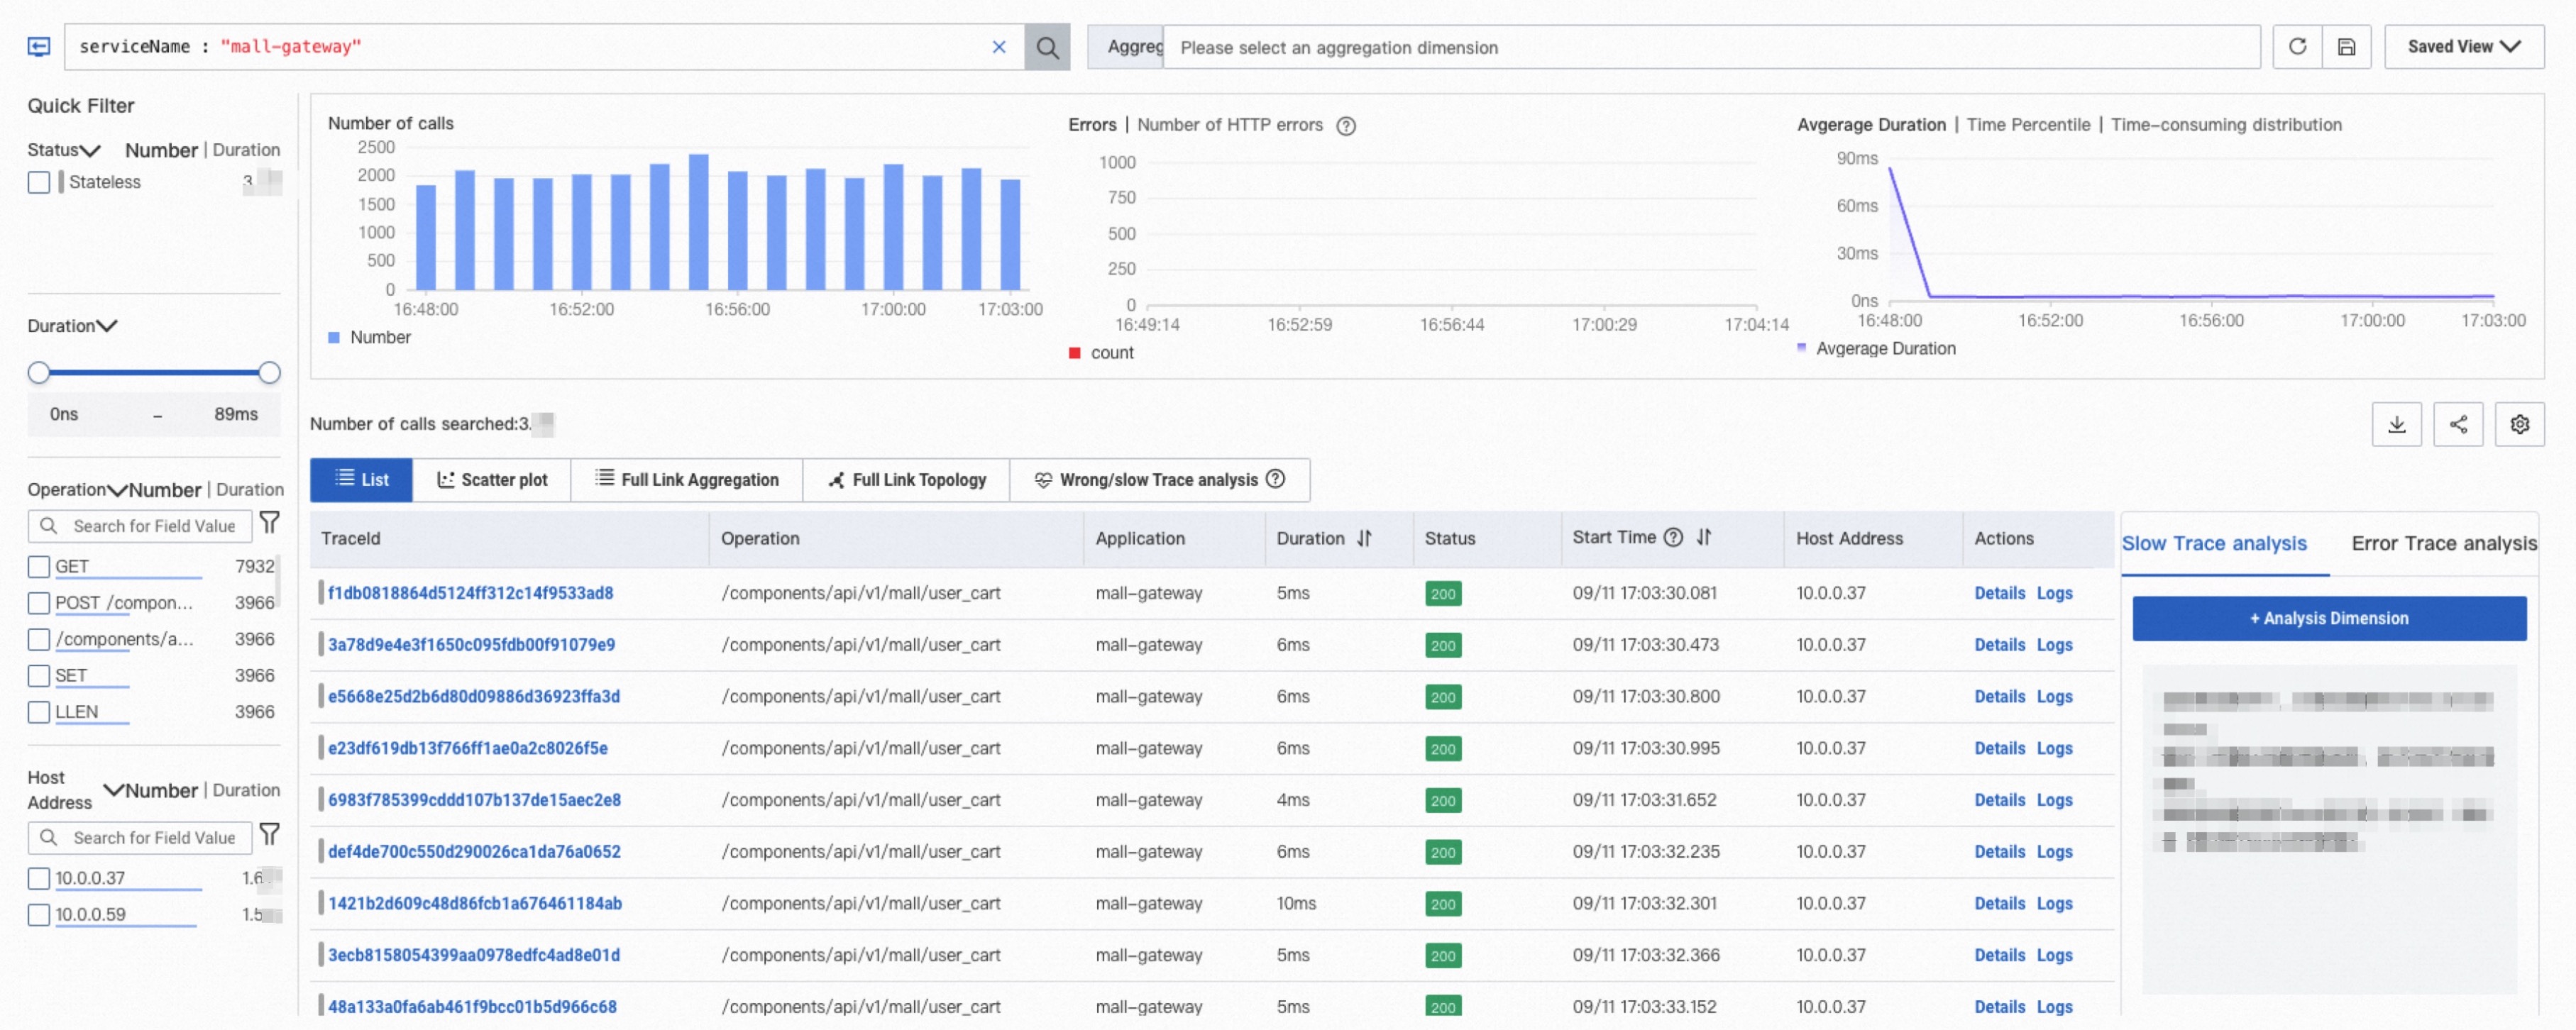
Post-aggregated metric analysis in Trace Explorer
ARMS offers flexible multi-dimensional filtering and post-aggregated metric analysis for OpenTelemetry trace data. For example, you can query for abnormal traces in a specific application or aggregate trace data by dimensions such as IP address and API. For more information, see Trace Explorer.
-
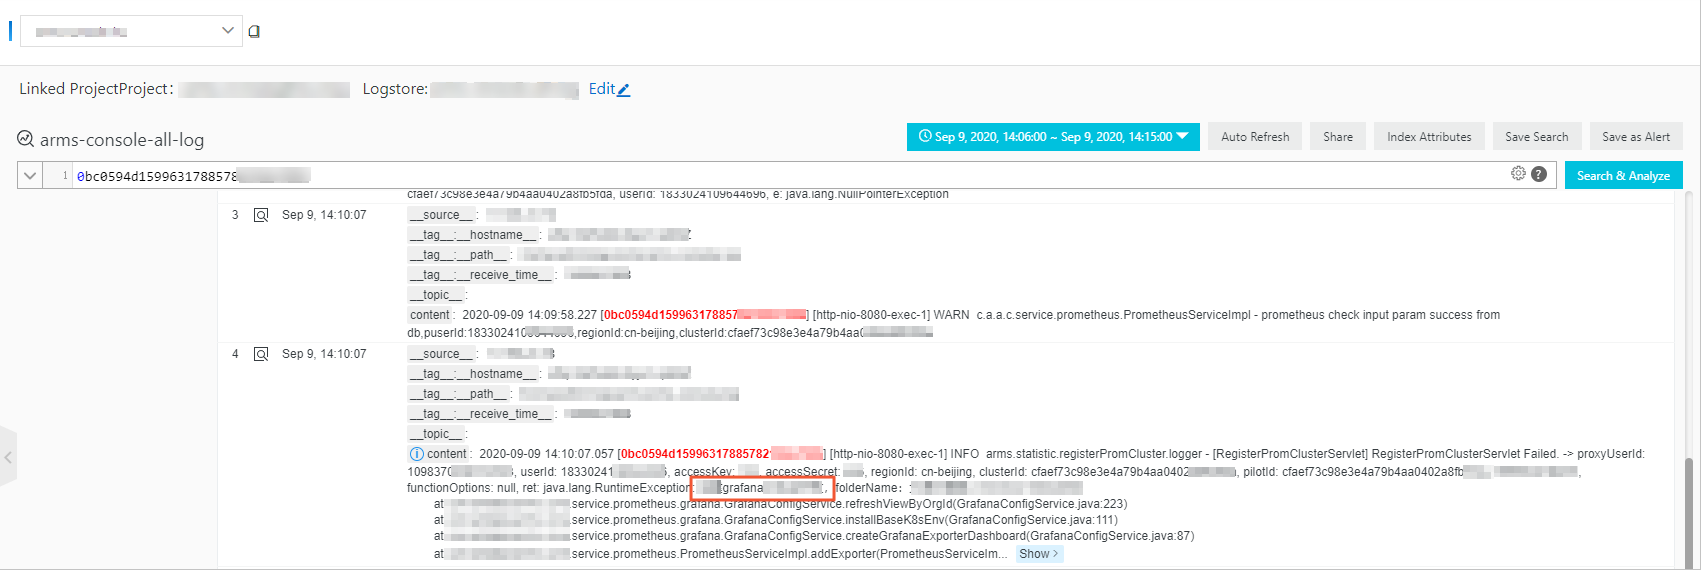
Correlate traces with service logs
ARMS correlates OpenTelemetry traces with service logs to help you troubleshoot service exceptions from the API perspective. For more information, see Identify service exceptions using traces and logs.