By Wang Tao, Fang Xiu and Zhong Min
Once an AI coding Agent starts executing real tasks, the question is often no longer "Did it finish?" but rather: Why did this turn take 47 seconds? Was the bottleneck in the model or the tools? How many retries occurred after a failure? Did the Token consumption come from the main Agent or a Subagent?
DeepSeek Harness (hereafter DSH) already retains comprehensive Session logs. However, to answer questions about execution time, call relationships, and costs, the events must also be organized into Traces and Metrics to reveal the full picture.
To collect comprehensive observability data for DSH, the Alibaba Cloud observability team has built two open-source observability approaches for DSH on top of the open-source LoongSuite: one is the independently installable plugin available from the DSH plugin marketplace, @loongsuite/dsh-plugin; the other is the DSH integration built into LoongSuite Pilot. Both use OpenTelemetry GenAI semantics and can send data to a compatible backend of the user's choice, but their deployment models and use cases differ.
This article presents a practical approach to comprehensive observability for DeepSeek Harness.
DeepSeek Harness is an open-source coding Agent runtime from DeepSeek. The model handles generation, while the Harness maintains sessions, orchestrates the ReAct loop, executes tool calls, manages permissions and sandboxes, and spawns Subagents when needed.
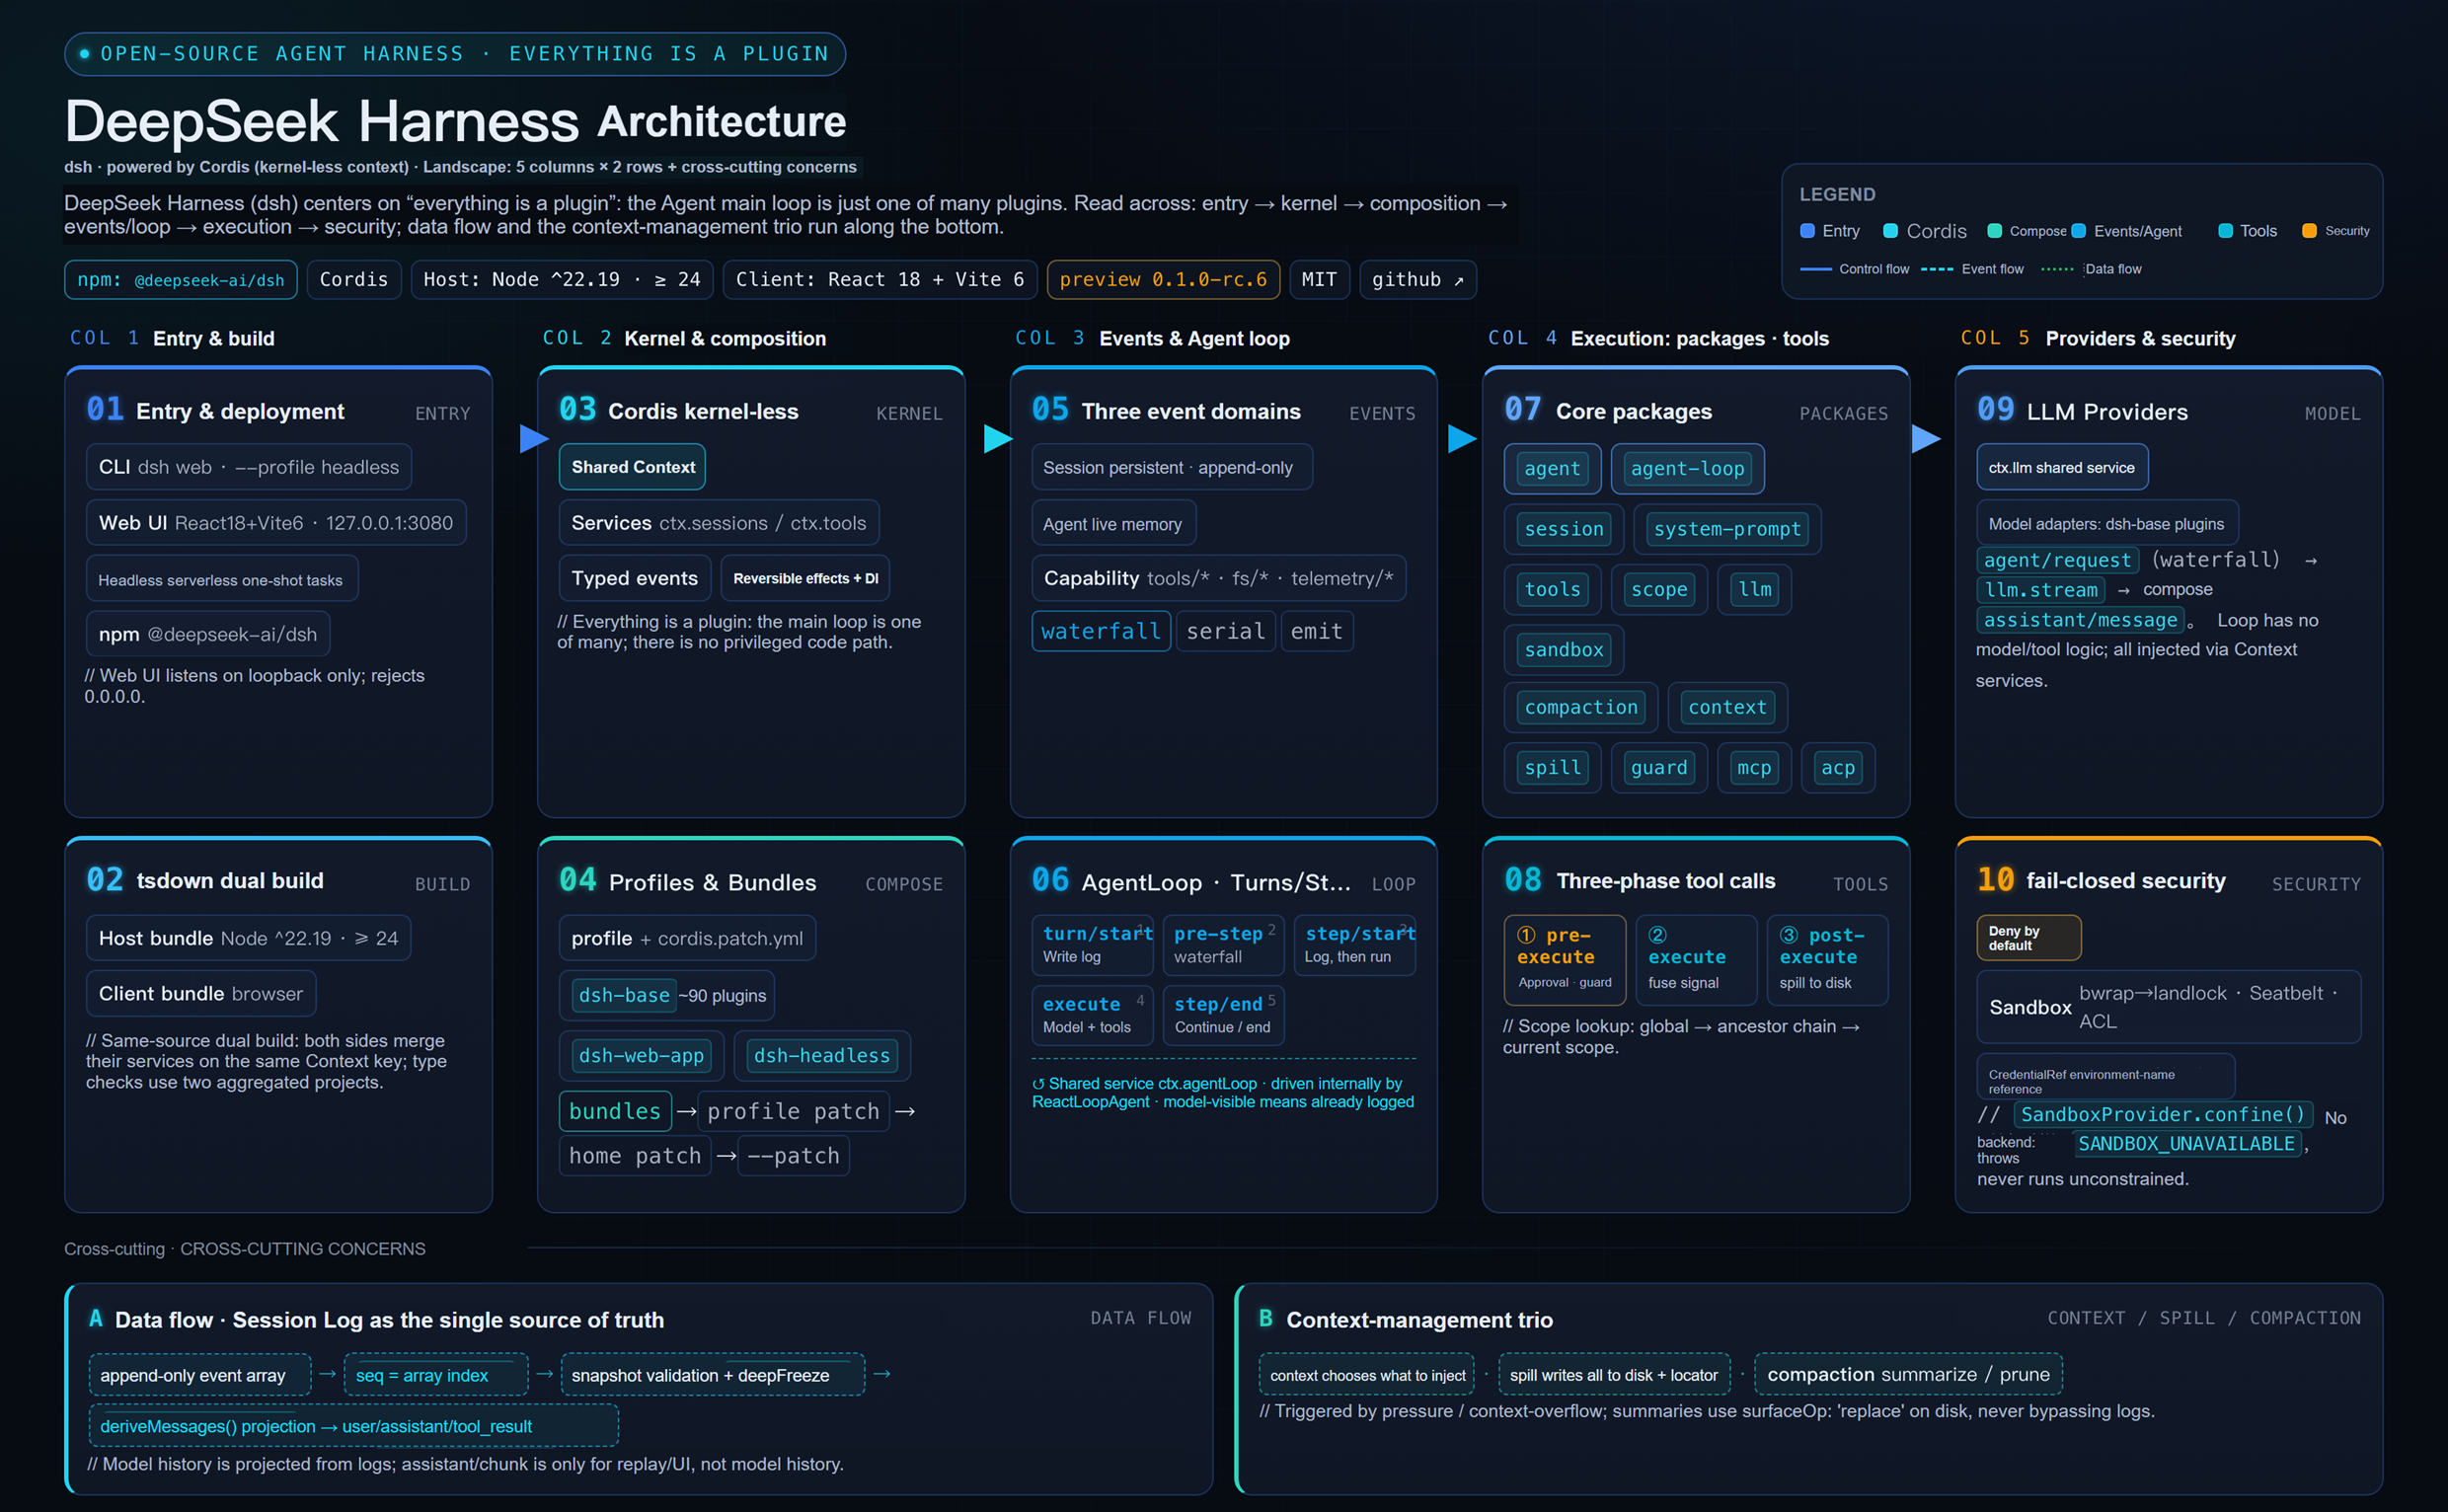
DSH is distributed as the npm package @deepseek-ai/dsh, with the command-line entry point dsh. The official package includes two Profile templates, Web and headless, and also allows users to install and combine custom Profiles, such as third-party terminal interfaces. Web listens by default on 127.0.0.1:3080.
Its plugin system is built on Cordis, with configuration composed from multiple layers of patches. User-level configuration supports hot updates, allowing plugins to subscribe to native lifecycle events and add new data outputs without intruding into the Agent's main loop.
DSH also retains an append-only Session event stream containing Turns, Steps, tool calls, model messages, and streaming deltas. The official package additionally provides an OTLP Logs plugin that is disabled by default. These logs are well suited to auditing, replay, and fact-based investigation, but logs and Traces/Metrics address different types of questions.
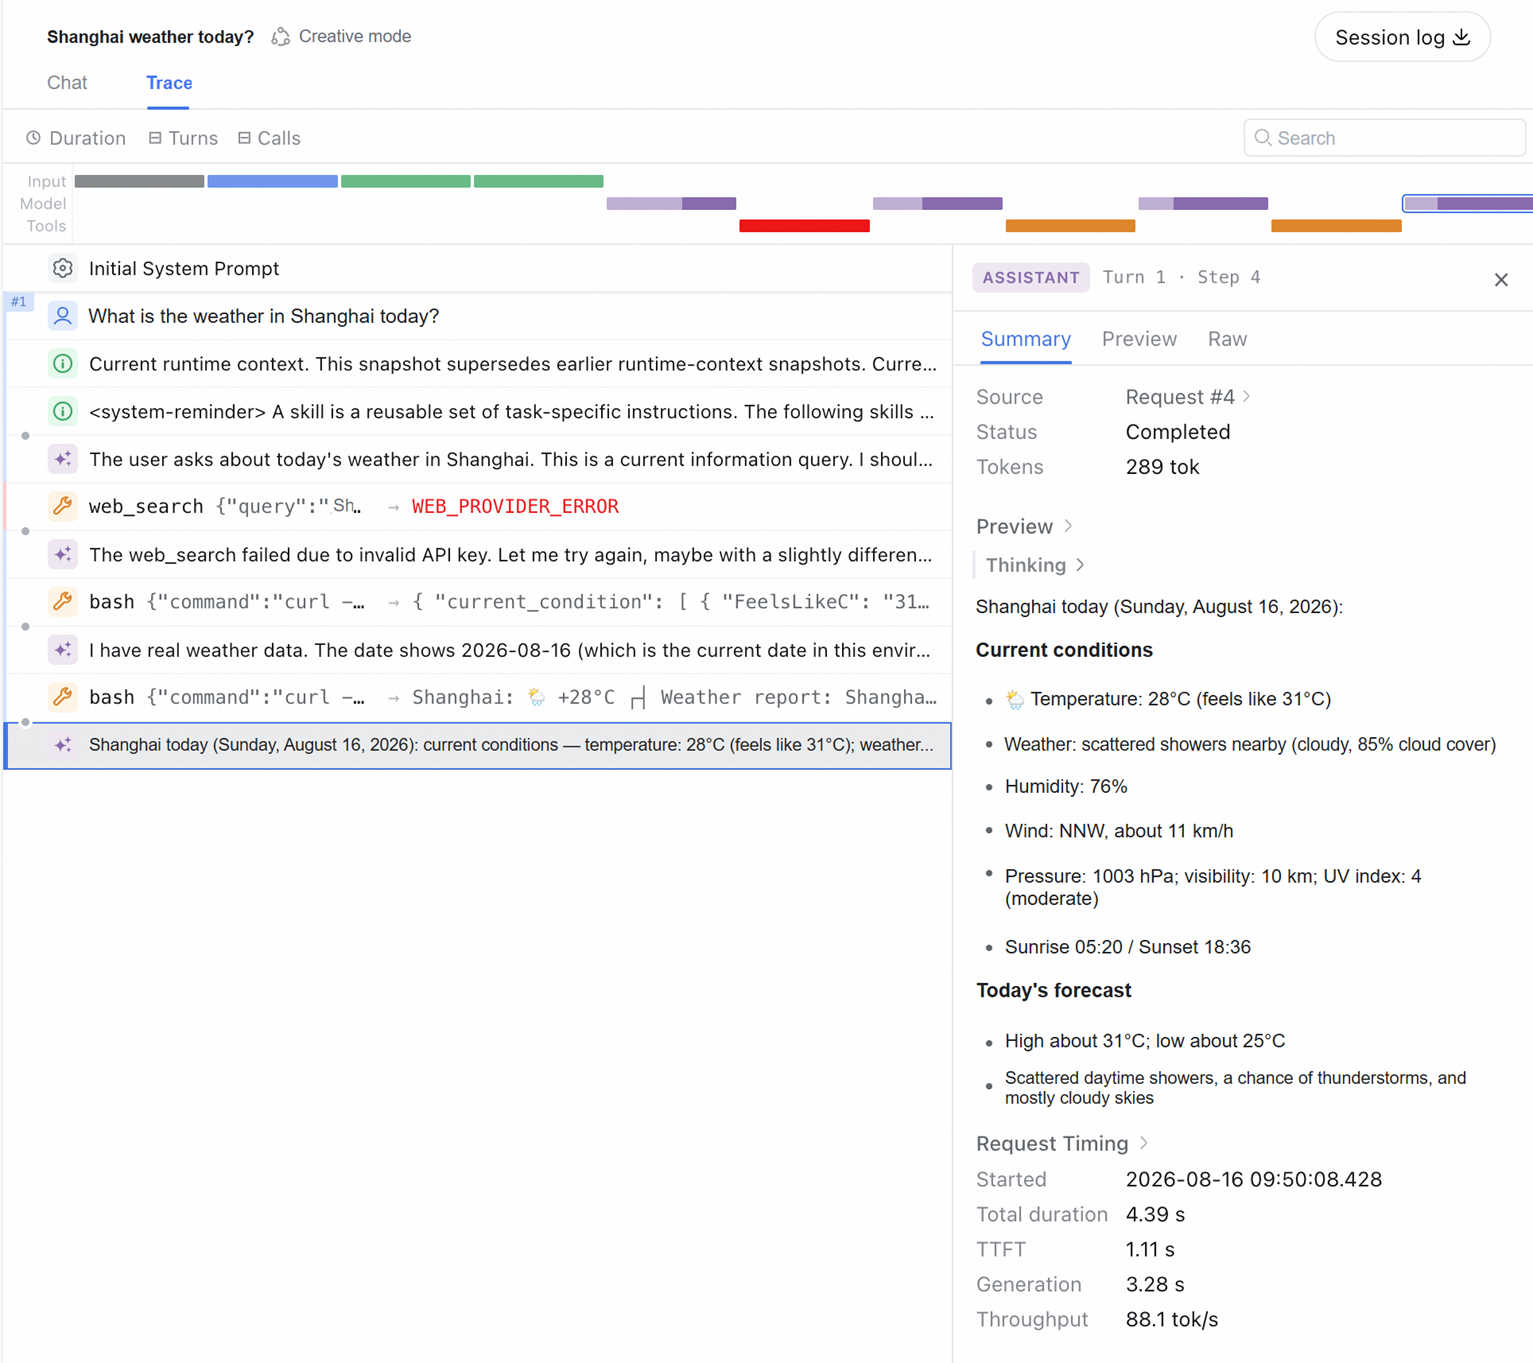
Logs are a chronological sequence of facts, whereas a Trace is a call tree with parent-child relationships and time intervals.
Logs alone tell us "what happened"; Traces make it easier to directly answer the following questions:
Logs and Traces are therefore complementary rather than alternatives: logs preserve a complete event ledger, while Traces provide a structured projection suitable for performance, error, and cost analysis.
First, let us examine the actual data paths of the two approaches.
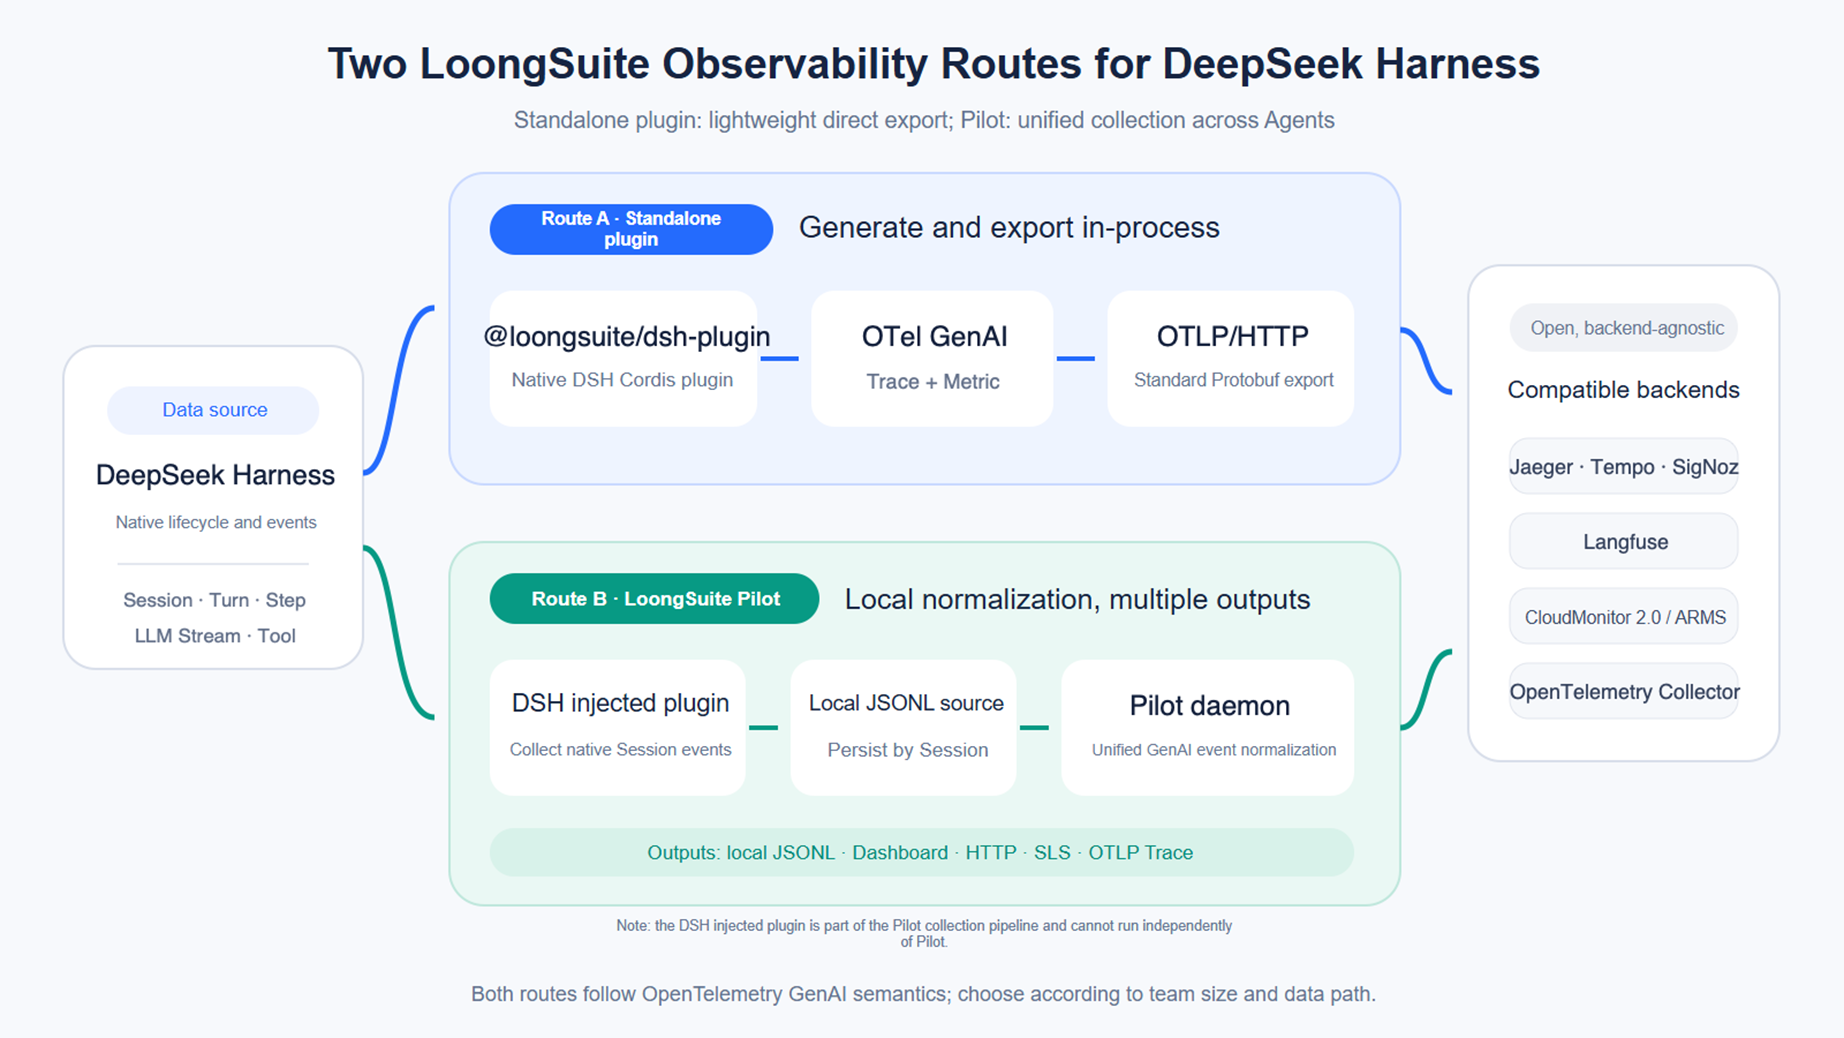
Both approaches follow the same OpenTelemetry GenAI semantics, but differ in their collection points, data paths, and use cases.
One distinction is easy to overlook: the DSH plugin in Pilot is part of Pilot's collection pipeline. It writes native DSH events to local storage and passes them to the daemon for further processing. It is not another marketplace plugin that can be installed independently of Pilot and send OTLP data directly.
| LoongSuite Pilot | dsh-plugin | |
|---|---|---|
| Runtime model | Plugin injected into DSH + local daemon process | Standalone Cordis plugin within the DSH process |
| Coverage | Unified observability across approximately 20 mainstream Agent integrations | DSH only |
| Where Traces are generated | Generated by the daemon after normalizing native events | Generated directly within the DSH process |
| Data outputs | Local JSONL, HTTP, SLS, OTLP Trace | OTLP Trace and Metric |
| Local storage | Retains local data and provides a Dashboard by default | Does not require events to be written to local storage |
| Content policy | Output policies should be explicitly configured; native source logs must still be protected as sensitive data | Span content capture is disabled by default |
| Suitable scenarios | Multiple Agents on one machine requiring a unified ledger, auditing, and team-wide views | DSH-only usage with an existing OTLP backend and a need for the most lightweight integration |
| Repository | alibaba/loongsuite-pilot | loongsuite/dsh-plugin |
@loongsuite/dsh-plugin has released stable version 0.1.0 and has been listed in the DSH community plugin marketplace. The current version supports DSH >=0.1.0-rc.6 <0.2.0 and requires Node.js >=22.19.0.
DSH plugins are installed per Profile. To observe the Web Profile:
dsh plugin --profile web add @loongsuite/dsh-pluginTo also observe headless tasks, install the plugin in the corresponding Profile as well:
dsh plugin --profile headless add @loongsuite/dsh-pluginThe minimum configuration requires only a standard OTLP endpoint and a service name:
export OTEL_SERVICE_NAME=dsh-agent
export OTEL_EXPORTER_OTLP_ENDPOINT=http://localhost:4318
dsh --profile web
The shared endpoint is automatically extended with /v1/traces and /v1/metrics. If the backend accepts only Traces, Metric export can be disabled:
OTEL_METRICS_EXPORTER=none dsh --profile webThe plugin listens directly to DSH's lifecycle events for Session, Turn, Step, llm/stream, and Tool, and builds an in-process ENTRY → AGENT → STEP → LLM / TOOL call tree. Each actual model call corresponds to a separate LLM Span, so failures and retries within the same Step are not merged.
Langfuse accepts OTLP Traces, but does not accept OTLP Metrics. You can explicitly specify the full Trace endpoint in $DSH_HOME/profiles/<profile>/cordis.patch.yml as follows:
- id: loongsuite-observability
  config:
    traceEndpoint: https://cloud.langfuse.com/api/public/otel/v1/traces
    serviceName: dsh-agent
    headers:
      Authorization: "Basic <Base64(public_key:secret_key)>"
      x-langfuse-ingestion-version: "4"
    captureContent: false
    exportMetrics: false
For self-hosted Langfuse, simply replace the domain name. The authentication value is the Base64 encoding of public_key:secret_key; do not commit actual keys to the repository.
CloudMonitor 2.0 - Integration Center - Application Monitoring & Tracing - OpenTelemetry
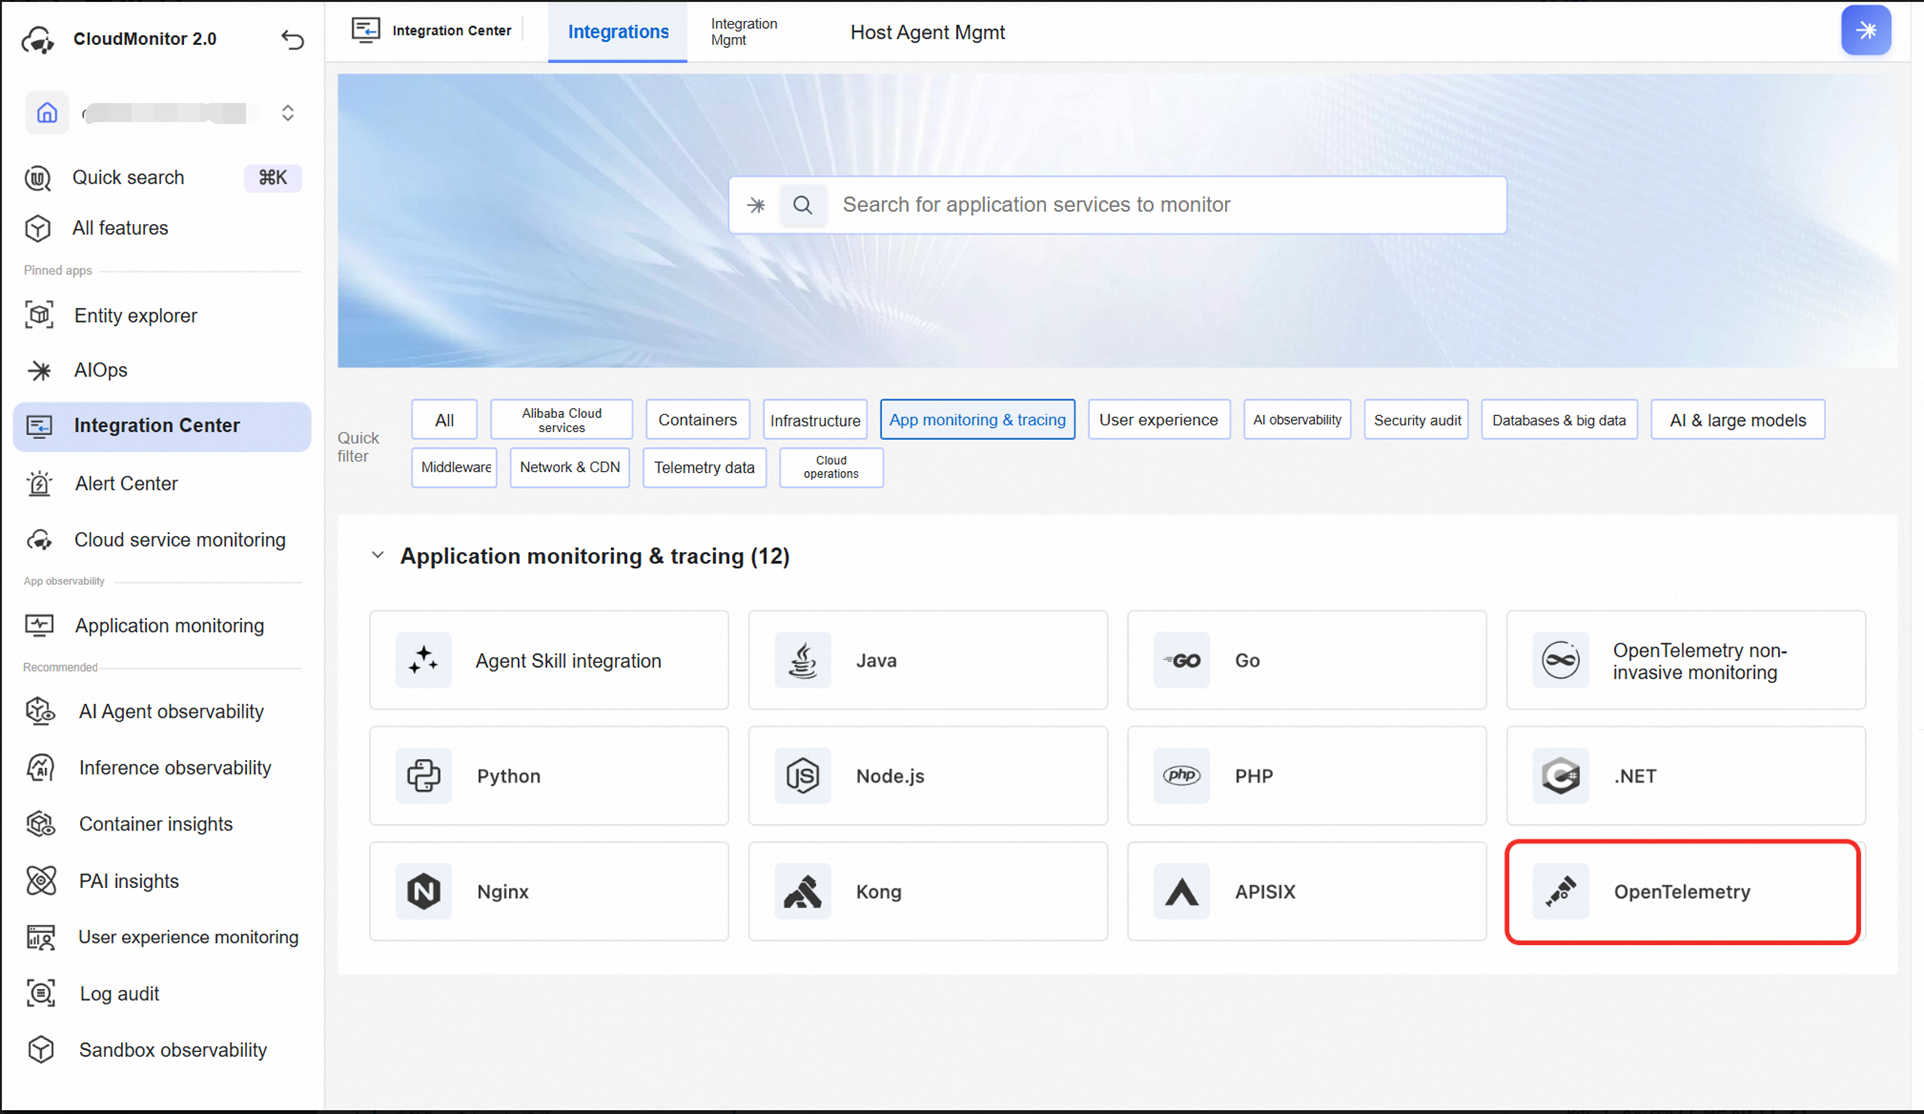
Click to obtain the LicenseKey, enter the application name, and select the public network and HTTP.
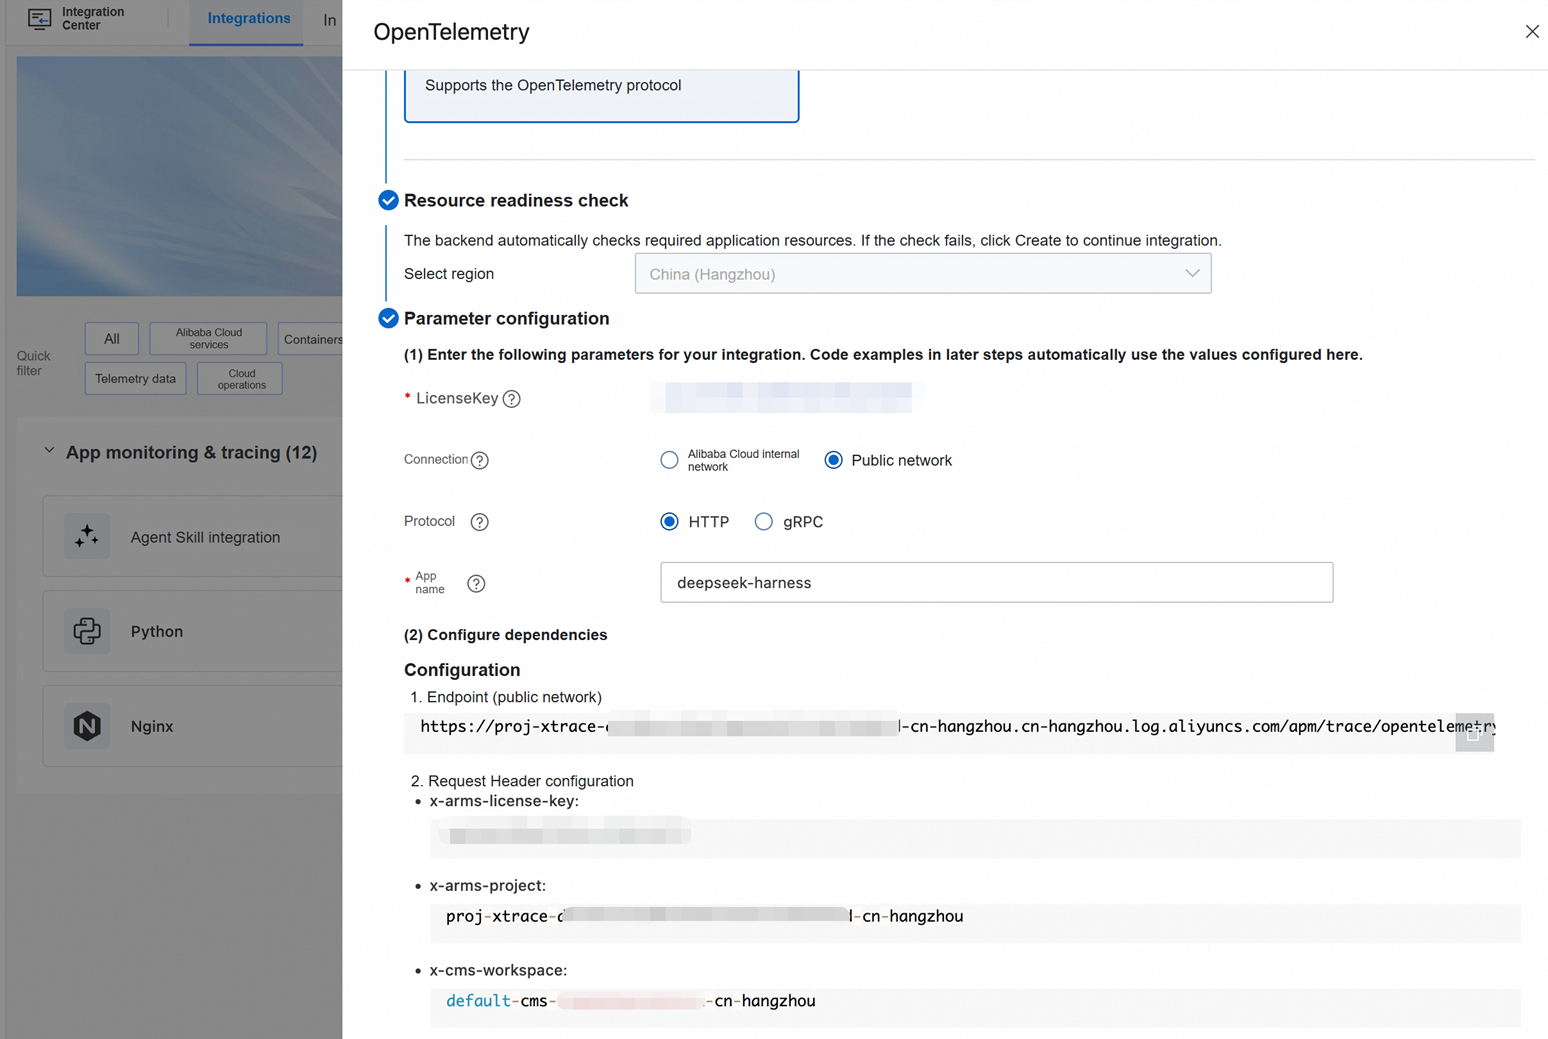
Then configure the following:
- id: loongsuite-observability
  config:
    endpoint: https://<project>.<region>.log.aliyuncs.com/apm/trace/opentelemetry
    serviceName: dsh-agent
    headers:
      x-arms-license-key: <License Key>
      x-arms-project: <ARMS Project>
      x-cms-workspace: <Cloud Monitor Workspace>
    resourceAttributes:
      acs.arms.service.feature: genai_app
    captureContent: false
exportMetrics: true| Value | Purpose | Where to obtain it |
|---|---|---|
| OTLP ingestion endpoint | endpoint |
The ingestion endpoint in the CloudMonitor console, in the form https://<project>.<region>.log.aliyuncs.com/apm/trace/opentelemetry
|
| licenseKey | x-arms-license-key |
CloudMonitor console → Integration Center; click to obtain it |
| project | x-arms-project |
The URL hostname above identifies it through its first component (proj-xtrace-xxxxx-<region>) |
| workspace | x-cms-workspace |
In the form default-cms-<primary-account-id>-<region>
|
Enter the OTLP base endpoint without a Signal path. The plugin automatically generates the Trace export path
/v1/tracesand the Metric export path/v1/metrics. CloudMonitor 2.0 supports receiving Traces and Metrics over HTTP/Protobuf, so keepexportMetrics: truehere.
| Configuration option | Default value | Function |
|---|---|---|
enabled |
true | Stops collection directly without uninstalling the plugin |
endpoint |
Not set | OTLP/HTTP base endpoint; automatically appends the signal path |
traceEndpoint / metricEndpoint
|
Not set | Full endpoint for a single signal; takes precedence over endpoint
|
headers |
{} | Request headers shared by both exporters |
serviceName |
OTEL_SERVICE_NAME or deepseek-harness
|
OpenTelemetry service.name
|
resourceAttributes |
{} | Additional Resource attributes |
captureContent |
false | Whether to export prompts, responses, tool arguments, and results |
contentMaxChars |
128000 | Maximum number of characters for a single content attribute |
exportMetrics |
true | Whether to export duration and token metrics |
debug |
false | Outputs plugin lifecycle diagnostics through the DSH logger |
To validate locally first, use the repository's Jaeger Quickstart to see your first DSH Trace without registering for any cloud service.
DSH natively provides the session-telemetry-otel plugin, which exports logs to any OTel backend using native OTel. To export native session logs, you can edit ~/.dsh/cordis.patch.yml to enable export dynamically.
- id: session-telemetry-otel
  config:
    mode: FEEDBACK_ONLY
    shutdownTimeoutMillis: 5000
    exporter:
      url: 'https://<project>.<region>.log.aliyuncs.com/apm/trace/opentelemetry/v1/logs'
      compression: gzip
      timeoutMillis: 3000
      headers:
        x-arms-license-key: '<License Key>'
        x-arms-project: '<ARMS Project>'
        x-cms-workspace: '<Cloud Monitor Workspace>'
    processor:
      scheduledDelayMillis: 10000
      maxQueueSize: 2048
      # Equal to maxQueueSize so the shutdown drain is a single batch.
      maxExportBatchSize: 2048
      exportTimeoutMillis: 4000
mode |
Behavior |
|---|---|
FULL |
Each projected record (including lifecycle ops records) is immediately passed to the OTel SDK for export. Only this mode accepts direct calls to ctx.sessionTelemetry.emit()
|
FEEDBACK_ONLY |
No export occurs during normal operation. Whenever a feedback/record event is triggered, the "suffix of the canonical session log" is replayed, projected, sanitized, and exported. Subsequent records wait for the next feedback event; otherwise, they remain local. |
DISABLED |
Default value. No coordinator / provider / processor / exporter is constructed, and no records leave the process. On receiving feedback/record, it only logs that telemetry is disabled and the feedback is retained locally. |
Note: Native DSH log export is disabled by default. The example uses mode: FEEDBACK_ONLY: no export occurs during normal operation; only when feedback/record is triggered is the corresponding log suffix replayed and exported. Switching to mode: FULL continuously exports complete Session events, which may contain sensitive information such as user input, model output, and tool arguments. Enable this only after confirming the data security boundaries, and protect the ingestion credentials appropriately.
LoongSuite Pilot is a unified Agent observability collector that runs locally. It discovers installed Agents, deploys the corresponding Hooks, plugins, or data readers for different products, and normalizes their various formats into a unified set of GenAI events.
It is usable immediately after installation, even without configuring a remote backend: Pilot writes normalized events to local JSONL by default and provides a local Dashboard for viewing Token usage, sessions, models, tools, and repository activity across multiple Agents.
curl -fsSL https://loongcollector-community-edition.oss-cn-shanghai.aliyuncs.com/loongsuite-pilot/installer.sh \
  -o /tmp/loongsuite-pilot-installer.sh
bash /tmp/loongsuite-pilot-installer.sh install

loongsuite-pilot status
loongsuite-pilot info
After detecting DSH, Pilot adds a configuration block with ownership markers to $DSH_HOME/cordis.patch.yml (by default, ~/.dsh/cordis.patch.yml) to load Pilot's bundled DSH collection plugin. This operation is reversible: disabling or uninstalling Pilot removes only the portions that Pilot manages itself.
After initial enablement or reinstallation, start a new DSH process. The plugin then writes each Session's native events to Pilot's data directory, and the daemon performs normalization and output.
The value of this pipeline goes beyond obtaining DSH Traces: it brings DSH and other Agents into the same querying, cost management, and auditing framework.
Edit ~/.loongsuite-pilot/config.json:
{
  "collectTrace": true,
  "serviceName": "team-agents",
  "agents": {
    "dsh": {
      "enabled": true,
      "captureMessageContent": false
    }
  },
  "otlpTrace": {
    "endpoint": "https://cloud.langfuse.com/api/public/otel",
    "headers": {
      "Authorization": "Basic <AUTH_STRING>",
      "x-langfuse-ingestion-version": "4"
    },
    "captureMessageContent": false
  }
}
Pilot automatically appends /v1/traces to the endpoint. Here, both normalized Agent content and Trace content are disabled, making this suitable for initial integration validation using structure, duration, and Token data.
Pilot provides shorthand ARMS/CMS configuration and automatically constructs the required Headers and Resource attributes:
{
  "collectTrace": true,
  "serviceName": "team-agents",
  "agents": {
    "dsh": {
      "enabled": true,
      "captureMessageContent": false
    }
  },
  "cms": {
    "licenseKey": "<License Key>",
    "endpoint": "https://<Your Access Point>/v1/traces",
    "workspace": "<CloudMonitor Workspace >"
  }
}
otlpTrace and cms can be configured together to send the same batch of Traces to multiple backends.
In addition to Traces, Pilot can also send normalized events as logs to Alibaba Cloud SLS for centralized search, dashboards, alerting, long-term storage, and subsequent security auditing. These options can be specified during installation:
bash /tmp/loongsuite-pilot-installer.sh install \
  --sls-endpoint "https://cn-hangzhou.log.aliyuncs.com" \
  --sls-project "my-project" \
  --sls-logstore "my-logstore" \
  --sls-api-key "<API Key>"
AK mode and WebTracking mode are also supported; see the repository's docs/sls-output.md for details.
Each conversation turn forms a complete call tree
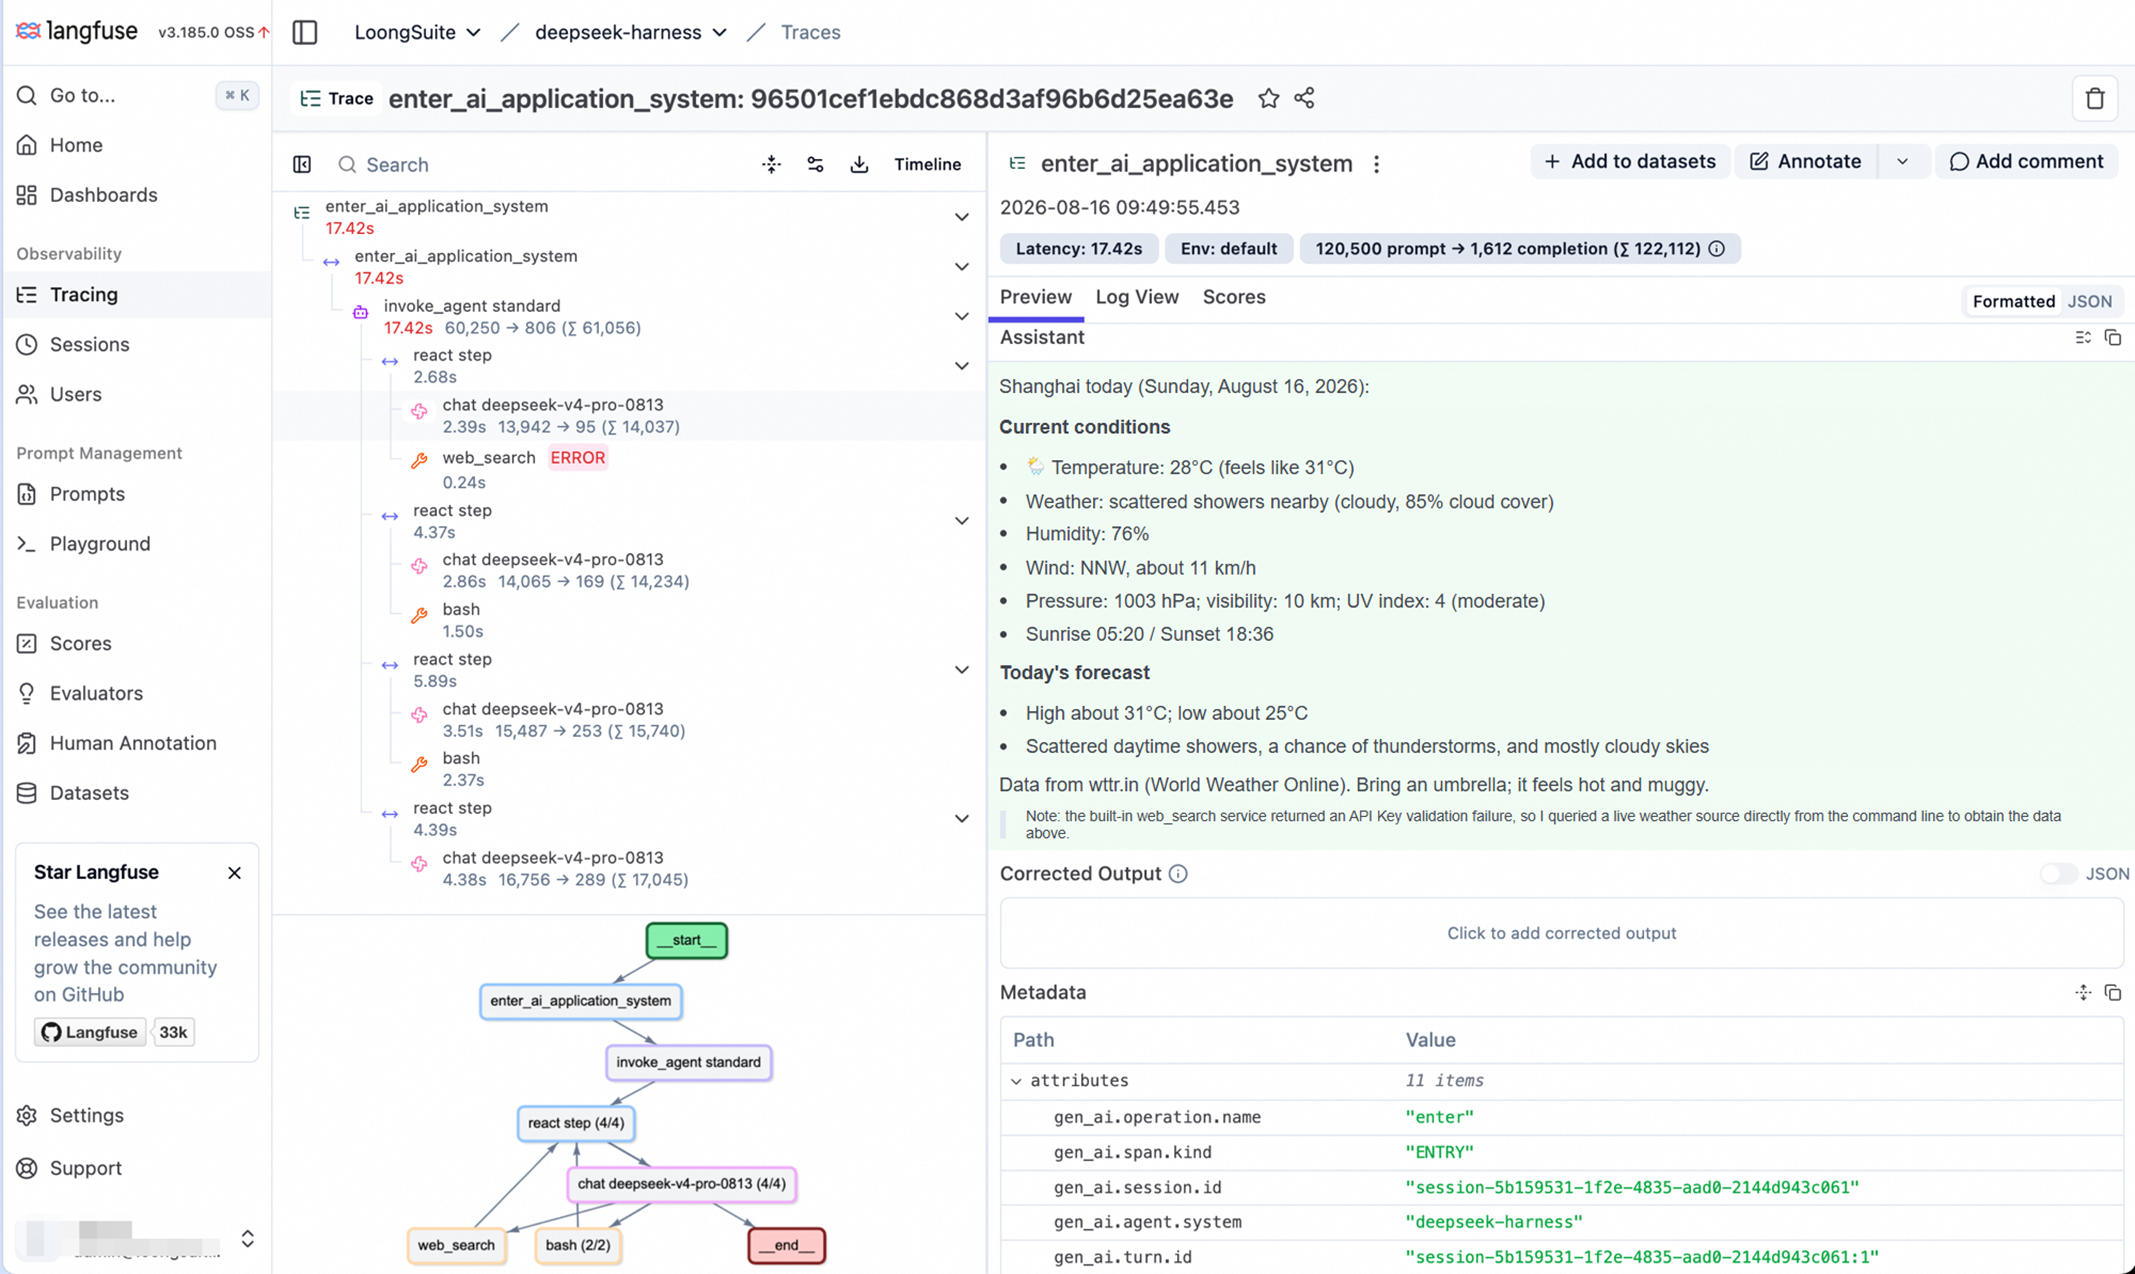
Information you can read directly:
gen_ai.response.time_to_first_token, input_tokens / output_tokens / cache_read.input_tokens are all available in the span attributes;web_search returned ERROR twice in a row, and the model switched to bash to complete the task—the error status is captured on the corresponding TOOL span, eliminating the need to search the logs;gen_ai.session.id and gen_ai.turn.id allow Langfuse's Sessions view to connect multiple turns within a session.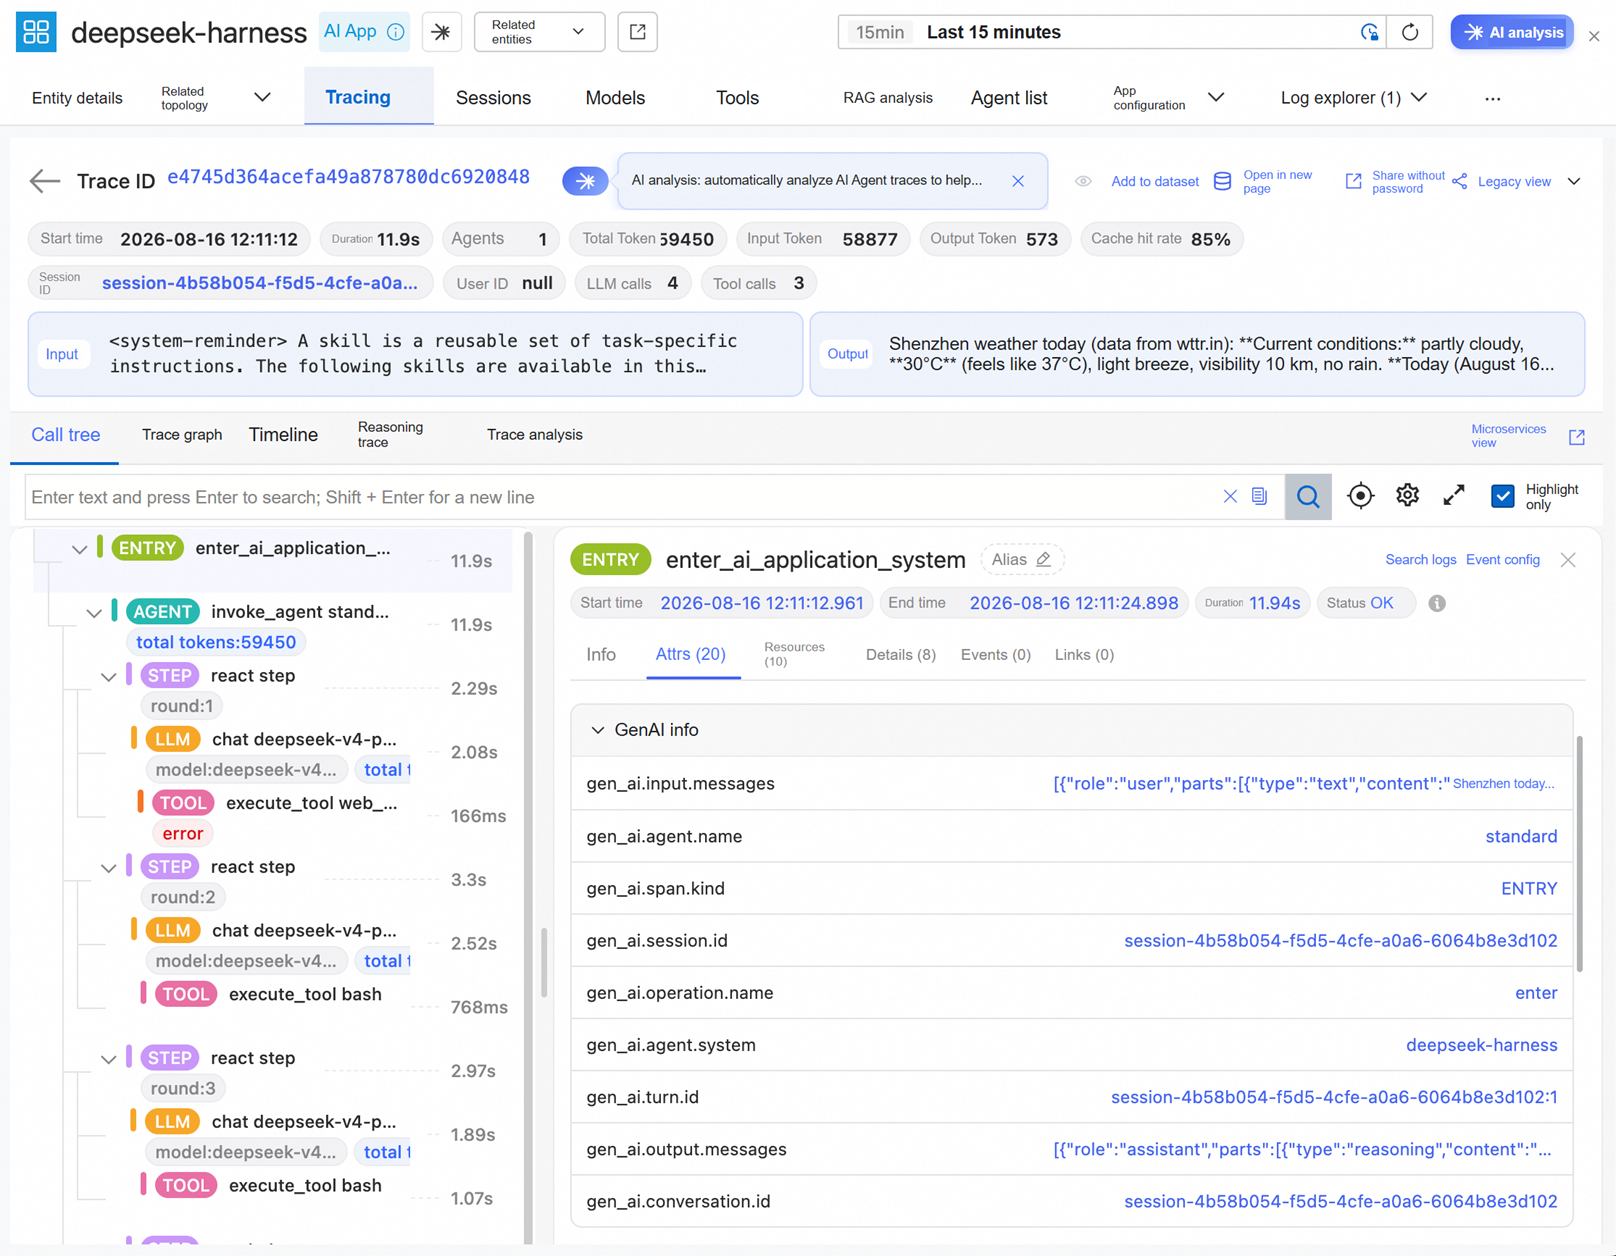
In addition to the same trace waterfall chart, several views dedicated to AI applications are available:
If Pilot collects data from multiple agents, these views provide a unified cross-agent ledger; with only the plugin installed, they provide an in-depth view of DSH as a single agent.
Both approaches support disabling content capture, but their default behavior and data paths differ. They cannot simply be described as "neither captures content."
captureContent: false overrides the process environment variables and is suitable for Profiles that must disable content capture;agents.dsh.captureMessageContent: false and otlpTrace.captureMessageContent: false;captureMessageContent controls normalized output and Traces; it does not delete the native DSH source logs that Pilot saves to perform the conversion;0700 / 0600;captureContent: false.Whichever approach you choose, before enabling content capture, determine whether the content may include source code, credentials, or personal data, and assess the backend's access controls and retention policies.
With this observability data, you can further perform security audits of DeepSeek Harness execution, evaluate and analyze its behavior, and optimize DeepSeek Harness. These topics will be covered in subsequent articles.
If you remember just one point: @loongsuite/dsh-plugin addresses "how to gain insight into DeepSeek Harness in the most lightweight and native way"; LoongSuite Pilot addresses "how to bring DSH and the other Agents on a machine into a single observability framework."
This article introduces comprehensive observability and the choice of approach. In subsequent articles, we will take a closer look at @loongsuite/dsh-plugin@0.1.0: how it builds ENTRY → AGENT → STEP → LLM / TOOL from DSH's native lifecycle events, preserves model retries, handles cached Tokens and TTFT, and sends Traces and Metrics to any OTLP-compatible backend without capturing content by default.
[1] @loongsuite/dsh-plugin: independently installed, with direct in-process OTLP export;
[2] DSH plugin marketplace page: discover and install through the marketplace;
[3] LoongSuite Pilot: unified collection across multiple Agents, a local Dashboard, and multiple data outputs;
[4] OpenTelemetry GenAI semantic conventions: an open data model and backend ecosystem.

827 posts | 61 followers
FollowAlibaba Cloud Native Community - November 12, 2026
Alibaba Cloud Native Community - November 12, 2026
Alibaba Cloud Native Community - August 20, 2026
Alibaba Cloud Native Community - November 5, 2026
Alibaba Cloud Native Community - November 10, 2026
Alibaba Container Service - April 17, 2025
827 posts | 61 followers
Follow CloudMonitor
Automate performance monitoring of all your web resources and applications in real-time
Learn More AgentLoop
An Agent self-evolution platform designed to make your Agents progressively smarter and more attuned to users.
Learn More Simple Log Service
An all-in-one service for log-type data
Learn More Application Real-Time Monitoring Service
Build business monitoring capabilities with real time response based on frontend monitoring, application monitoring, and custom business monitoring capabilities
Learn MoreMore Posts by Alibaba Cloud Native Community

