By Ruman
Ask an Agent to troubleshoot an incident, review a contract, or modify a piece of code. What users usually see is only the opening sentence and the final result. Yet during the process hidden from view, the Agent may have worked for dozens of minutes, called models and tools multiple times, read extensive context, and repeatedly retried a particular step.
After the task is complete, you may still want to know: which step consumed most of the time and Tokens? If a task is slower and uses more resources than usual, is the task itself complex, or is the context too long or the tool output excessive? High usage does not necessarily mean waste. Only by first identifying where resources are consumed can you determine whether adjustments are needed.
More and more enterprises are enabling Agents such as Codex, Claude Code, and DeepSeek Harness to access models through an AI Gateway. As the number of Agents grows, aggregate model API data can answer only "how much was used," but can hardly explain which Agent generated the usage, which task it corresponded to, or which Turn it came from.
The newly launched Agent management capability in Alibaba Cloud AI Gateway Serverless Edition breaks down usage previously aggregated by model API across individual Agents and provides corresponding intelligent insights. You can also view session usage for each Agent and drill down to specific Sessions, Turns, and model calls. In this way, time and Token consumption can be attributed to individual Agents and tasks. Based on task outcomes, you can then adjust model selection, context, or the Agent's tool-calling workflow, observe subsequent changes in usage, and continuously optimize costs.
Agents within an enterprise often come from different tools and platforms. Development teams use coding assistants, business applications integrate intelligent Q&A, and Agents may also be developed for specific tasks. Ultimately, they may share the same Model API. Looking only at the API's total request volume makes it difficult to distinguish where those calls originated.
Agent management first establishes a unified, identifiable identity for each Agent, allowing usage previously aggregated at the model API level to be attributed to individual Agents. It currently supports mainstream Agent types including Claude Code, Codex, DeepSeek Harness, Model Studio, and Dify, as well as custom Agents, making it easy to bring existing tools and applications under unified management.
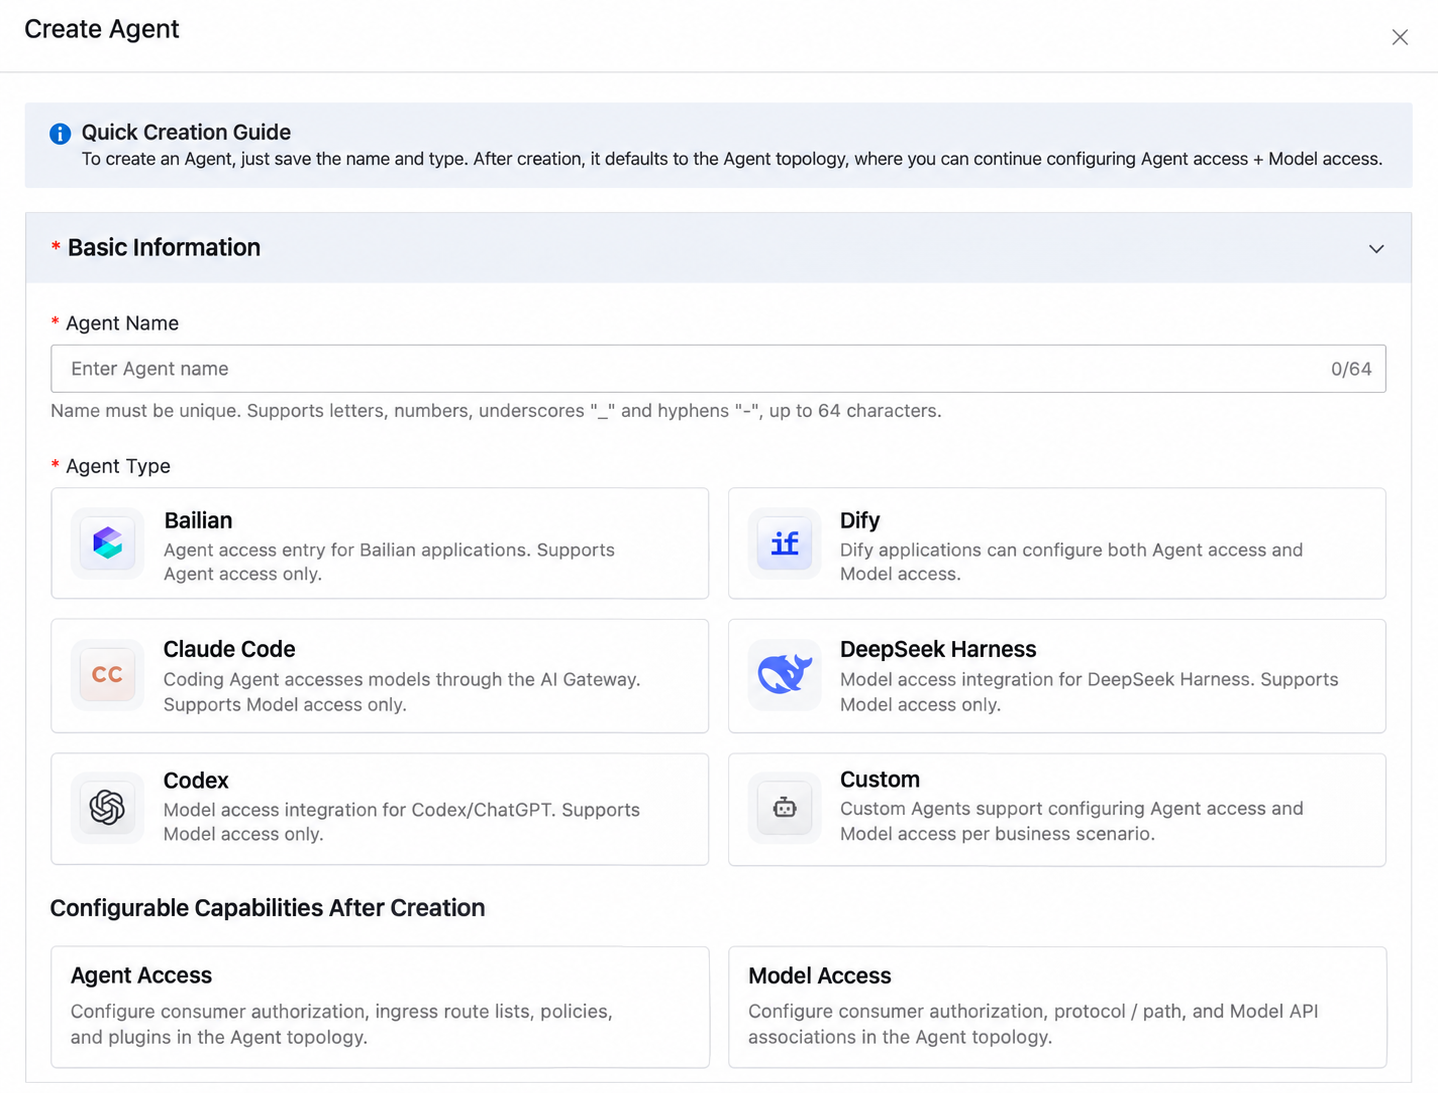
Figure 1: Support for mainstream Agent types and custom Agents
After identifying an Agent, you also need to understand its invocation relationships: which callers it serves externally, which Model APIs it uses to access models, and how the associated consumers, policies, and plug-ins are linked. Agent management presents these relationships in one place and displays the corresponding access capabilities by Agent type and configuration. When reviewing usage, you can also use these invocation relationships to determine where consumption originates, instead of seeing only aggregate model API figures.
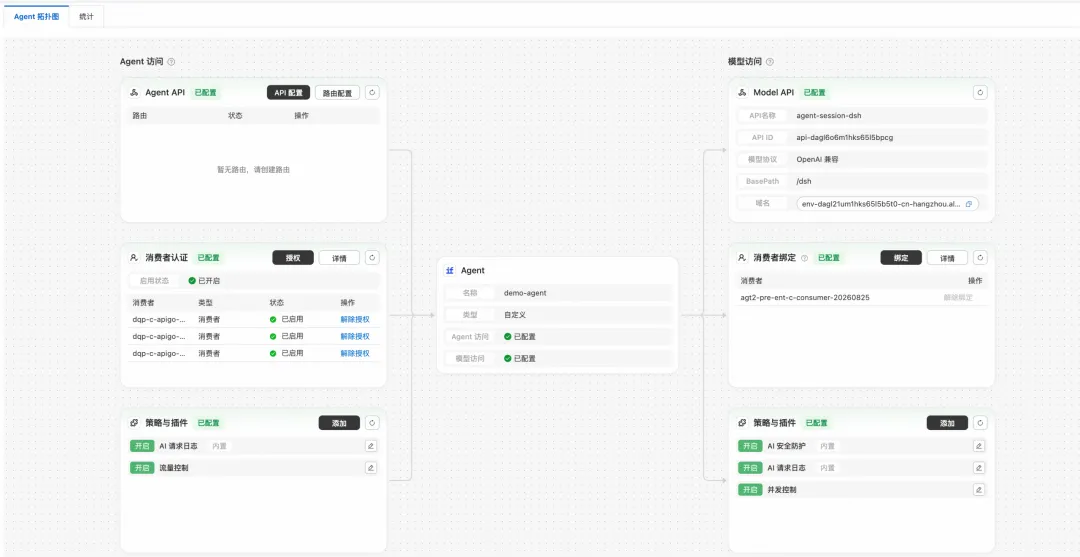
Figure 2: Agent topology showing external service and model access relationships
An Agent may process many tasks each day, call different models, and serve multiple callers. How many Tokens did it consume today in total? Which models accounted for most of the usage? Which callers used more? Was overall response performance stable? Answering these questions starts with examining the Agent's overall usage.
Agent statistics aggregate, by date, an individual Agent's number of model access requests, Token consumption, error rate, Fallback rate, and P95 latency. They also separately present breakdowns by model, consumer, Token type, and hourly trend. Both total daily usage and the distribution of consumption across different sources can be viewed in one place.
Intelligent insights summarize the day's noteworthy usage and runtime conditions: which model's share of Tokens is significantly higher than its share of requests, how much cached input accounts for, whether errors are concentrated among a particular caller, and whether a small number of slow requests extended wait times. Statistics present the overall data, while insights highlight the consumption and runtime conditions that warrant focused analysis.
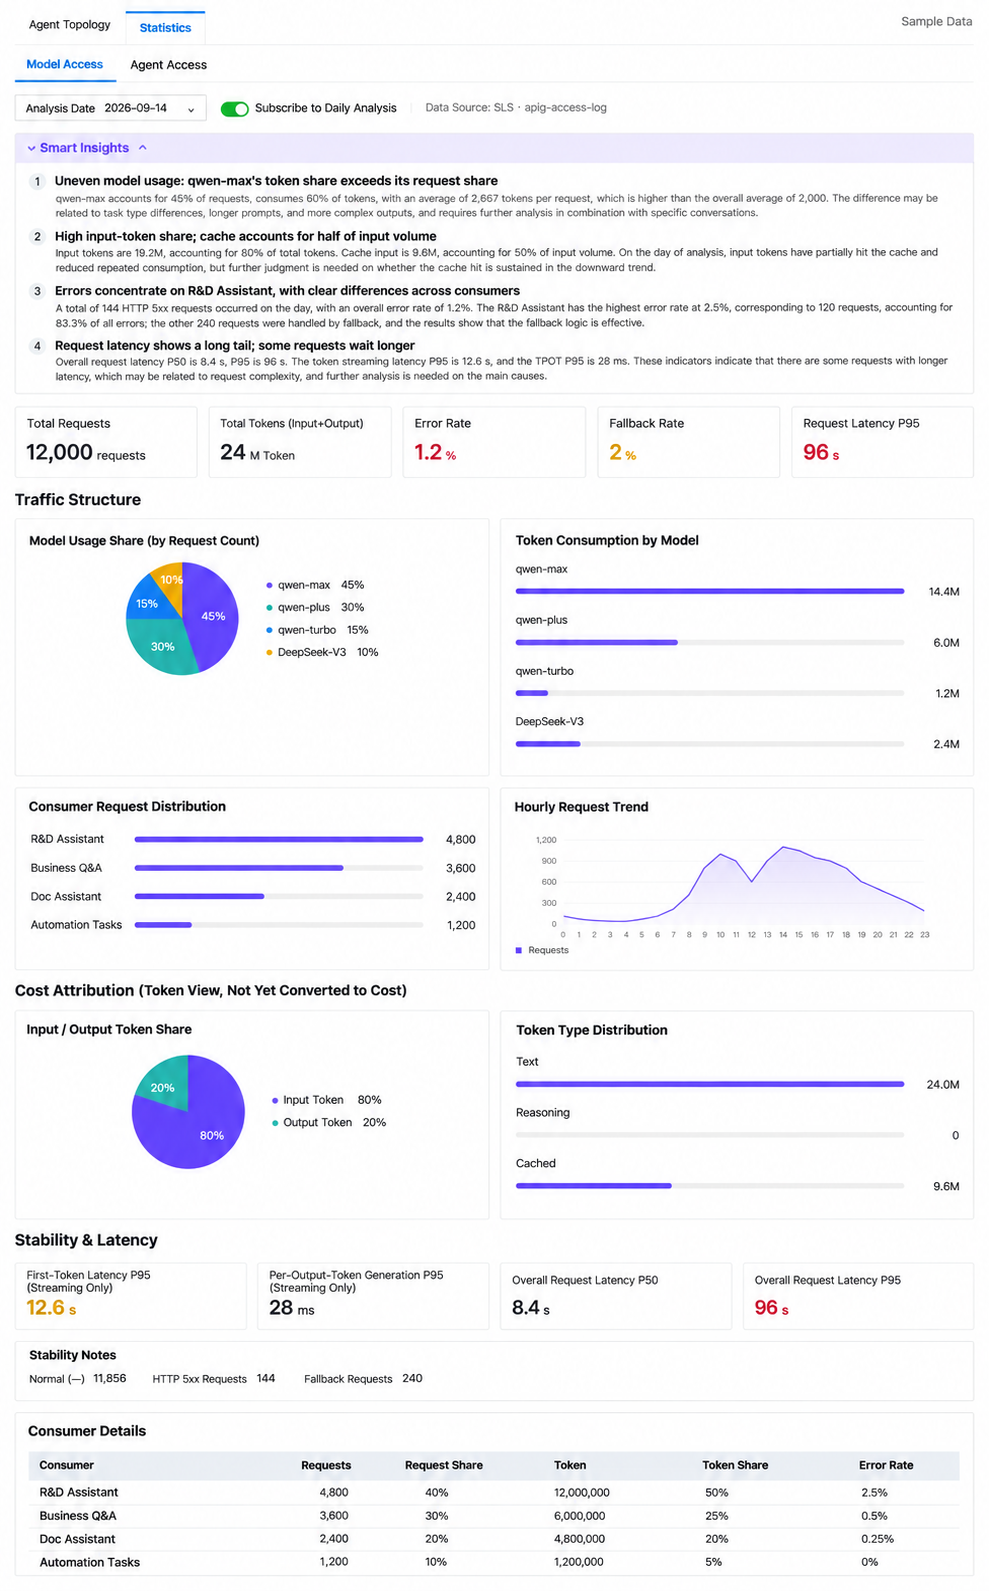
Figure 3: Overall usage statistics and daily intelligent insights for an individual Agent
After reviewing an Agent's overall statistics, you can identify the models, callers, or time periods that need attention, then drill down into sessions to determine the corresponding tasks and stages of consumption, and make targeted adjustments to models, context, and invocation workflows.
The AI Gateway's session usage statistics show both the overall usage distribution and the Tokens, duration, and results by Session, Turn, and model call.
An Agent's overall statistics can show only the distribution of consumption. To understand a task, you must examine details at three levels: Session, Turn, and Model Call. A Session is an ongoing interaction that may contain multiple rounds of dialogue; a Turn generally refers to the processing triggered by one user input; and a Model Call is a single request sent to a model within that process. During the same Turn, an Agent may call a model multiple times and execute tools between calls.
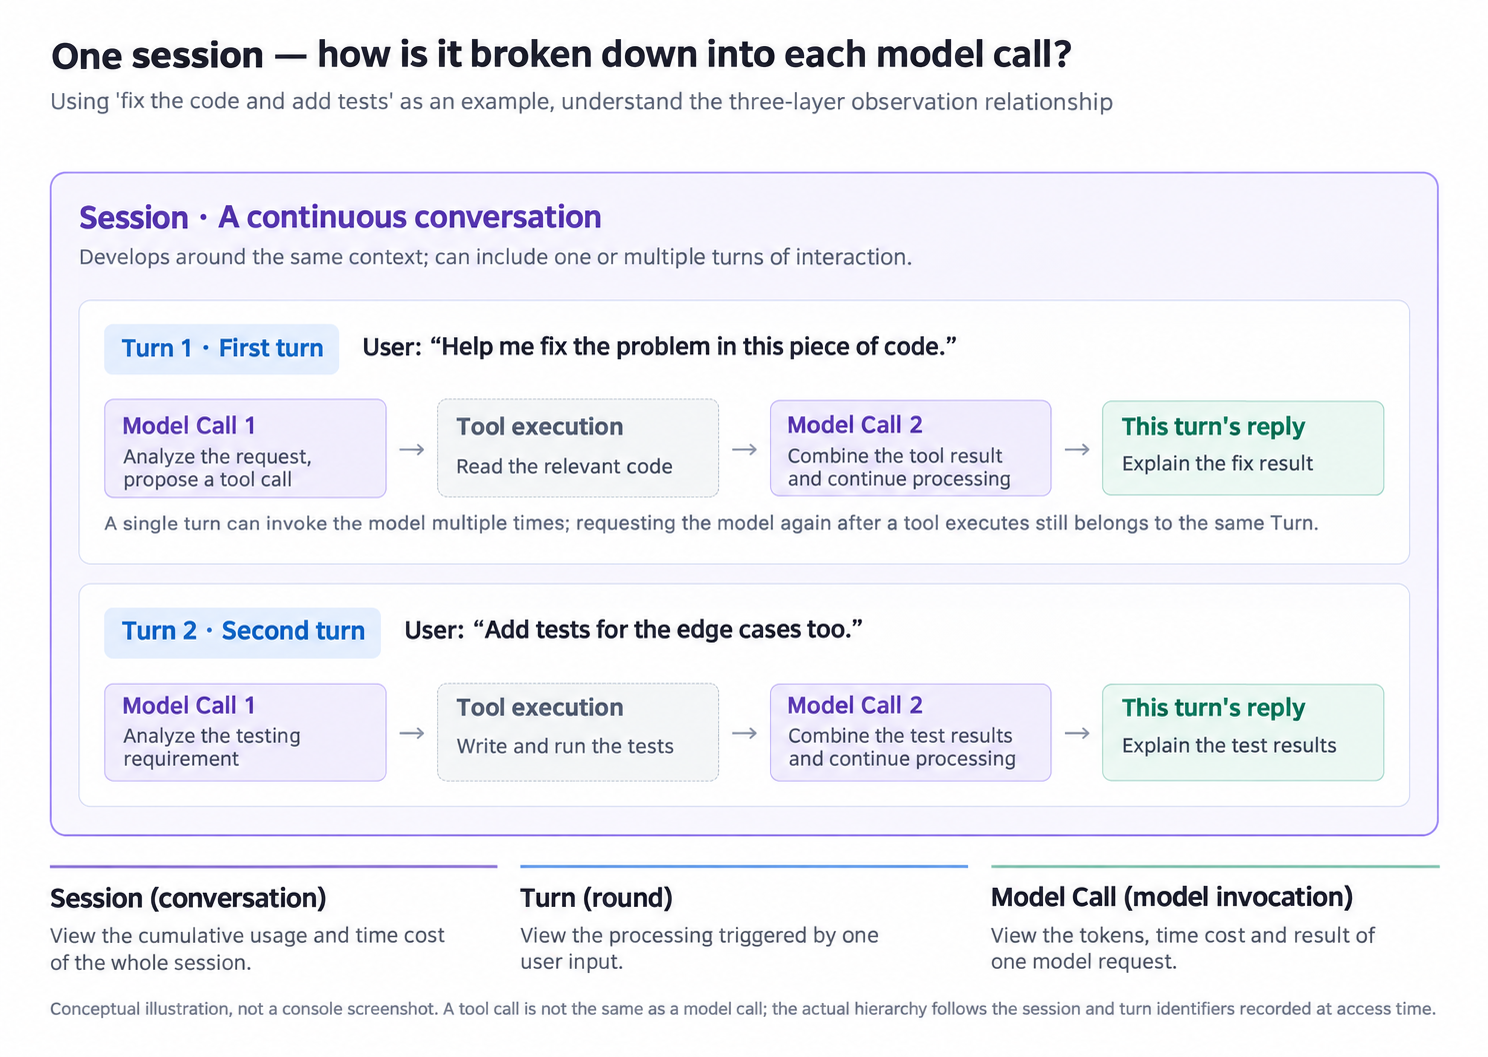
Figure 4: Hierarchical relationship among Session, Turn, and Model Call
Session usage statistics are presented at these three levels. The Session dashboard displays P50 and P90 values for Tokens, Credits, and session duration, and lists Sessions with high usage or long duration, helping you identify the sessions and associated consumers that require focused analysis.
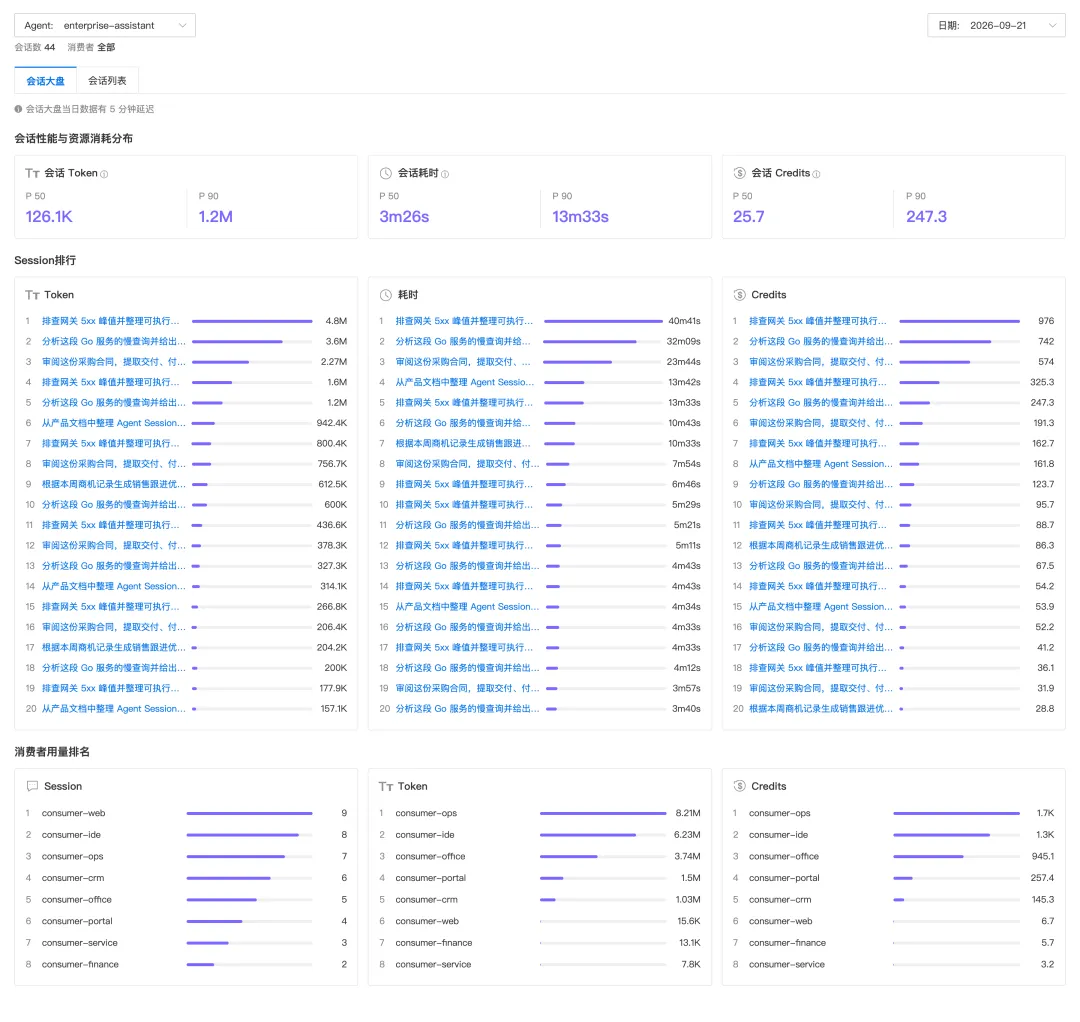
Figure 5: Session usage statistics — Session dashboard
The session list displays each session on the selected date. You can filter by consumer or search by session name or ID. Each record lists Tokens, Credits, cache hit rate, number of tool calls, total model-call duration, and total session duration, making it easy to compare consumption across tasks and open session details to inspect individual Turns and model calls.
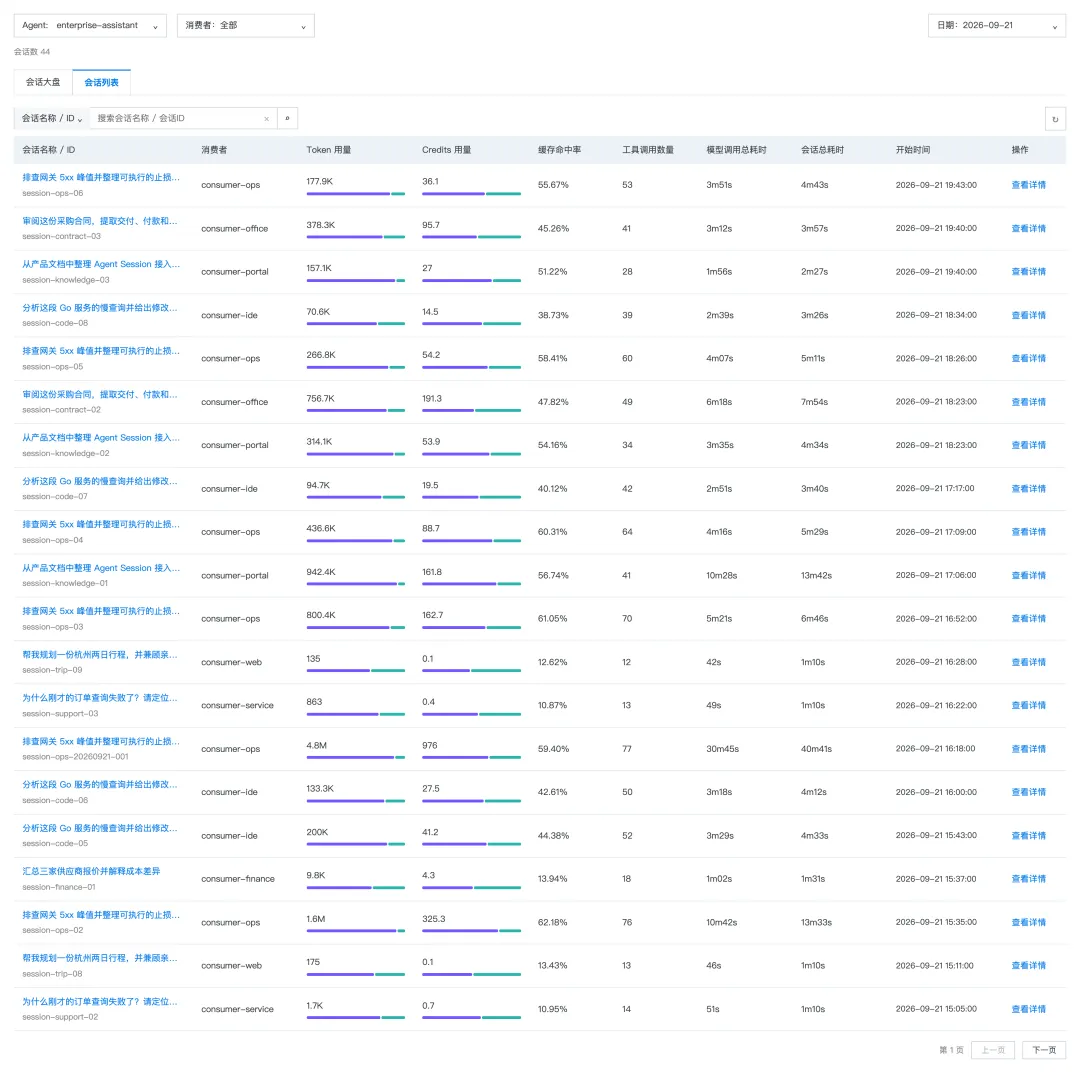
Figure 6: Session list for viewing and filtering session usage by date and consumer
Session details present usage data at three levels: Session, Turn, and model call.
The details page summarizes the session's Tokens, Credits, cache hit rate, number of tool calls, and duration, and displays the usage distribution and ranking of individual Turns. Expanding a Turn also shows the usage, duration, and result of each model call, allowing you to determine which calls contributed to the session's total consumption.
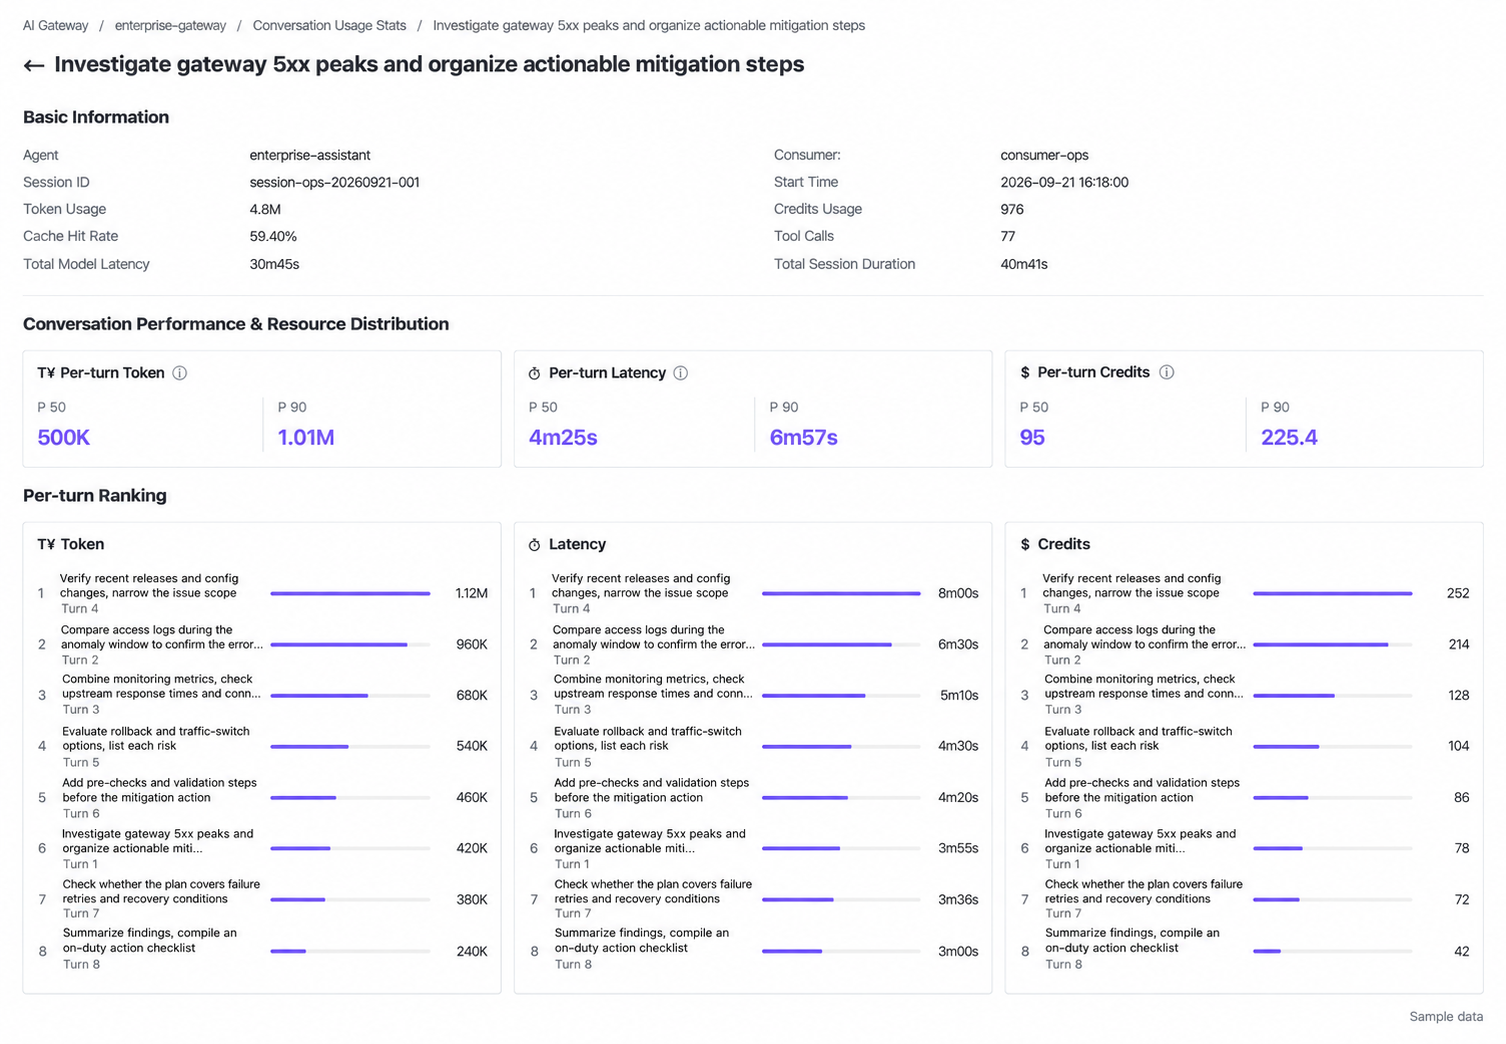
Figure 7: Session details break a task down into individual processing Turns
After opening a Turn, you can view information about each model call within it: which model was used, the number of input and output Tokens, whether the call succeeded, the finish reason, time to first Token, and total duration.
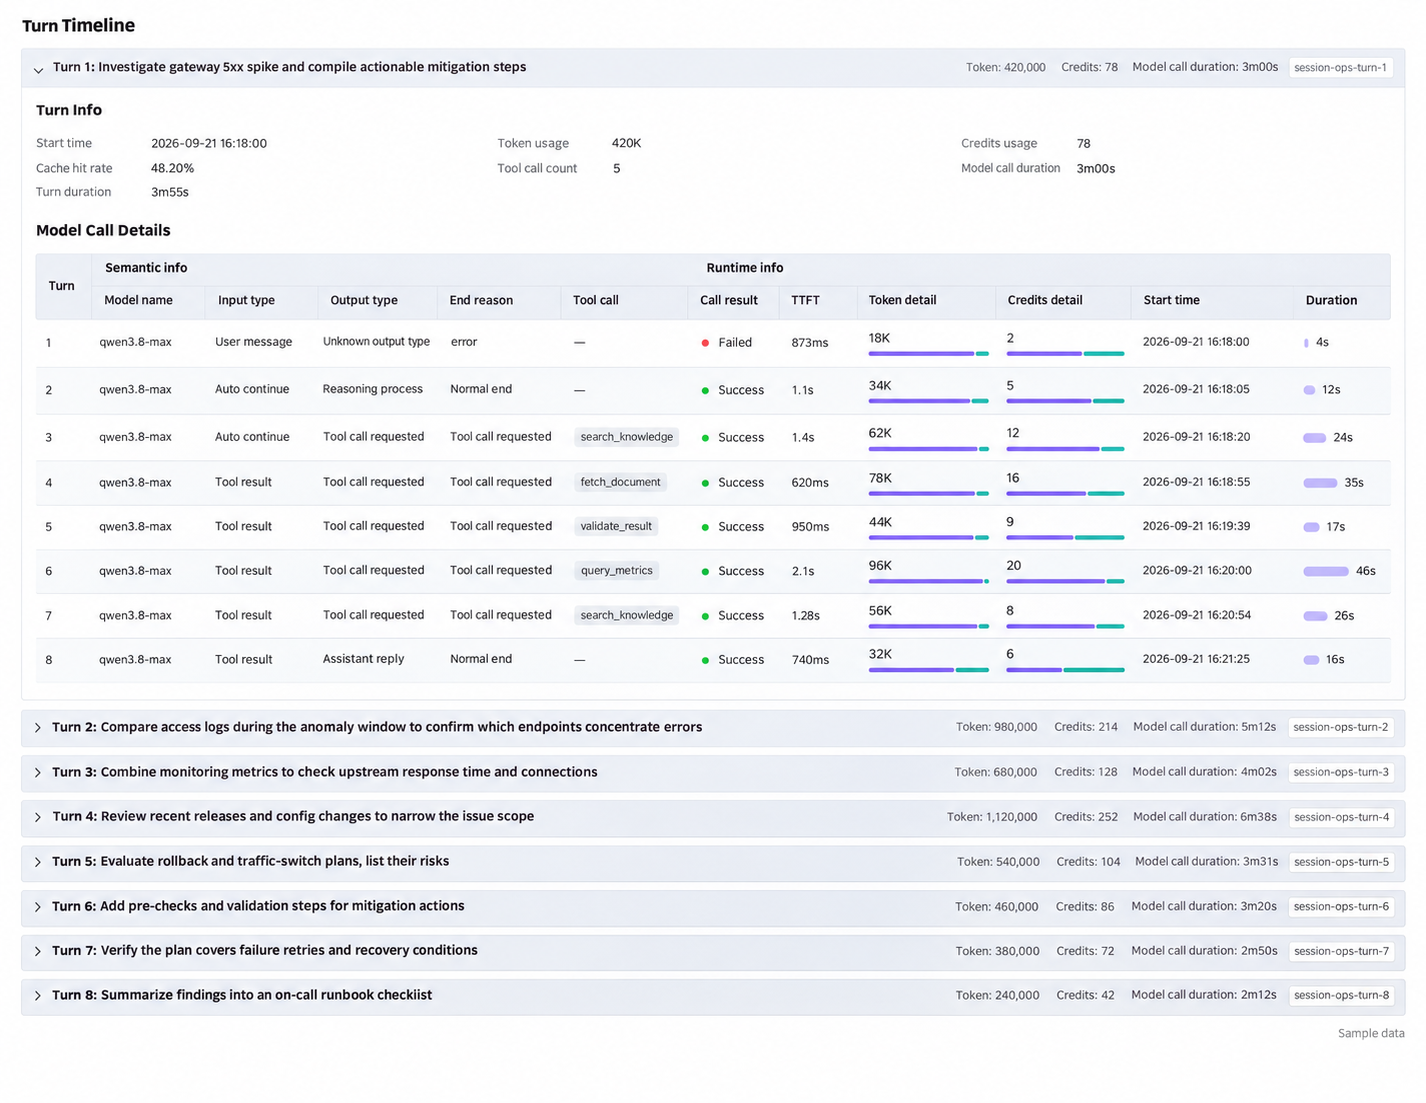
Figure 8: Results, Tokens, and duration can be viewed separately for model calls within the same Turn
The Agent management capability is now available in Alibaba Cloud AI Gateway Multi-tenant Edition (Serverless), supporting Agent access management, overall usage statistics and intelligent insights, and fine-grained observability at the Session, Turn, and model-call levels. Agent management capabilities for the Dedicated Edition gateway will be launched later.
As Agents move from personal tools into enterprise office and production scenarios, the observability perspective must also expand from individual usage to the team as a whole. Compared with endpoint observability focused on local or individual usage, an AI Gateway can aggregate model calls routed through the gateway, calculate statistics and perform analysis by dimensions such as Agent and consumer, and reveal the consumption distribution and runtime performance of different users. This meets individuals' need to inspect specific tasks while also giving enterprises and teams an overall view of usage. Combined with session details, it provides a basis for optimizing Harness processes such as model selection, context management, and tool calling.
Connect the Agents you use every day through Alibaba Cloud AI Gateway now, and make the usage and runtime performance of real tasks the starting point for optimization. Understand the attribution of every item of consumption, identify the directions worth optimizing, and support the continued use of Agents in office and production environments with data.
Durable Agent Explained: How to Keep an Agent Running Reliably in the Cloud over the Long Term

801 posts | 61 followers
FollowAlibaba Cloud Native Community - June 22, 2026
Alibaba Cloud Native Community - October 22, 2025
Alibaba Container Service - November 21, 2024
Alibaba Container Service - November 15, 2024
Alibaba Cloud Native Community - June 10, 2026
Alibaba Cloud Native Community - May 26, 2026
801 posts | 61 followers
Follow AgentLoop
An Agent self-evolution platform designed to make your Agents progressively smarter and more attuned to users.
Learn More Token Plan
Build more, spend less. One plan, every modality.
Learn More CloudMonitor
Automate performance monitoring of all your web resources and applications in real-time
Learn More Simple Log Service
An all-in-one service for log-type data
Learn MoreMore Posts by Alibaba Cloud Native Community

