By Xining Wang (xining.wxn@alibaba-inc.com)
This is the 4th article in the series:
SLO can measure the level of service. Users can manually define SLO based on Prometheus metrics, but the process is cumbersome. Alibaba Cloud Service Mesh (ASM) o generate SLO and associated alert rules, simplifying this process by custom resource YAML configurations. This article explains how to import the generated Prometheus rule to the Prometheus system for the SLOs to take effect.
• An ASM instance whose version is 1.15.3 or later is created. For more information, see Create an ASM Instance.
• An ACK cluster is created. For more information, see Create an ACK managed cluster.
• Install Prometheus monitoring on ACK. For more information, see Use Prometheus to monitor an ACK cluster and Monitor ASM instances by using a self-managed Prometheus instance.
• Add a cluster to an ASM instance. For more information, see Add a cluster to an ASM instance.
• An ingress gateway service is deployed. For more information, see Deploy an ingress gateway service.
• The automatic injection is enabled. For more information, see Enable automatic sidecar injection by using multiple methods.
• The application service-level SLO is defined. For more information, see Use ASM to Define SLO
Deploy the httpbin application in the cluster and configure the corresponding virtual service and gateway rules.
Save the following YAML file as the httpbin.yaml file, use kubectl to connect to the ACK cluster, and run the command kubectl apply -f httpbin.yaml.
##################################################################################################
# httpbin service
##################################################################################################
apiVersion: v1
kind: ServiceAccount
metadata:
  name: httpbin
---
apiVersion: v1
kind: Service
metadata:
  name: httpbin
  labels:
    app: httpbin
    service: httpbin
spec:
  ports:
  - name: http
    port: 8000
    targetPort: 80
  selector:
    app: httpbin
---
apiVersion: apps/v1
kind: Deployment
metadata:
  name: httpbin
spec:
  replicas: 1
  selector:
    matchLabels:
      app: httpbin
      version: v1
  template:
    metadata:
      labels:
        app: httpbin
        version: v1
    spec:
      serviceAccountName: httpbin
      containers:
      - image: docker.io/kennethreitz/httpbin
        imagePullPolicy: IfNotPresent
        name: httpbin
        ports:
- containerPort: 80Save the following YAML file as the httpbin-gateway.yaml file, use kubectl to connect to ASM, and run the command kubectl apply -f httpbin-gateway.yaml.
apiVersion: networking.istio.io/v1alpha3
kind: Gateway
metadata:
  name: httpbin-gateway
spec:
  selector:
    istio: ingressgateway
  servers:
  - port:
      number: 80
      name: http
      protocol: HTTP
    hosts:
    - "*"
---
apiVersion: networking.istio.io/v1alpha3
kind: VirtualService
metadata:
  name: httpbin
spec:
  hosts:
  - "*"
  gateways:
  - httpbin-gateway
  http:
  - route:
    - destination:
        host: httpbin
        port:
number: 8000In this example, Prometheus is deployed in Prometheus Operator mode. In Operator mode, Prometheus configurations are determined based on the related custom resources defined by Prometheus. Different methods are required to deploy the generated Prometheus rules based on the different deployment methods of Prometheus. For more information about how to import rules, visit the Prometheus official website.
To define recording and alerting rules, you can create a Prometheus custom resource (CR) that includes a PrometheusRule object with app: ack-prometheus-operator and release: ack-prometheus-operator labels.
Note: Whether to specify labels in the PrometheusRule CRD depends on the settings of the ruleSelector field in the Prometheus CR. If ruleSelector is left empty, labels are optional. Configure the Prometheus CR based on the actual situation. You can obtain the ruleSelector field in ACK console through the following method:
ruleSelector field.The following code shows a sample ruleSelector field. If you want the Prometheus Operator to select a Prometheus rule, the PrometheusRule must have the same set of labels as that in matchLabels.
ruleSelector:
  matchLabels:
    app: ack-prometheus-operator
    release: ack-prometheus-operator
In this example, the structure of the PrometheusRule is as follows:
apiVersion: monitoring.coreos.com/v1
kind: PrometheusRule
metadata:
  labels:
    app: ack-prometheus-operator
    release: ack-prometheus-operator
  name: asm-rules
  namespace: monitoring
spec:
  # Replace with the generated rule file
Replace the generated rule file with the spec field and save the yaml-formatted cr file as the prometheusrule.yaml.
Use kubectl to connect to the ACK cluster and run the command kubectl apply -f prometheusrule.yaml to add cr to the cluster.
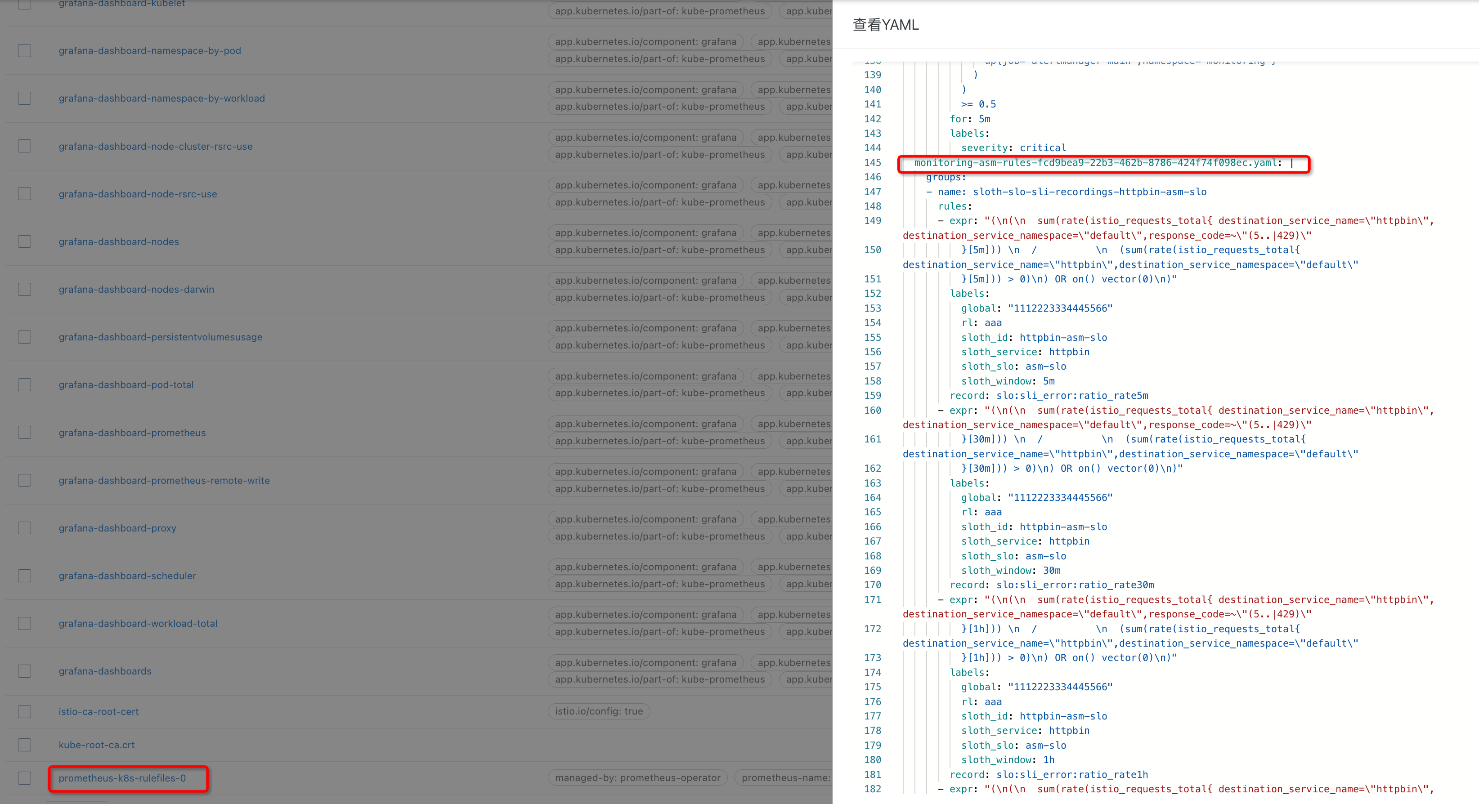
Open the cluster console. You can see that the corresponding controller of the PrometheusRule automatically writes the configuration to the configmap for Prometheus to read.

1. Use kubectl to connect to the ACK cluster. Run the following command on the CLI to forward all traffic from a local port to the ack-prometheus-operator-prometheus service:
kubectl --namespace monitoring port-forward svc/ack-prometheus-operator-prometheus 90902. Click https://localhost:9090 to access the Prometheus console.
3. On the Prometheus page, enter asm_slo_info in the text box, and click Execute to view the SLO configurations.
The following figure shows that the Prometheus recording rule is configured.

In the top navigation bar, click Alerts to view the alerting rule.
If information similar to that in the following figure appears, the Prometheus alerting rule is configured.

Replace the content in the curly brackets with your gateway IP address, and then run the following script on the command line to simulate the metrics generated in the case of the 99.5% success rate.
#!/bin/bash
for i in `seq 200`
do
if (( $i == 100 ))
then
    curl -I http://{gateway ip}/status/500;
else
    curl -I http://{gateway ip}/;
fi
echo "OK"
sleep 0.01;
done;
For more information about how to obtain the gateway IP address, see Deploy an ingress gateway service.
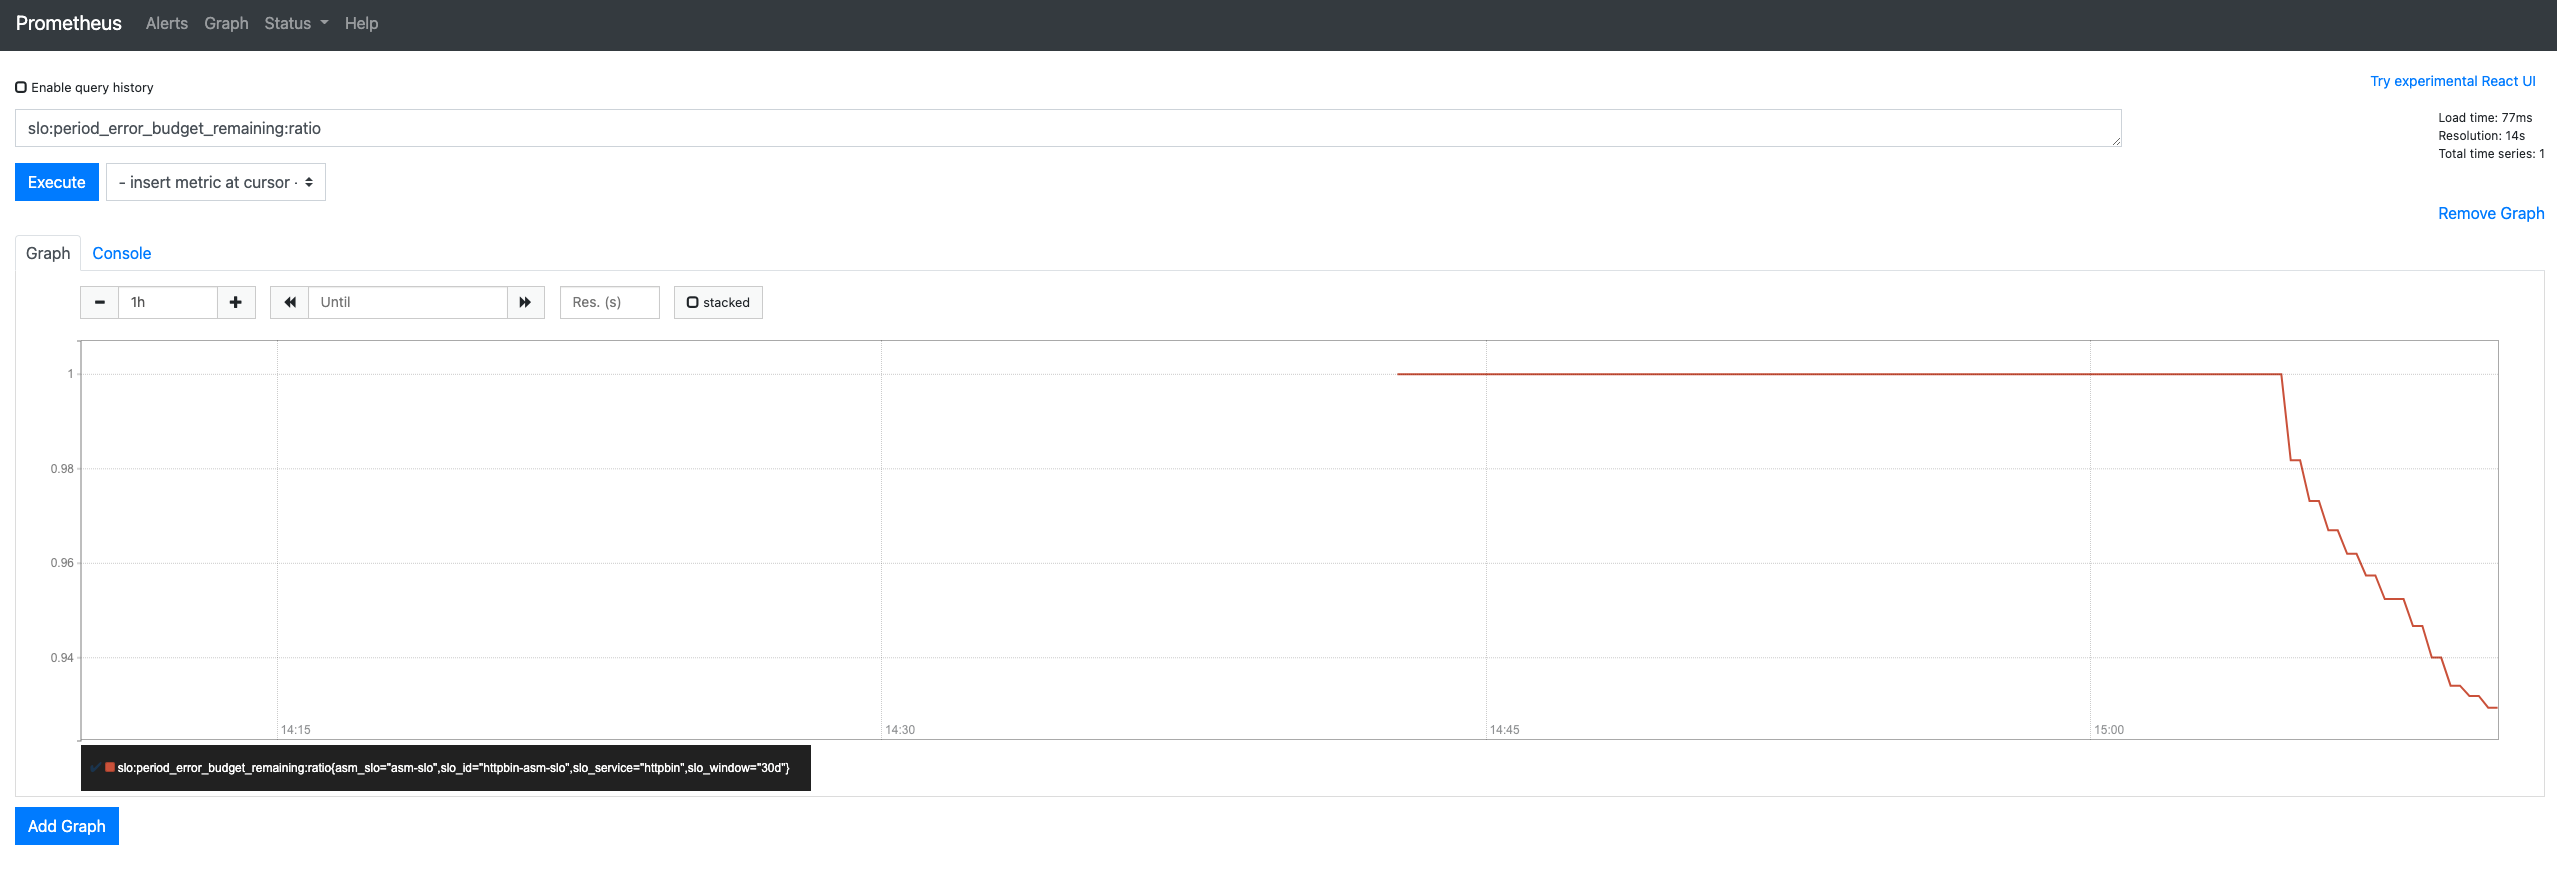
Return to the Prometheus page of the Prometheus console, enter slo:period_error_budget_remaining:ratio in the text box, and then click Execute. View the changes of the remaining error budget.

For more information about key SLO metrics, see SLO Overview:
• slo:period_error_budget_remaining:ratio: The remaining error budget during the 30-day compliance period of the SLO.
• slo:sli_error:ratio_rate30d: The average error rate during the 30-day compliance period of the SLO.
• slo:period_burn_rate:ratio: The burn rate for the 30-day compliance period of the SLO.
• slo:current_burn_rate:ratio: The current burn rate.
Trigger a fault manually to test the alert. You can replace the content in the curly brackets with your gateway IP address, and then run the following script on the command line to simulate the metrics generated in the case of a 50% of success rate (burn rate is 50) when the request error occurs.
#!/bin/bash
for i in `seq 200`
do
curl -I http://{gateway ip}/
curl -I http://{gateway ip}/status/500;
echo "OK"
sleep 0.01;
done;
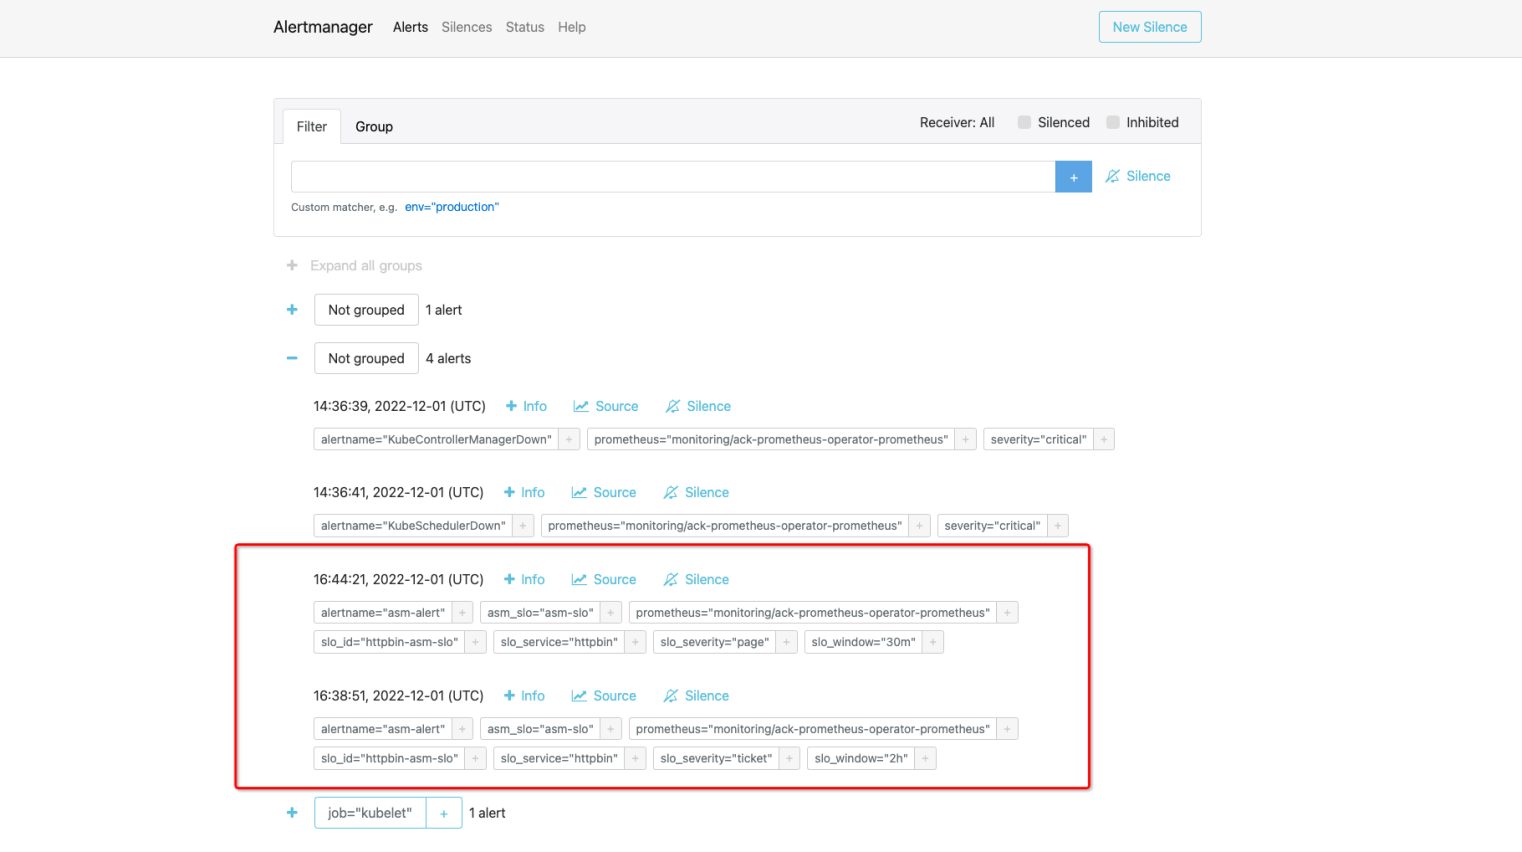
After the alert is triggered, you can view the following information on the Alerts page:

View alerts in AlertManager
The Alertmanager component collects alerts generated by the Prometheus server and sends the alerts to the specified contacts.
1. Run the following command to forward all traffic from the local port to the ack-prometheus-operator-alertmanager service:
kubectl --namespace monitoring port-forward svc/ack-prometheus-operator-alertmanager 90932. Click https://localhost:9093 to access to the Alertmanager console.
3. On the Alertmanager page, click the  icon to view alerts.
The following figure shows that custom alert information is collected.

Configure SLO for Application Service in Alibaba Cloud Service Mesh (5): Use Grafana to View SLO

56 posts | 8 followers
FollowXi Ning Wang(王夕宁) - April 8, 2023
Xi Ning Wang(王夕宁) - April 8, 2023
Xi Ning Wang(王夕宁) - April 8, 2023
Xi Ning Wang(王夕宁) - April 8, 2023
Alibaba Cloud Community - April 14, 2023
Alibaba Developer - May 21, 2021

56 posts | 8 followers
Follow Alibaba Cloud Service Mesh
Alibaba Cloud Service Mesh (ASM) is a fully managed service mesh platform that is compatible with Istio.
Learn More Managed Service for Prometheus
Multi-source metrics are aggregated to monitor the status of your business and services in real time.
Learn More Enterprise Distributed Application Service
A PaaS platform for a variety of application deployment options and microservices solutions to help you monitor, diagnose, operate and maintain your applications
Learn More Mobile Testing
Provides comprehensive quality assurance for the release of your apps.
Learn MoreMore Posts by Xi Ning Wang(王夕宁)