Prometheus is an open-source monitoring tool for cloud-native applications. This topic describes how to deploy Prometheus on an ACK cluster.
Background
This topic discusses how to monitor system components and resource entities in a Kubernetes cluster. Monitoring targets fall into two categories:
-
Resource monitoring: Tracks resource usage of nodes, clusters, and Pods.
-
Application monitoring: Tracks internal application metrics such as real-time user counts. Expose ports to enable application-level monitoring and alerting.
Monitoring targets include:
-
System components: Built-in Kubernetes components such as the API Server, cloud-controller-manager, and etcd. Configure monitoring in their respective configuration files.
-
Static resource entities: Resources such as node status and kernel events. Specify them in configuration files to enable monitoring.
-
Dynamic resource entities: Kubernetes workload objects such as Deployments, DaemonSets, and Pods. Deploy Prometheus to monitor them.
-
Custom applications: Expose ports and use Prometheus to collect custom metrics from your applications.
Step 1: Deploy open source Prometheus
Log on to the ACK console. In the left navigation pane, click Clusters.
On the Clusters page, click the name of your cluster. In the left navigation pane, click .
-
On the Helm page, click Deploy. In the Chart section, search for and select ack-prometheus-operator, keep the default settings, and click Next.
-
The component installs in the monitoring namespace by default, named after the component.
-
Customize the application name and namespace as needed.
-
-
On the Parameters page, select Chart version 12.0.0, set the required parameters, and then click OK.
Version 12.0.0 supports alert configuration with built-in features.
Optional parameters:
-
Alert configuration: Supports DingTalk and email alerts.
-
Mount a custom ConfigMap to Prometheus: Enables custom configurations.
-
Mount a dashboard file to Grafana: Adds custom dashboards.
After installation, check the component status in the Helm chart list on the Helm page.
-
Step 2: View Prometheus collection tasks
Log on to the ACK console. In the left navigation pane, click Clusters.
-
On the Clusters page, click the name of your cluster. In the left navigation pane, click .
-
On the Services page, select the monitoring namespace where ack-prometheus-operator is deployed. In the Actions column for ack-prometheus-operator-prometheus, click Update.
-
In the dialog box, set Type to LoadBalancer. Select Create Resource, set Access Method to Public Access, and set Billing Method to Pay-as-you-go (Pay-by-CU). Click OK.
See CLB Billing Overview.
-
After the update, copy the external IP address. Open the Prometheus UI at
<external_IP_address>:9090, for example,47.XX.XX.12:9090. -
On the Prometheus UI, navigate to to view all data collection tasks.
If all tasks show UP, data collection is running correctly.

-
In the menu bar, click Alerts to view the current alert rules.

Step 3: View aggregated data in Grafana
Log on to the ACK console. In the left navigation pane, click Clusters.
-
On the Clusters page, click the name of your cluster. In the left navigation pane, click .
-
On the Services page, select the namespace where ack-prometheus-operator is deployed (monitoring by default). Click Update in the Actions column for the Service named ack-prometheus-operator-grafana.
-
In the dialog box, set Type to LoadBalancer. Select Create Resource, set Access Method to Public Access, and set Billing Method to Pay-as-you-go (Pay-by-CU). Click OK.
See CLB Billing Overview.
-
After the update, copy the external IP address. Open the Grafana dashboard at
<external_IP_address>(default port: 80), for example,47.XX.XX.12.
Alert configuration
The ack-prometheus-operator component supports DingTalk and email alerts.
Log on to the ACK console. In the left navigation pane, click Clusters.
On the Clusters page, click the name of your cluster. In the left navigation pane, click .
-
Click Create, find ack-prometheus-operator, and proceed to the Next step. On the Parameters page, select the Chart version and configure parameters as described below.
If ack-prometheus-operator is already installed, click its name in the Helm chart list, then click Parameters to update the configuration.
Configure DingTalk alerts
-
In the configuration file, find the
dingtalkfield and setenabledtotrue. -
In the
tokenfield, enter the DingTalk webhook URL.See Use DingTalk Chatbots for Kubernetes Monitoring and Alerting for the webhook URL.
-
In the
alertmanagerconfigfield, find thereceiverconfiguration and enter the DingTalk alert name defined inreceivers. The default name iswebhook.If you have two DingTalk chatbots, follow these steps:
-
Replace the DingTalk
tokenconfiguration.In the DingTalk chatbot settings, replace the webhook URLs with the addresses for dingtalk1 and dingtalk2. Replace
https://oapi.dingtalk.com/robot/send?access_token=xxxxxxxxxxin the figure with your actual webhook URLs.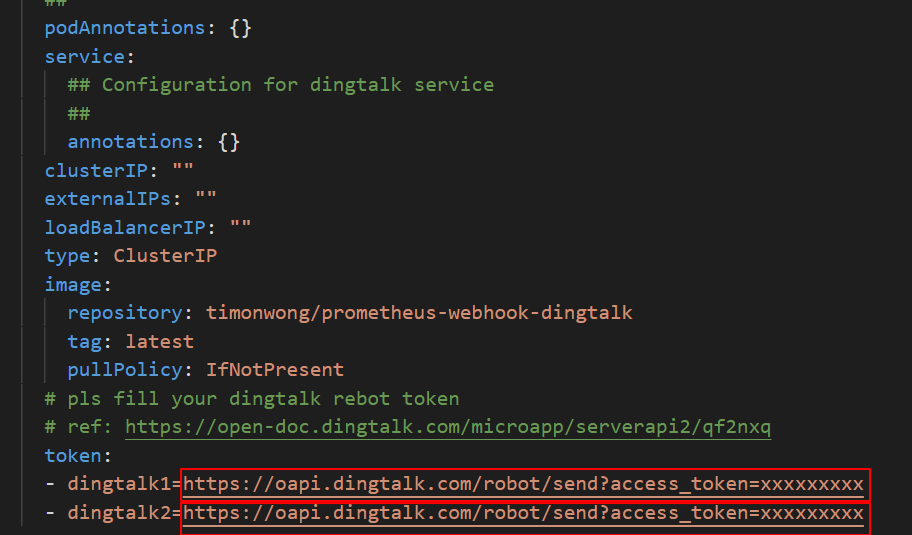
-
Modify
receivers.In the
alertmanagerconfigfield, findreceiverand enter the corresponding DingTalk alert names from yourreceiversconfiguration. In this example, the names arewebhook1andwebhook2. -
Modify the URL value.
Replace the value in the URL with the corresponding DingTalk webhook name. In this example, the names are
dingtalk1anddingtalk2.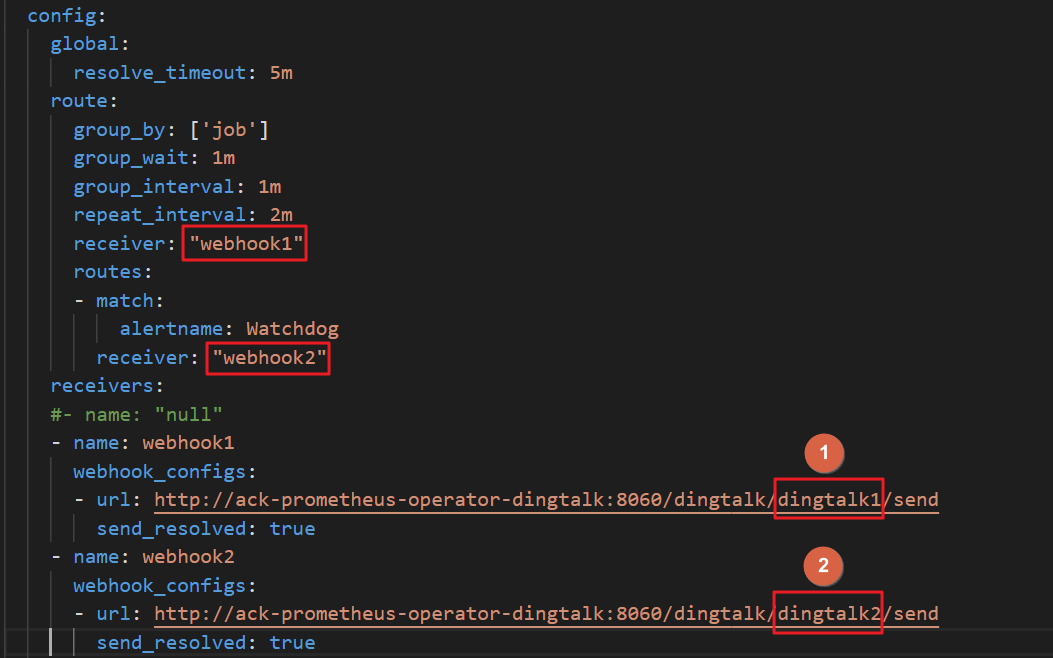
NoteTo add more DingTalk chatbots, add each webhook configuration in sequence.
-
Configure email alerts
-
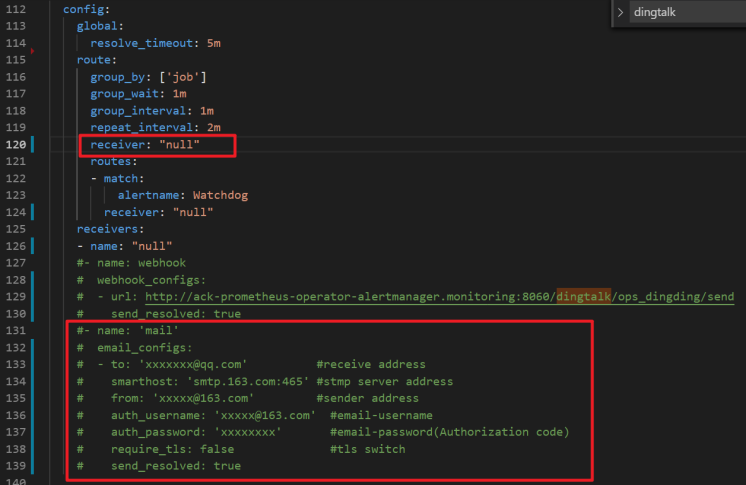
In the highlighted section, enter the email details.
-
In the
alertmanagerconfigfield, findreceiverand enter the email alert name defined inreceivers. The default name ismail.
Alert receiver template
Customize alert templates in the templateFiles section of the alertmanager configuration.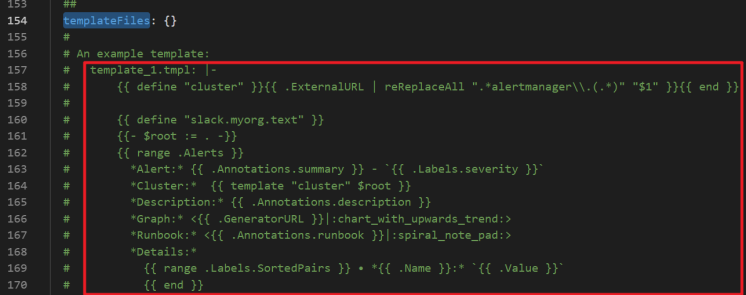
Mount a custom ConfigMap to Prometheus
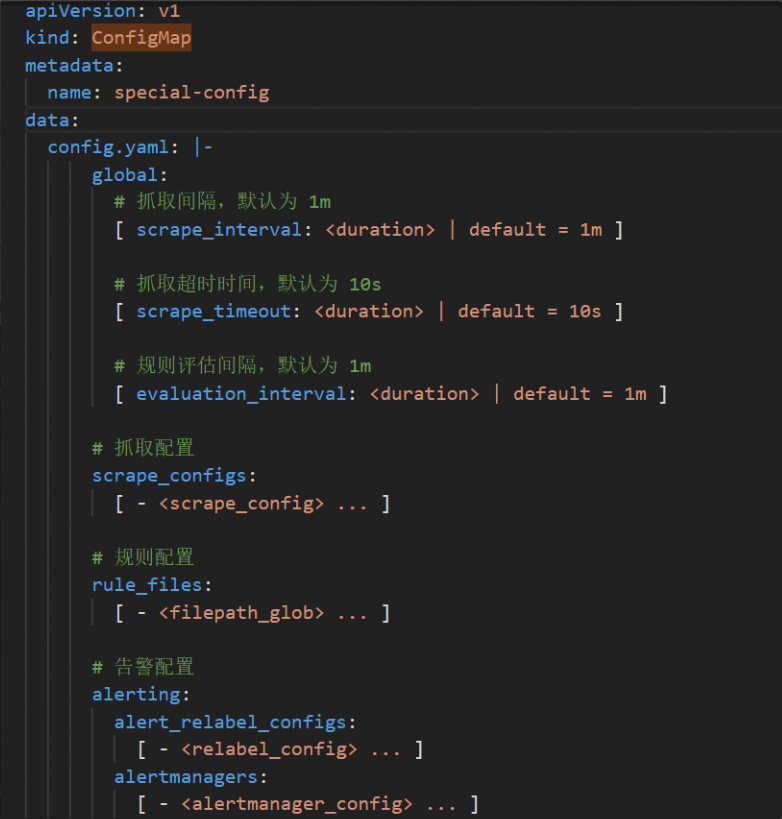
Use a ConfigMap named special-config to mount a configuration file and specify it as the --config.file parameter at Pod startup.
-
Create a ConfigMap.
-
Mount the ConfigMap.
On the Parameters page, add the following to the
configmapsfield to mount the ConfigMap to/etc/prometheus/configmaps/in the Prometheus Pod.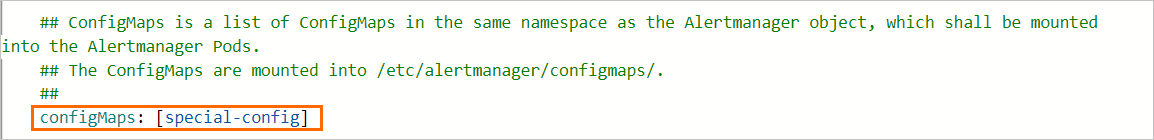
Example
prometheusconfigmapsconfiguration: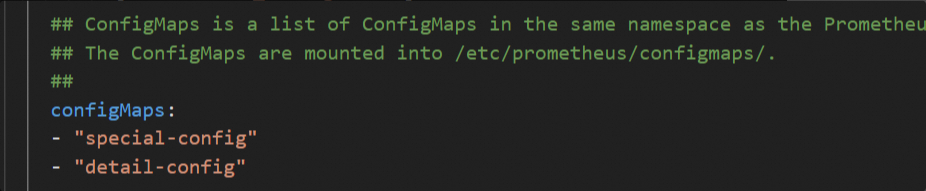
Grafana configuration
Mount a dashboard file to Grafana
To mount a dashboard ConfigMap to a Grafana Pod, use the extraConfigmapMounts field in the Parameters wizard.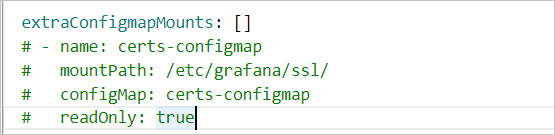 Ensure that:
-
The dashboard exists as a ConfigMap in the cluster, and its labels match the format of other ConfigMaps.
-
The
extraConfigmapMountsfield in the Grafana configuration includes the dashboard's ConfigMap and mount information.-
mountPath: Set to/tmp/dashboards/. -
ConfigMap: The name of your custom ConfigMap. -
name: The name of the dashboard's JSON file.
-
Enable dashboard persistence
Export dashboards as JSON files for backup. See Grafana Export.
Log on to the ACK console. In the left navigation pane, click Clusters.
On the Clusters page, click the name of your cluster. In the left navigation pane, click .
-
Find ack-prometheus-operator and click Update. In the
grafanafield, configure thepersistenceoption as shown below.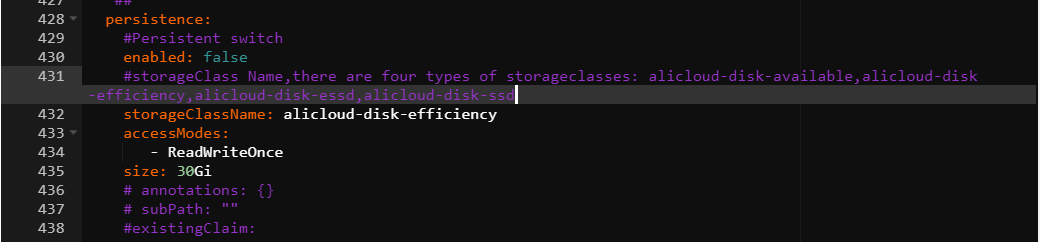
Related operations
Uninstall open source Prometheus
To prevent residual resources, follow the procedure for your Helm chart version. Manually clean up the Helm release, namespace, CRDs, and kubelet Service.
The kubelet Service is not automatically deleted on uninstall — a known community issue (#1523). Delete it manually as described below.
Chart v12.0.0
Console
-
Log on to the ACK console. In the left navigation pane, click Clusters.
-
On the Clusters page, click the name of your cluster and perform the following operations from the left-side navigation pane.
-
Uninstall the Helm release: Choose . In the Helm release list, find the ack-prometheus-operator entry, click Delete in the Actions column, and complete the deletion. Clear the release records.
-
Delete the namespace: Click Namespaces and Quotas. In the namespace list, find and select monitoring, and delete it.
-
Delete CustomResourceDefinitions (CRDs): Navigate to and click the CRDs tab. Delete all CRD resources under the
monitoring.coreos.comAPI group:-
AlertmanagerConfig
-
Alertmanager
-
PodMonitor
-
Probe
-
Prometheus
-
PrometheusRule
-
ServiceMonitor
-
ThanosRuler
-
-
Delete the kubelet Service: Choose Network > Services. Find and delete ack-prometheus-operator-kubelet in the kube-system namespace.
-
Kubectl
-
Uninstall the Helm release
helm uninstall ack-prometheus-operator -n monitoring -
Delete the namespace
kubectl delete namespace monitoring -
Delete CRDs
kubectl delete crd alertmanagerconfigs.monitoring.coreos.com kubectl delete crd alertmanagers.monitoring.coreos.com kubectl delete crd podmonitors.monitoring.coreos.com kubectl delete crd probes.monitoring.coreos.com kubectl delete crd prometheuses.monitoring.coreos.com kubectl delete crd prometheusrules.monitoring.coreos.com kubectl delete crd servicemonitors.monitoring.coreos.com kubectl delete crd thanosrulers.monitoring.coreos.com -
Delete the kubelet Service
kubectl delete service ack-prometheus-operator-kubelet -n kube-system
Chart v65.1.1
Console
-
Log on to the ACK console. In the left navigation pane, click Clusters.
-
On the Clusters page, click the name of your cluster and perform the following operations from the left-side navigation pane.
-
Uninstall the Helm release: Choose . In the Helm release list, find the ack-prometheus-operator entry, click Delete in the Actions column, and complete the deletion. Clear the release records.
-
Delete the namespace: Click Namespaces and Quotas. In the namespace list, find and select monitoring, and delete it.
-
Delete CustomResourceDefinitions (CRDs): Navigate to and click the CRDs tab. Delete all CRD resources under the
monitoring.coreos.comAPI group:-
AlertmanagerConfig
-
Alertmanager
-
PodMonitor
-
Probe
-
PrometheusAgent
-
Prometheus
-
PrometheusRule
-
ScrapeConfig
-
ServiceMonitor
-
ThanosRuler
-
-
Delete the kubelet Service: Choose Network > Services. Find and delete ack-prometheus-operator-kubelet in the kube-system namespace.
-
Kubectl
-
Uninstall the Helm release
helm uninstall ack-prometheus-operator -n monitoring -
Delete the namespace
kubectl delete namespace monitoring -
Delete CRDs
kubectl delete crd alertmanagerconfigs.monitoring.coreos.com kubectl delete crd alertmanagers.monitoring.coreos.com kubectl delete crd podmonitors.monitoring.coreos.com kubectl delete crd probes.monitoring.coreos.com kubectl delete crd prometheusagents.monitoring.coreos.com kubectl delete crd prometheuses.monitoring.coreos.com kubectl delete crd prometheusrules.monitoring.coreos.com kubectl delete crd scrapeconfigs.monitoring.coreos.com kubectl delete crd servicemonitors.monitoring.coreos.com kubectl delete crd thanosrulers.monitoring.coreos.com -
Delete the kubelet Service
kubectl delete service ack-prometheus-operator-kubelet -n kube-system
Configure alert silencing
Silence rules suppress matching alert notifications until the silence period expires or the rule is deleted.
-
Expose Alertmanager on local port 9093:
kubectl --address 0.0.0.0 port-forward svc/alertmanager-operated 9093 -n monitoring -
Associate an Elastic IP address (EIP) with your ECS instance, then access Alertmanager at
<EIP>:9093.Ensure the security group allows traffic from your local IP on port 9093. See Add a Security Group Rule.
-
Click Silence to configure alert silencing.

FAQ
No alerts received after DingTalk configuration
-
Obtain the webhook URL for your DingTalk chatbot. See Event Monitoring.
-
Find the dingtalk field, set enabled to true, and enter the DingTalk webhook URL in the Token field. See Configure DingTalk alerts in Alert configuration.
Error when deploying prometheus-operator
The following error message is reported:
Can't install release with errors: rpc error: code = Unknown desc = object is being deleted: customresourcedefinitions.apiextensions.k8s.io "xxxxxxxx.monitoring.coreos.com" already existsThis error occurs because CRDs from a previous deployment were not cleaned up. Delete the CRDs and redeploy the component:
kubectl delete crd prometheuses.monitoring.coreos.com
kubectl delete crd prometheusrules.monitoring.coreos.com
kubectl delete crd servicemonitors.monitoring.coreos.com
kubectl delete crd alertmanagers.monitoring.coreos.com
Email alerts not working
Email alerts may fail if you enter your login password for smtp_auth_password instead of the authorization code. The SMTP server address must include a port number.
An error occurs when you click YAML Update: The current cluster is temporarily unavailable. Please try again later.
This occurs when the Tiller configuration file is too large, making the cluster inaccessible. Reduce the file size by removing comments and mount it as a ConfigMap. prometheus-operator supports ConfigMap mounting only for prometheus and alertmanager Pods. See Mount a custom ConfigMap to Prometheus.
Enable features after deployment
Enable features after deploying prometheus-operator. On the cluster details page, choose . Find ack-prometheus-operator and click Update in the Actions column. Find the feature to enable, configure it, and click OK.
Choose between TSDB and Alibaba Cloud disks
TSDB is available in fewer regions than Alibaba Cloud disks. Data retention policy: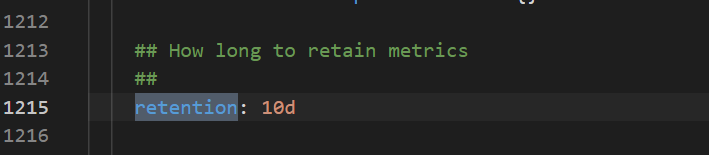
Grafana dashboard display issues
On the cluster details page, choose . Find ack-prometheus-operator and click Update in the Actions column. Verify that clusterVersion matches your cluster version. For clusters earlier than v1.16, enter 1.14.8-aliyun.1. For v1.16 or later, enter 1.16.6-aliyun.1.
Reinstallation fails after deleting the namespace
Deleting only the namespace may leave residual configurations. Clean up the following resources:
-
Delete RBAC permissions.
-
Delete ClusterRoles.
kubectl delete ClusterRole ack-prometheus-operator-grafana-clusterrole kubectl delete ClusterRole ack-prometheus-operator-kube-state-metrics kubectl delete ClusterRole psp-ack-prometheus-operator-kube-state-metrics kubectl delete ClusterRole psp-ack-prometheus-operator-prometheus-node-exporter kubectl delete ClusterRole ack-prometheus-operator-operator kubectl delete ClusterRole ack-prometheus-operator-operator-psp kubectl delete ClusterRole ack-prometheus-operator-prometheus kubectl delete ClusterRole ack-prometheus-operator-prometheus-psp -
Delete ClusterRoleBindings.
kubectl delete ClusterRoleBinding ack-prometheus-operator-grafana-clusterrolebinding
kubectl delete ClusterRoleBinding ack-prometheus-operator-kube-state-metrics
kubectl delete ClusterRoleBinding psp-ack-prometheus-operator-kube-state-metrics
kubectl delete ClusterRoleBinding psp-ack-prometheus-operator-prometheus-node-exporter
kubectl delete ClusterRoleBinding ack-prometheus-operator-operator
kubectl delete ClusterRoleBinding ack-prometheus-operator-operator-psp
kubectl delete ClusterRoleBinding ack-prometheus-operator-prometheus
kubectl delete ClusterRoleBinding ack-prometheus-operator-prometheus-psp
-
-
Delete CRDs.
kubectl delete crd alertmanagerconfigs.monitoring.coreos.com
kubectl delete crd alertmanagers.monitoring.coreos.com
kubectl delete crd podmonitors.monitoring.coreos.com
kubectl delete crd probes.monitoring.coreos.com
kubectl delete crd prometheuses.monitoring.coreos.com
kubectl delete crd prometheusrules.monitoring.coreos.com
kubectl delete crd servicemonitors.monitoring.coreos.com
kubectl delete crd thanosrulers.monitoring.coreos.com