By Xining Wang (xining.wxn@alibaba-inc.com)
This is the fifth article in the series:
Grafana is an open-source data visualization platform. It can generate various visual meters and help us simplify the complexity of monitoring. The following exaplains how to use Grafana to view SLO-related metrics.
Prerequisites
• The generated rules have been imported to Prometheus to execute the SLO. For more information, see Import the Generated Rules to Prometheus to Execute SLO.
• Use Kubernetes command-line client kubectl to connect to the ACK cluster that is added to the ASM instance. For more information, see Use kubectl to connect to an ASM instance.
Install Grafana and import a dashboard
1. Install Helm
2. Run the following command in the terminal to install the Grafana application in the ACK cluster
# Add the warehouse information
helm repo add grafana https://grafana.github.io/helm-charts
helm repo update
# Install the Grafana application
helm install -n monitoring asm-grafana grafana/grafana
3. Run kubectl get secret --namespace monitoring asm-grafana -o jsonpath="{.data.admin-password}" | base64 --decode ; echo in terminal to get login password
4. Run kubectl --namespace monitoring port-forward svc/asm-grafana 3000:80 in the terminal. Click http://localhost:3000 to access the Grafana console and log in with the username: admin and the password obtained in the previous step
5. Click Add data source and select the Prometheus data sources
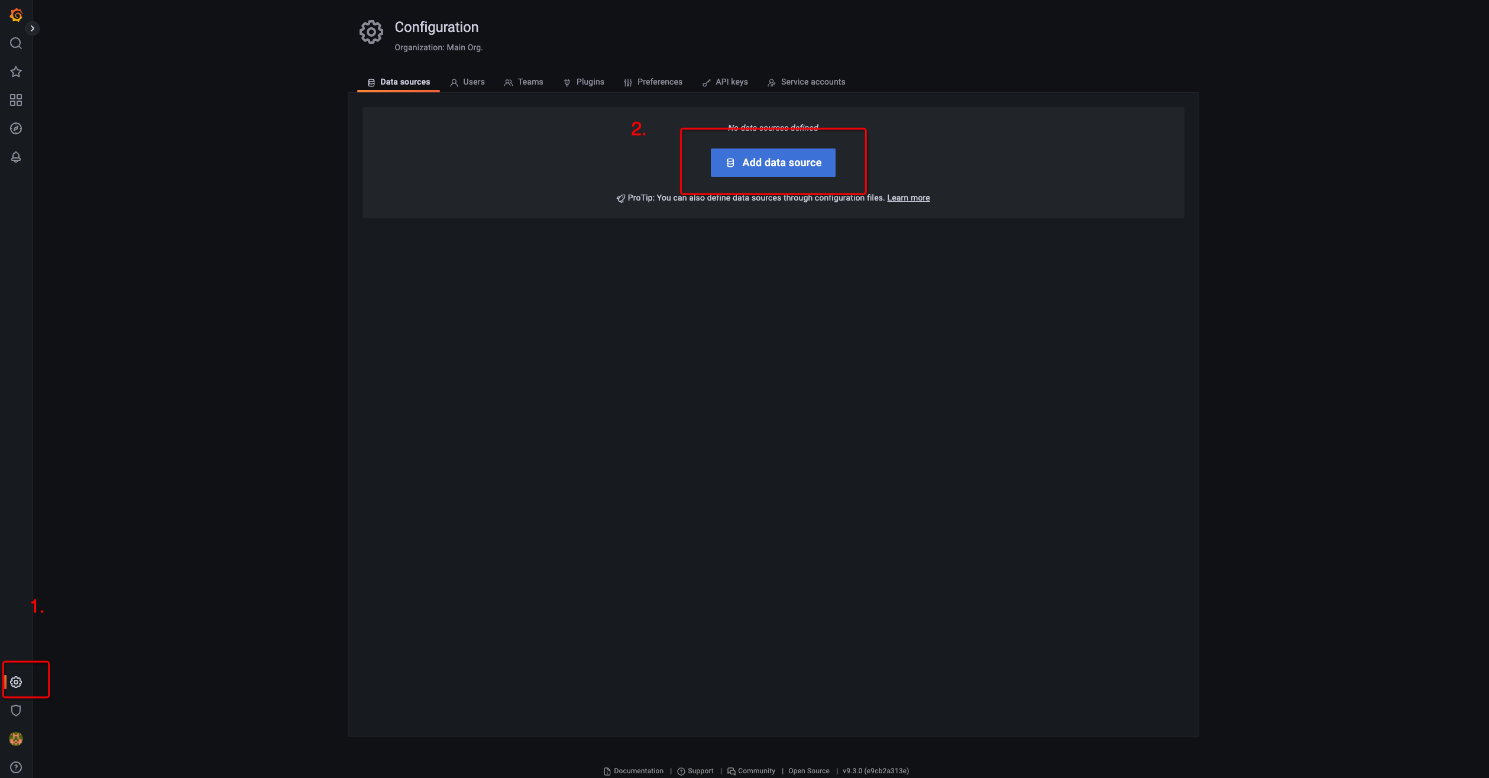
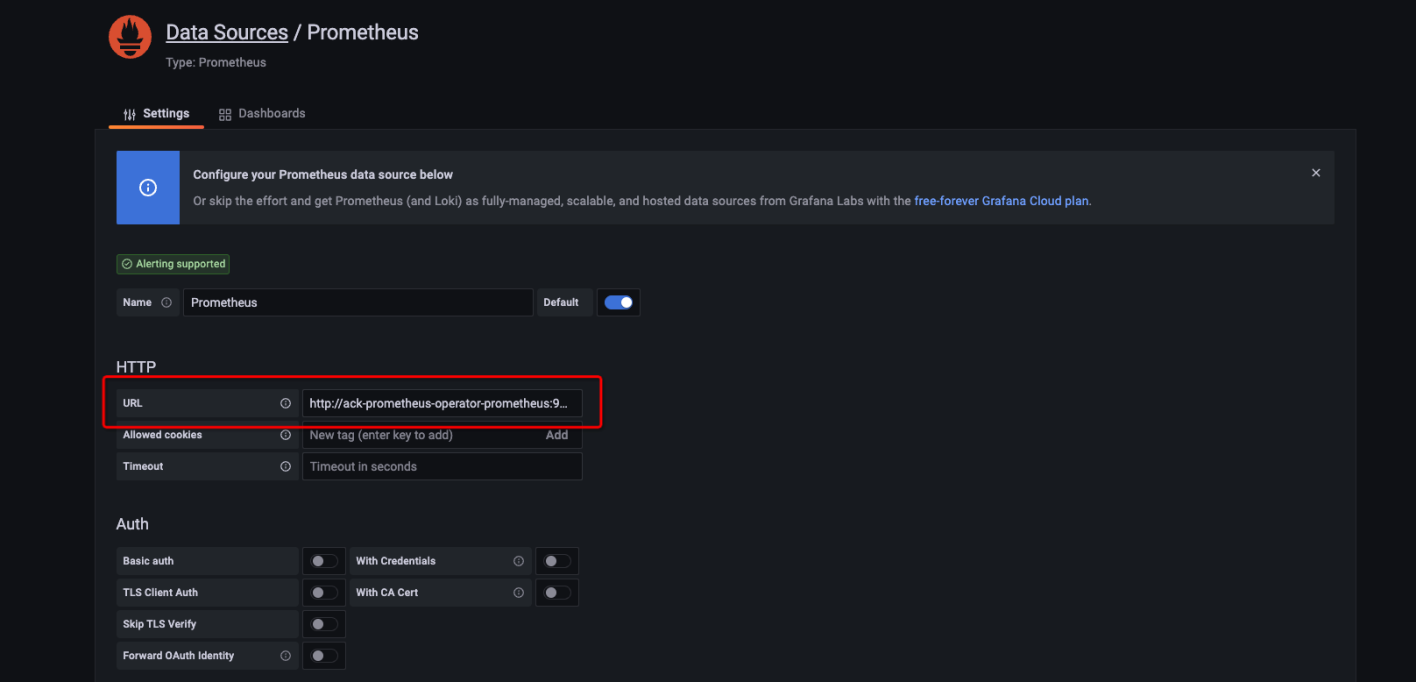
6. Enter http://ack-prometheus-operator-prometheus:9090 in the URL column and save it;
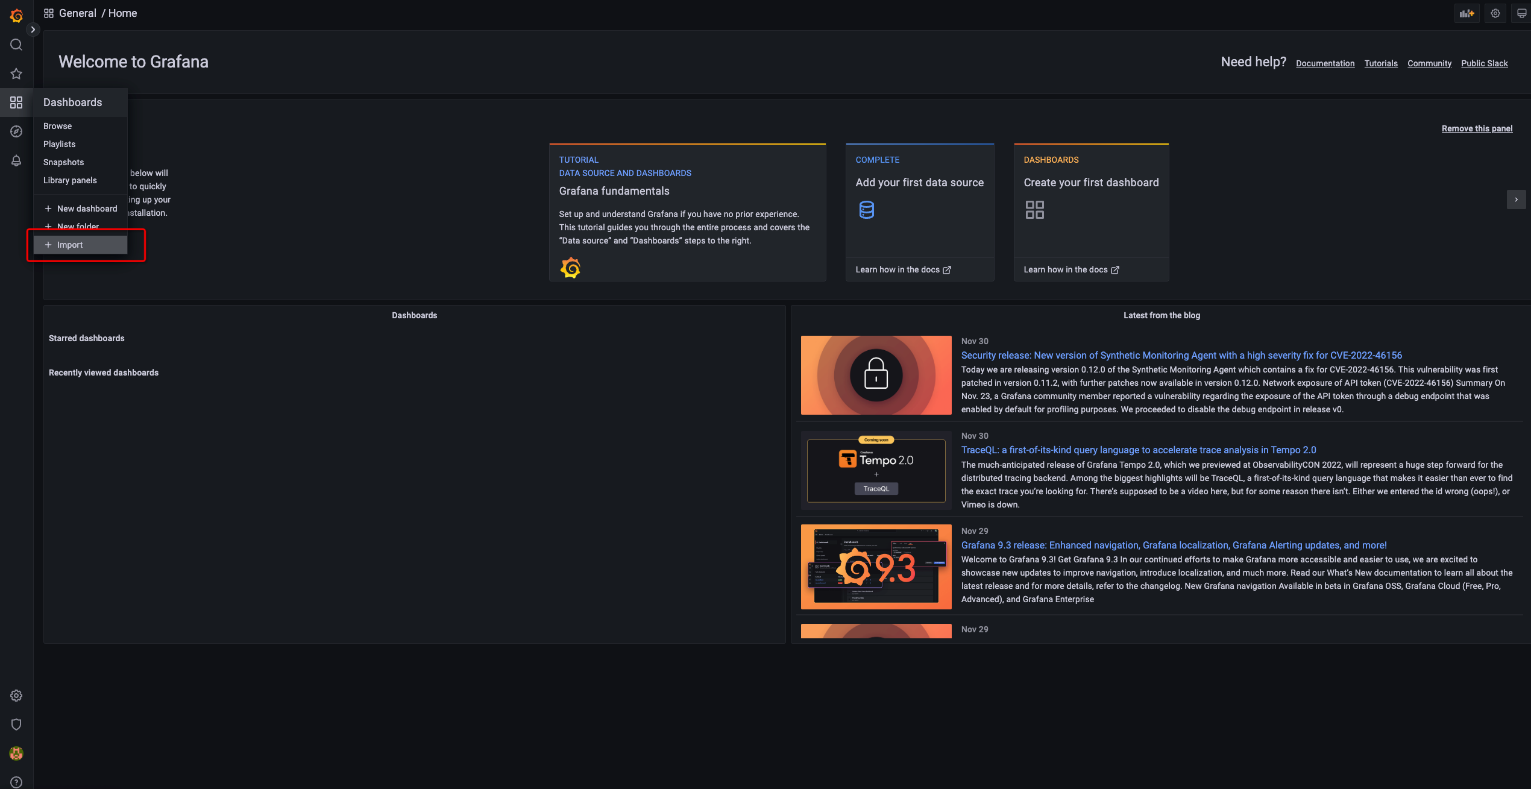
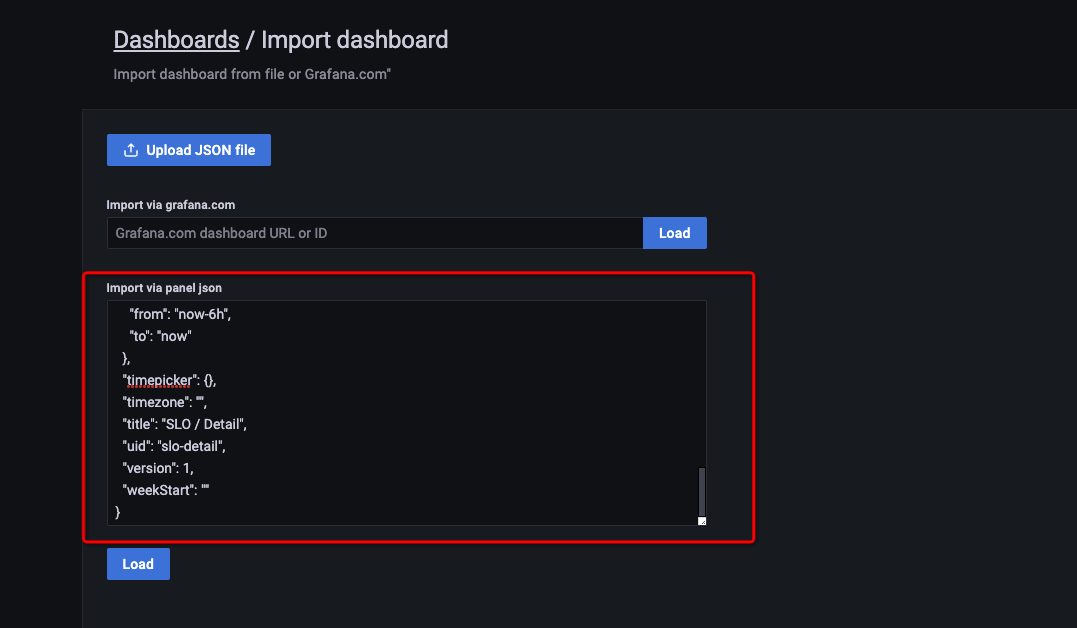
7. Click Dashboard->Import in the left sidebar, click the link to copy the dashboard template asm-slo-detail-rev5.json, paste it into the Import via panel json input box, and click Import Template.
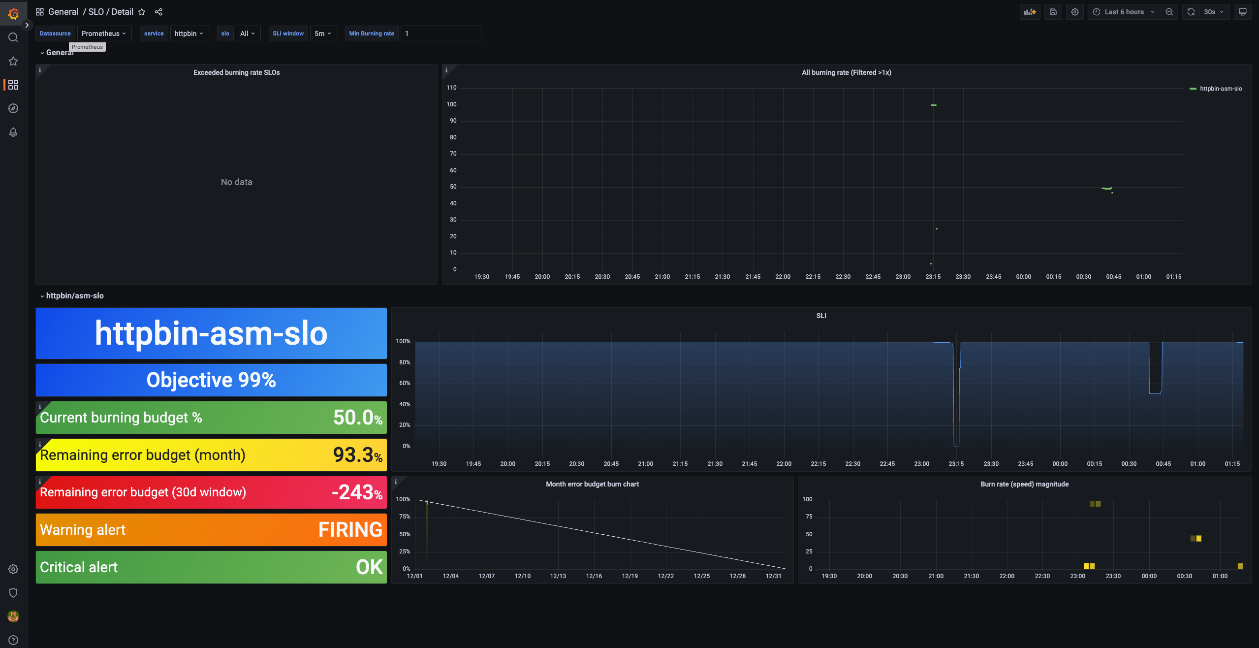
The effect of the dashboard is shown as the following:
Alibaba Cloud Service Mesh FAQ (1): How to Use the WebSocket over HTTP/2 Protocol

56 posts | 8 followers
FollowXi Ning Wang(王夕宁) - April 8, 2023
Xi Ning Wang(王夕宁) - April 8, 2023
Xi Ning Wang(王夕宁) - April 8, 2023
Xi Ning Wang(王夕宁) - April 8, 2023
Alibaba Cloud Community - April 14, 2023
Alibaba Developer - May 21, 2021

56 posts | 8 followers
Follow Alibaba Cloud Service Mesh
Alibaba Cloud Service Mesh (ASM) is a fully managed service mesh platform that is compatible with Istio.
Learn More Managed Service for Grafana
Managed Service for Grafana displays a large amount of data in real time to provide an overview of business and O&M monitoring.
Learn More Managed Service for Prometheus
Multi-source metrics are aggregated to monitor the status of your business and services in real time.
Learn More Elastic Desktop Service
A convenient and secure cloud-based Desktop-as-a-Service (DaaS) solution
Learn MoreMore Posts by Xi Ning Wang(王夕宁)
Dikky Ryan Pratama May 9, 2023 at 6:20 am
Great job on your blog post! Your writing is interesting and well-researched, and it's clear that you put a lot of effort into creating high-quality content. Your insights are thought provoking and your ideas are presented in a clear and organized manner. I appreciate how you explore complex topics with clarity and accessibility. Your writing style is very approachable and easy to read, which makes your blog a joy to visit. Your dedication to your readers and your passion for your subject matter really shines through in your writing. All in all, you should be proud of the work you've done here. Keep up the fantastic work!