This topic explains how to integrate a self-managed Prometheus with an ASM instance for mesh monitoring, using ack-prometheus-operator, an open source component for ACK clusters, as an example.
Prerequisites
-
An ACK cluster is available. For more information, see Create an ACK managed cluster.
-
An ASM instance is available. For more information, see Create an ASM instance. Prometheus and Grafana instances are installed in the ACK cluster. For more information, see Open source Prometheus monitoring.
Install ack-prometheus-operator
This topic uses ack-prometheus-operator, an open source component for ACK clusters, as an example. If you install a self-managed Prometheus in your cluster by using other methods, you must add the content of additionalScrapeConfigs to the scrape configs of your Prometheus instance. For more information about scrape configs, see prometheus_scrape_config.
Log on to the ACK console. In the left navigation pane, click Clusters.
On the Clusters page, click the name of your cluster. In the left navigation pane, click .
-
On the Helm page, find ack-prometheus-operator and click Update in the Actions column.
-
In the Update Release panel, modify the
additionalScrapeConfigsfield in the YAML text box, and then click OK.The YAML file is long. Press Ctrl+F to search for the
additionalScrapeConfigsfield. The modifiedadditionalScrapeConfigsfield is as follows:additionalScrapeConfigs: # Scrape config for envoy stats - job_name: 'envoy-stats' metrics_path: /stats/prometheus kubernetes_sd_configs: - role: pod relabel_configs: - source_labels: [__meta_kubernetes_pod_container_port_name] action: keep regex: '.*-envoy-prom' - source_labels: [__address__, __meta_kubernetes_pod_annotation_prometheus_io_port] action: replace regex: ([^:]+)(?::\d+)?;(\d+) replacement: $1:15090 target_label: __address__ - action: labeldrop regex: __meta_kubernetes_pod_label_(.+) - source_labels: [__meta_kubernetes_namespace] action: replace target_label: namespace - source_labels: [__meta_kubernetes_pod_name] action: replace target_label: pod_name
Generate metrics
Send requests to services on the data plane. This example uses the Bookinfo application. For more information, see getting started. Go to the product page of the Bookinfo application and refresh it several times to generate metrics. If the page displays the details of the book The Comedy of Errors, including Book Details (such as Type, Pages, Publisher, Language, and ISBN) and Book Reviews (a five-star review from Reviewer1 and a four-star review from Reviewer2), the sample application is running correctly and generating metrics.
Verify the results
Verify Envoy metric collection
Run the following command. If the command returns metrics, Envoy is collecting them. An empty response indicates that collection is not working.
details=$(kubectl get pod -l app=details -o jsonpath={.items..metadata.name})
kubectl exec $details -c istio-proxy -- curl -s localhost:15090/stats/prometheus |grep istio
View mesh metrics in Prometheus
Log on to the ACK console. In the left navigation pane, click Clusters.
On the Clusters page, click the name of your cluster. In the left navigation pane, click .
-
On the Services page, find the Prometheus service and click its External IP.
-
On the Prometheus page, enter
istio_requests_totalin the expression input box and click Execute. The results table may include two records: one with aresponse_codeof503(value: 1),source_appofreviews,source_versionofv2, anddestination_serviceofratings.bookinfo.svc.cluster.local; and another with aresponse_codeof200(value: 19),source_appofreviews,source_versionofv2,destination_appofratings, anddestination_versionofv1.
View mesh metrics in Grafana
Log on to the ACK console. In the left navigation pane, click Clusters.
On the Clusters page, click the name of your cluster. In the left navigation pane, click .
-
On the Services page, search for Grafana and click its External IP.
-
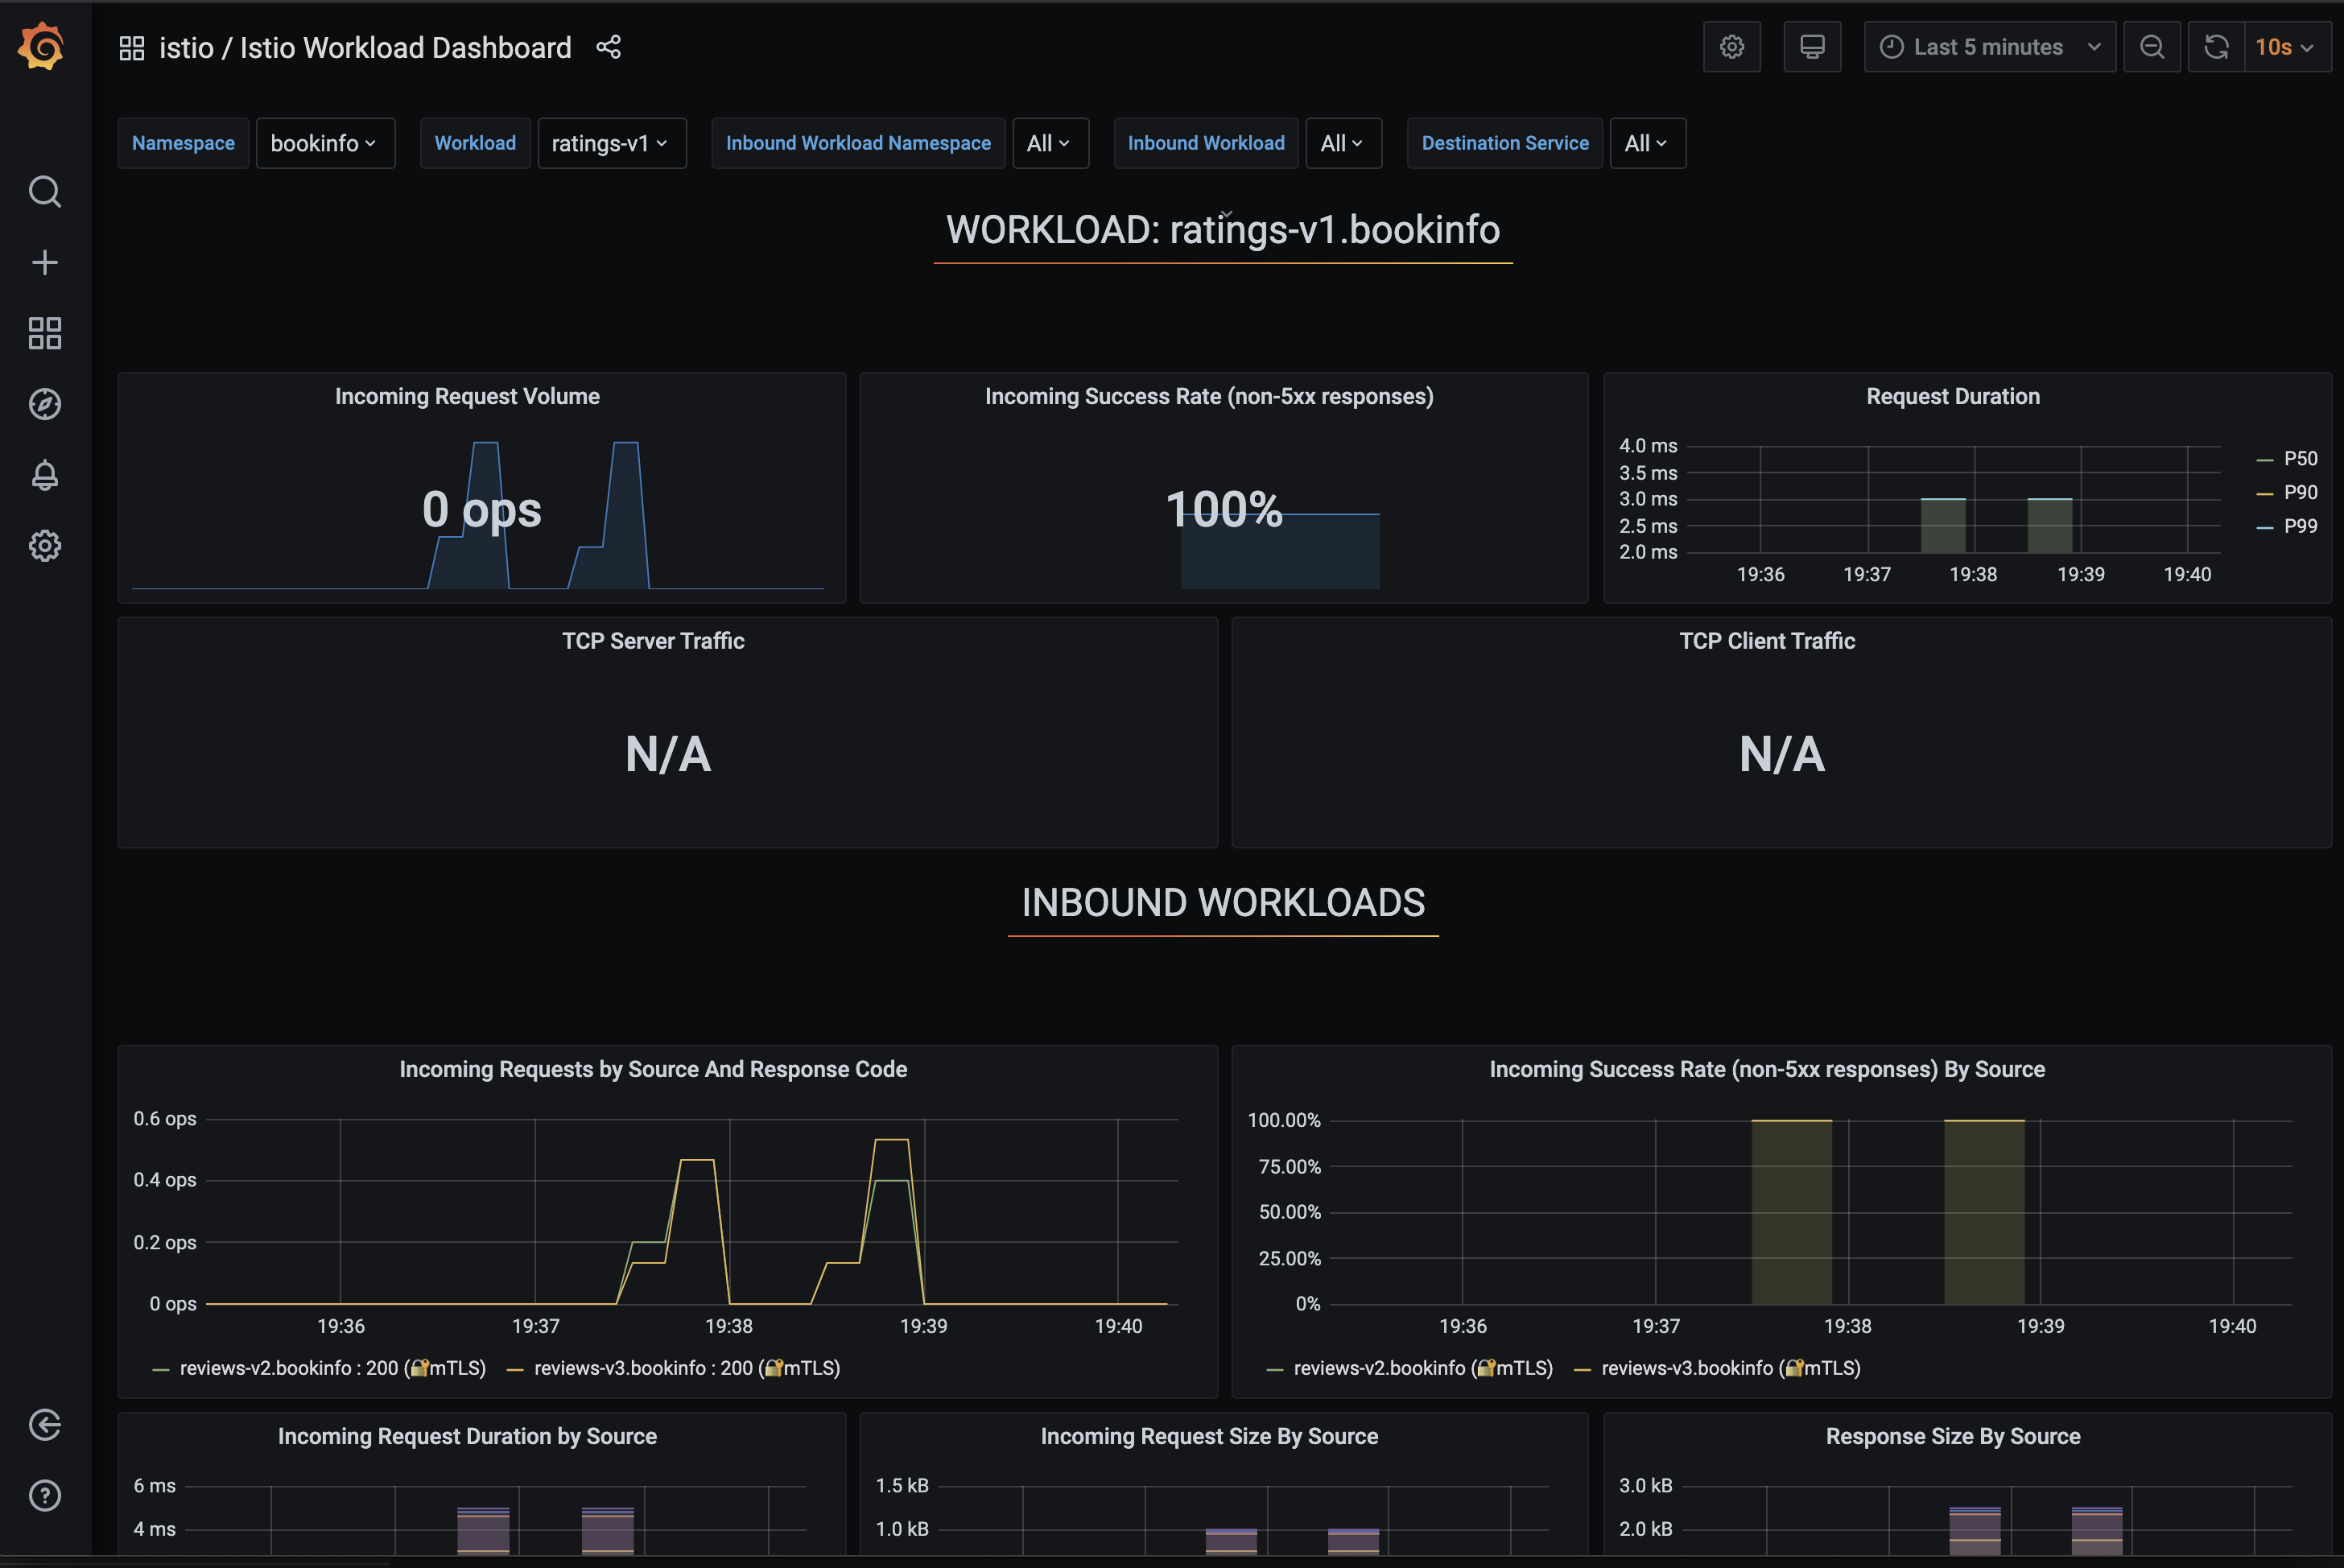
On the Grafana page, select the Istio Workload Dashboard.