By Jark Wu
This article describes tutorial practice based on the open-source sql-training project of Ververica, and Flink 1.7.2. It uses five examples throughout the Flink SQL programming practice, mainly covering the following aspects:
This tutorial is based on Docker, so you're not required to install other or additional programs. This exercise is not dependent on the Java environment, Scala, or IDE.
Note: There may not be enough resources configured in Docker by default, which may cause the Flink job to crash while running. Therefore, we recommend configuring the resources in Docker to 3-4 GB and 3-4 CPUs.
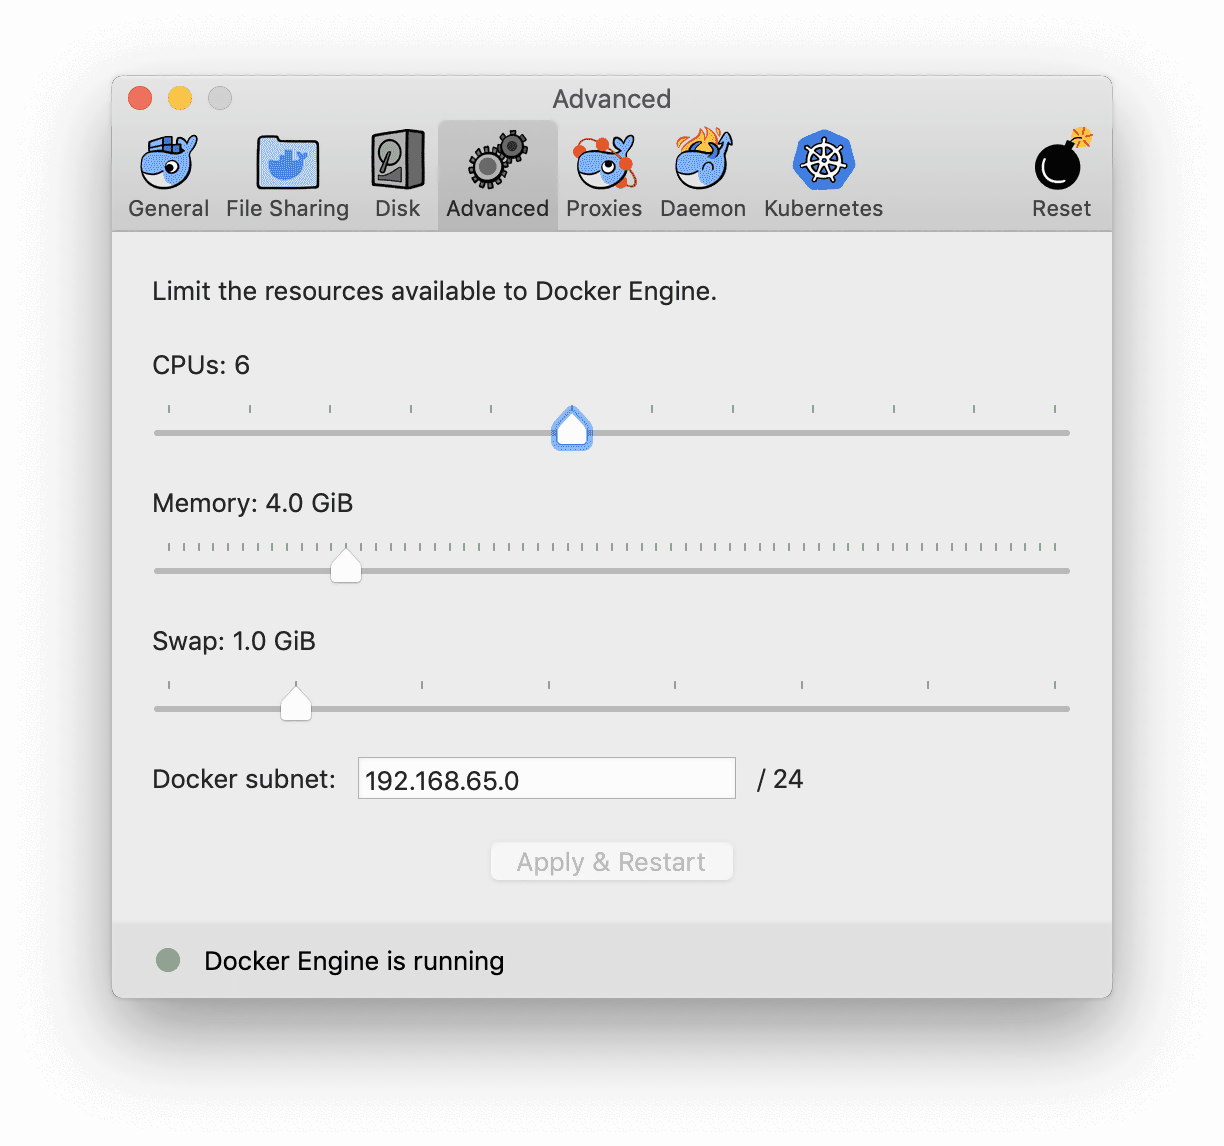
In this tutorial, we installed the environment using Docker Compose, which accommodates containers of various services, including:

The Docker Compose configuration file is provided. You can download the docker-compose.yml file directly.
Next, open the command line window, enter the directory where the docker-compose.yml file is stored, and then run the following command:
docker-compose up -d
set COMPOSE_CONVERT_WINDOWS_PATHS=1
docker-compose up -d
The docker-compose command starts every required container. Docker automatically downloads images (nearly 2.3 GB) from Docker Hub the first time it runs, which may take a while. After that, it starts in a matter of seconds. If the operation is successful, you can see the following output on the command line; you can also access Flink Web UI at http://localhost:8081.

Run the following command to enter the Flink SQL CLI.
docker-compose exec sql-client ./sql-client.shThe command starts the Flink SQL CLI client in the container. Then, you see the following 'welcome' interface.
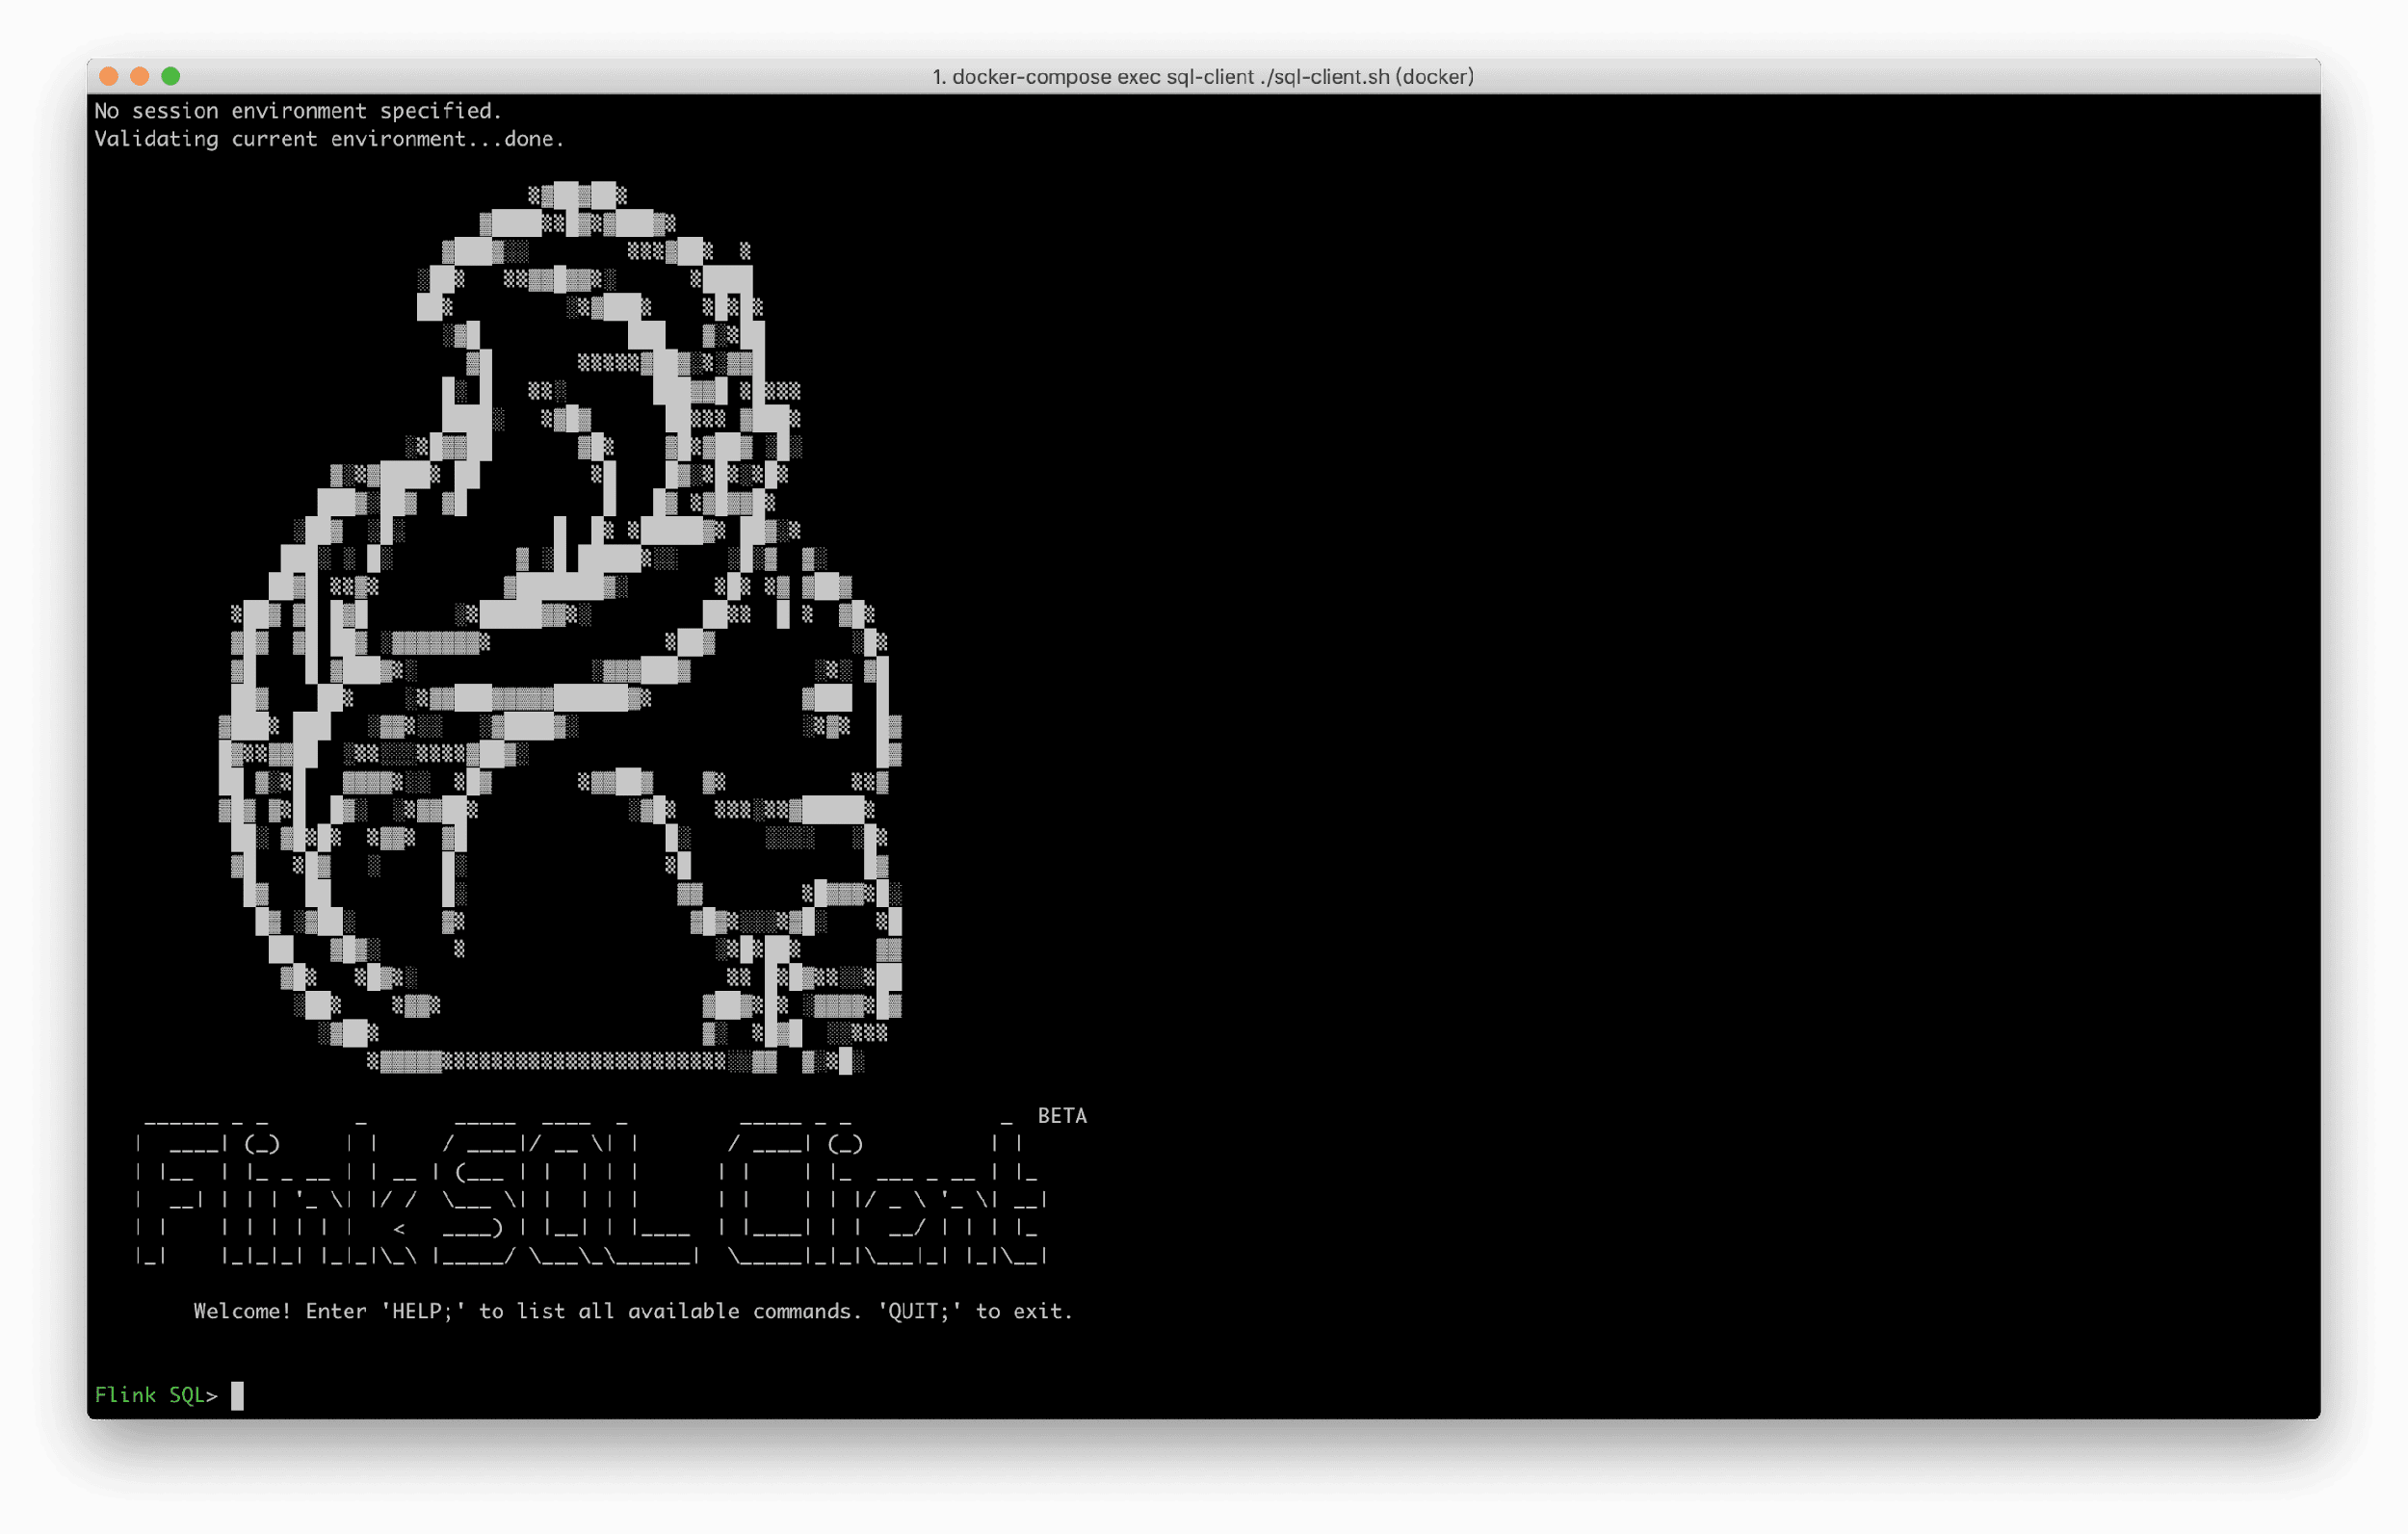
Some tables and data are pre-registered in Docker Compose are viewed by running SHOW TABLES. By using the Rides table data in the article, you can see the driving record data stream of a taxi, including the time and location. You can view the table structure by running the DESCRIBE Rides; command.
Flink SQL> DESCRIBE Rides;
root
 |-- rideId: Long           // Ride ID (including two records, an input and an output)
 |-- taxiId: Long           // Taxi ID
 |-- isStart: Boolean       // Start or end
 |-- lon: Float             // Longitude
 |-- lat: Float             // Latitude
 |-- rideTime: TimeIndicatorTypeInfo(rowtime)     // Time
 |-- psgCnt: Integer        // Number of passengers
For more information about the Rides table, see training-config.yaml.
Let's suppose that you want to check the driving records in New York now.
Note: Some built-in functions are predefined in the Docker environment, such as isInNYC(lon, lat) to determine whether there are latitude and longitude in New York, and toAreaId(lon, lat) to convert them into specific areas.
Therefore, you can use isInNYC to filter driving records in New York quickly. Run the following query in SQL CLI:
SELECT * FROM Rides WHERE isInNYC(lon, lat);SQL CLI submits an SQL task to the Docker cluster; it continuously pulls data from the data source (Rides streams are in Kafka) and filters the required data through isInNYC. The SQL CLI also enters visualization mode and constantly refreshes and displays the filtered results in real-time:
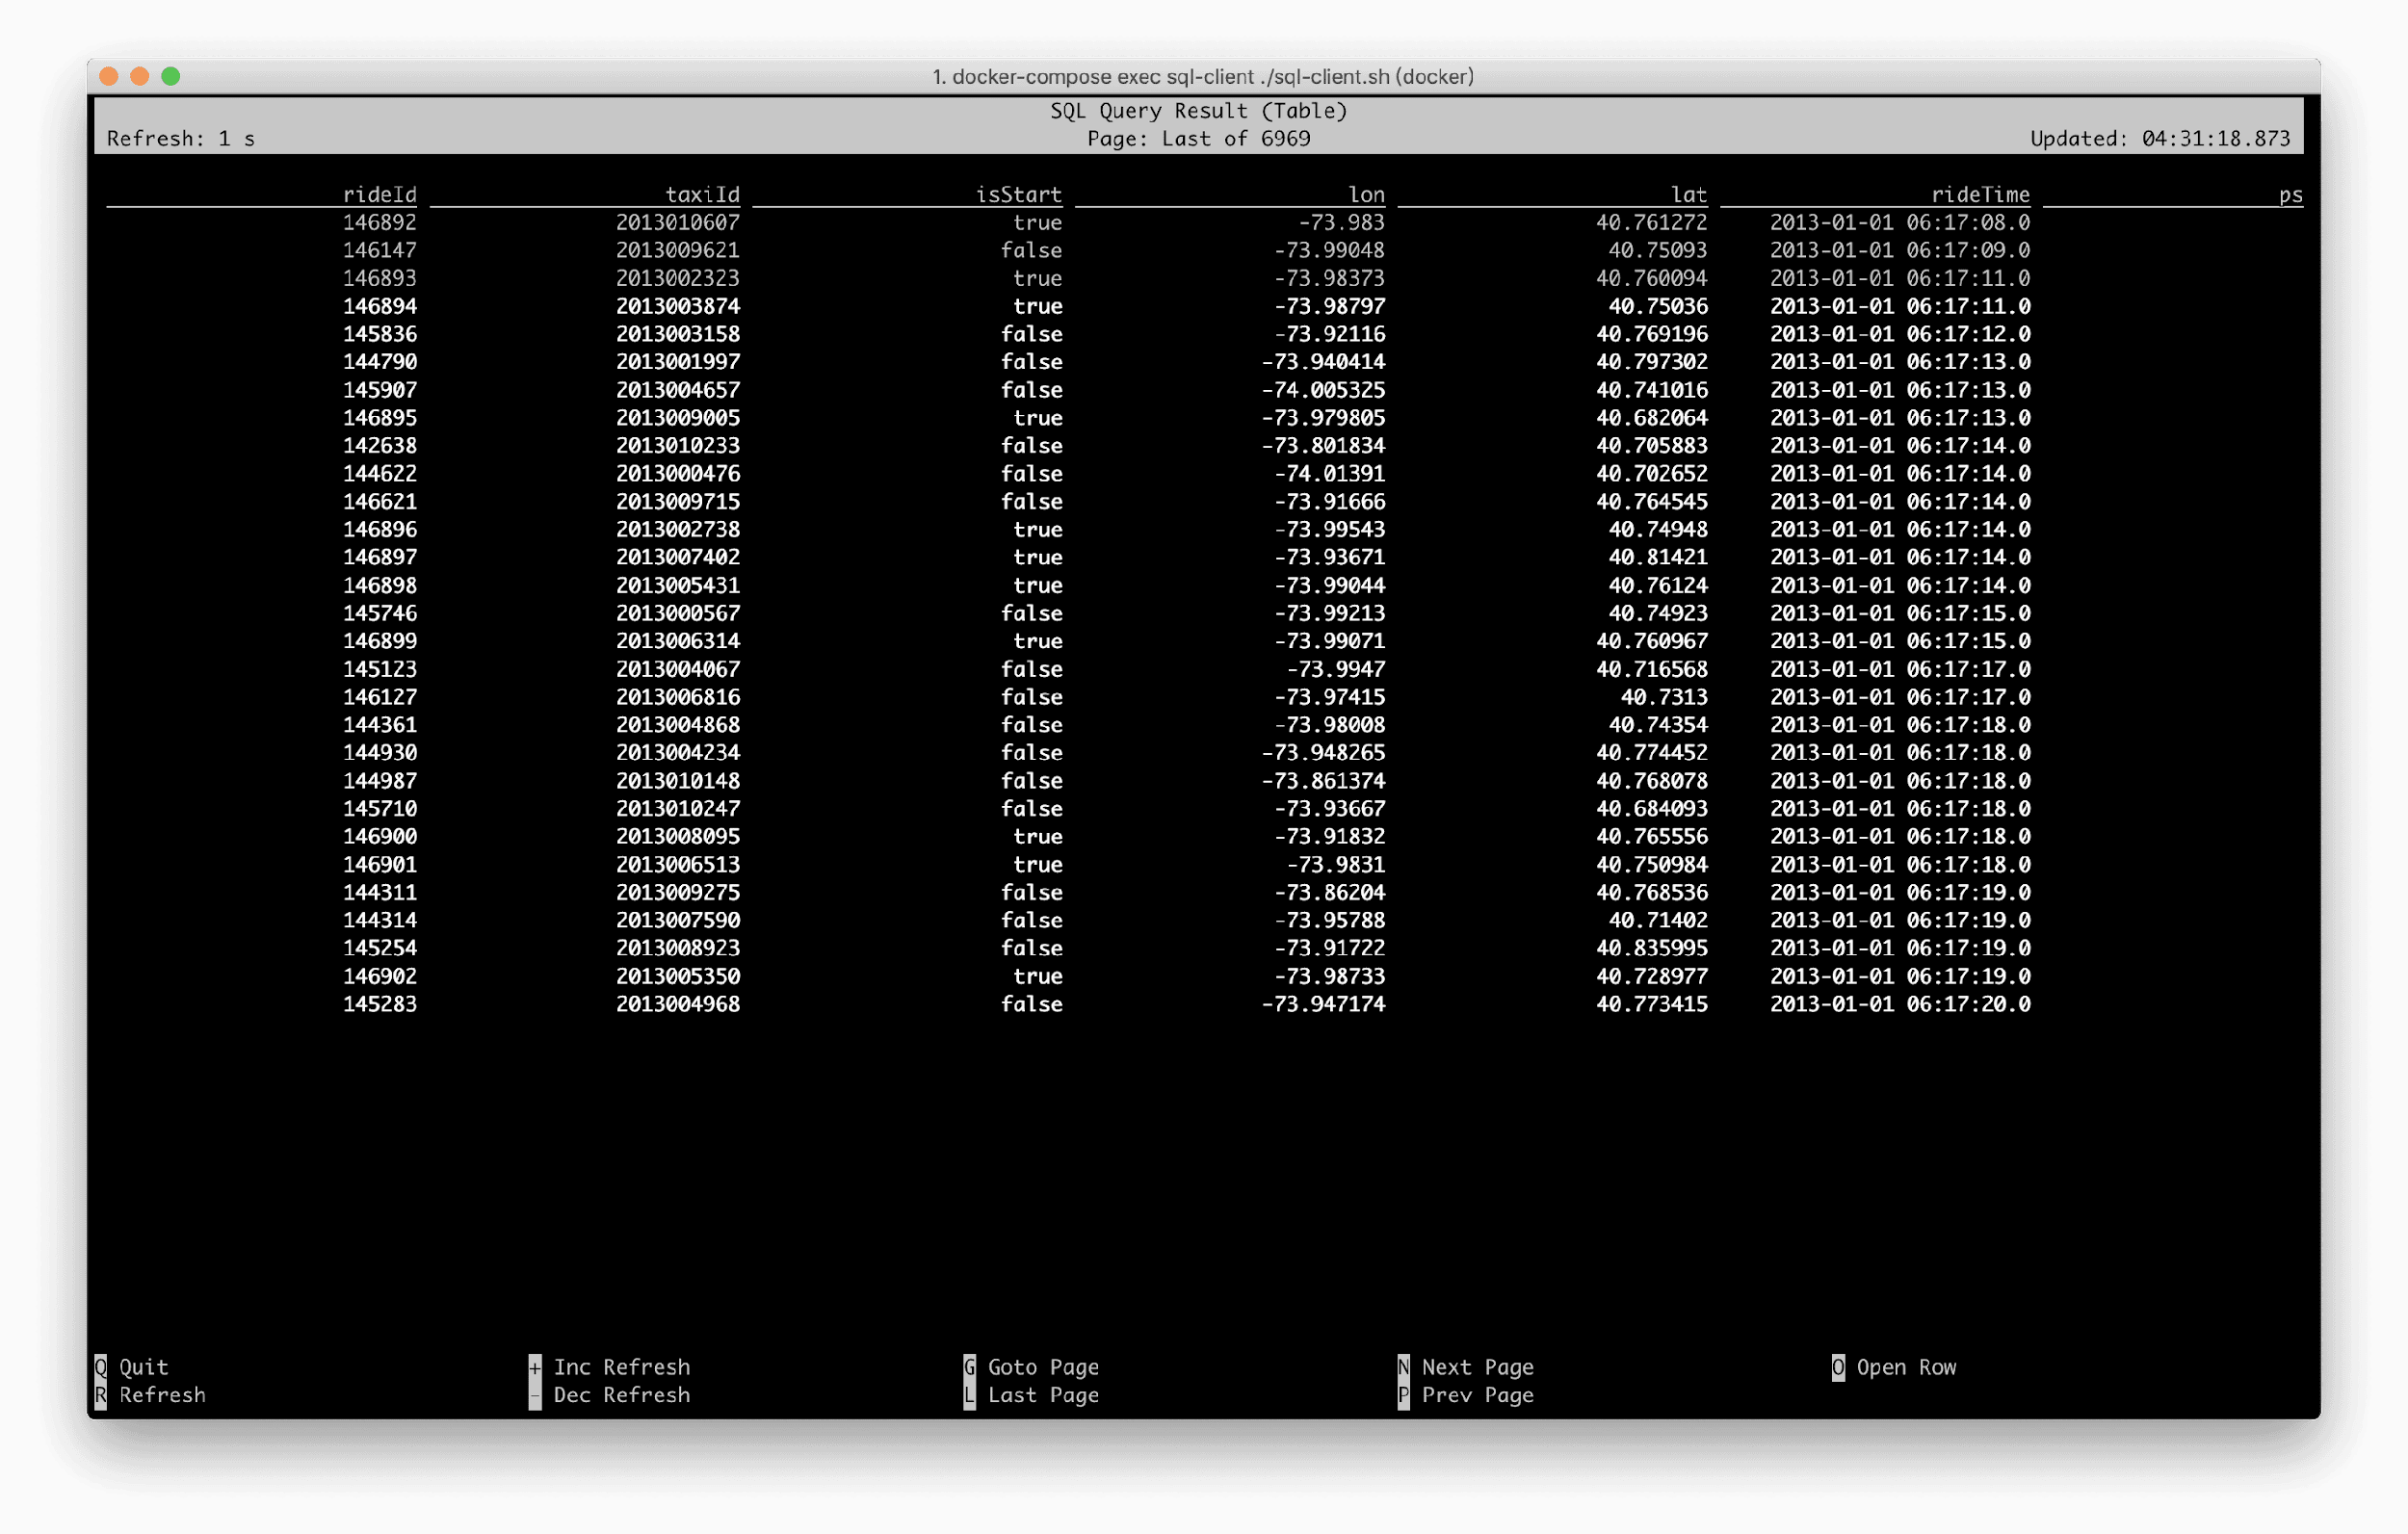
You can also go to http://localhost:8081 to see how the Flink job is running.
Another requirement is computing the number of driving events carrying different numbers of passengers. For example, the number of driving events carrying one passenger, the number of driving events carrying two passengers, and so on. All the while you are exclusively interested in the driving events in New York.
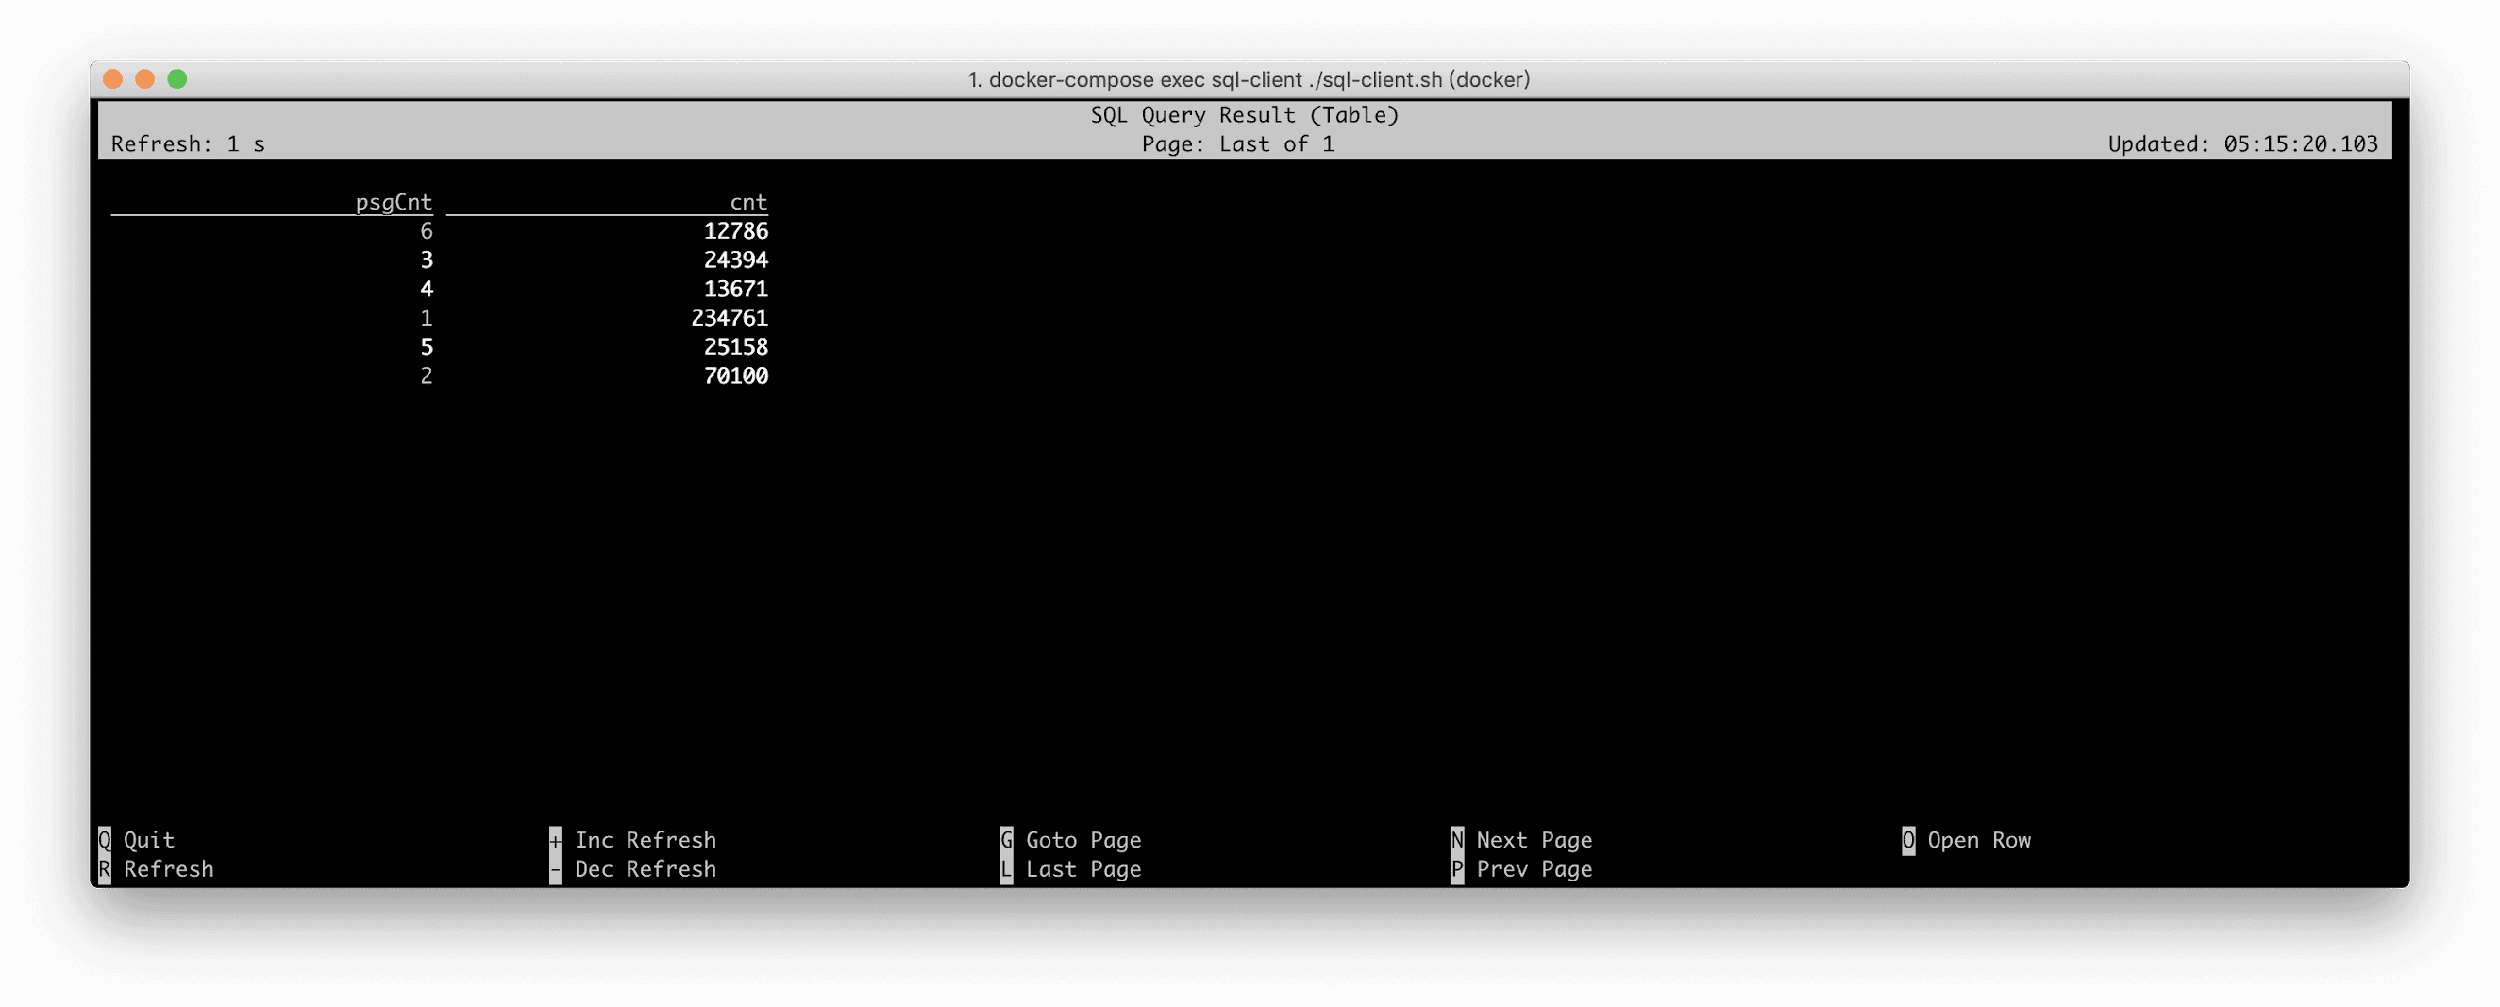
Group the number of passengers by psgCnt, and use COUNT(*) to compute the number of events for each group. Note that you need to filter the driving record data that occurred in New York (isInNYC) before grouping. Run the following query in SQL CLI:
SELECT psgCnt, COUNT(*) AS cnt
FROM Rides
WHERE isInNYC(lon, lat)
GROUP BY psgCnt;
The visualized results of the SQL CLI are as follows; while the results are changing every second, the maximum number of passengers cannot exceed six.
To continuously monitor the traffic flow in New York, you need to compute the number of vehicles that enter each area every five minutes. You want to focus only and mainly on the areas where at least 5 cars enter the city.
This process involves window aggregation (every five minutes), so the Tumbling Window syntax is required.
For each area, you need to group them by AreaId based on the number of entered vehicles. Before grouping, you need to filter driving records of entered vehicles using the isStart field and use COUNT(*) to count the number of vehicles.
Areas with at least five vehicles: This is a filter condition based on statistical values using the SQL HAVING clause.
The final query is as follows:
SELECT
  toAreaId(lon, lat) AS area,
  TUMBLE_END(rideTime, INTERVAL '5' MINUTE) AS window_end,
  COUNT(*) AS cnt
FROM Rides
WHERE isInNYC(lon, lat) and isStart
GROUP BY
  toAreaId(lon, lat),
  TUMBLE(rideTime, INTERVAL '5' MINUTE)
HAVING COUNT(*) >= 5;
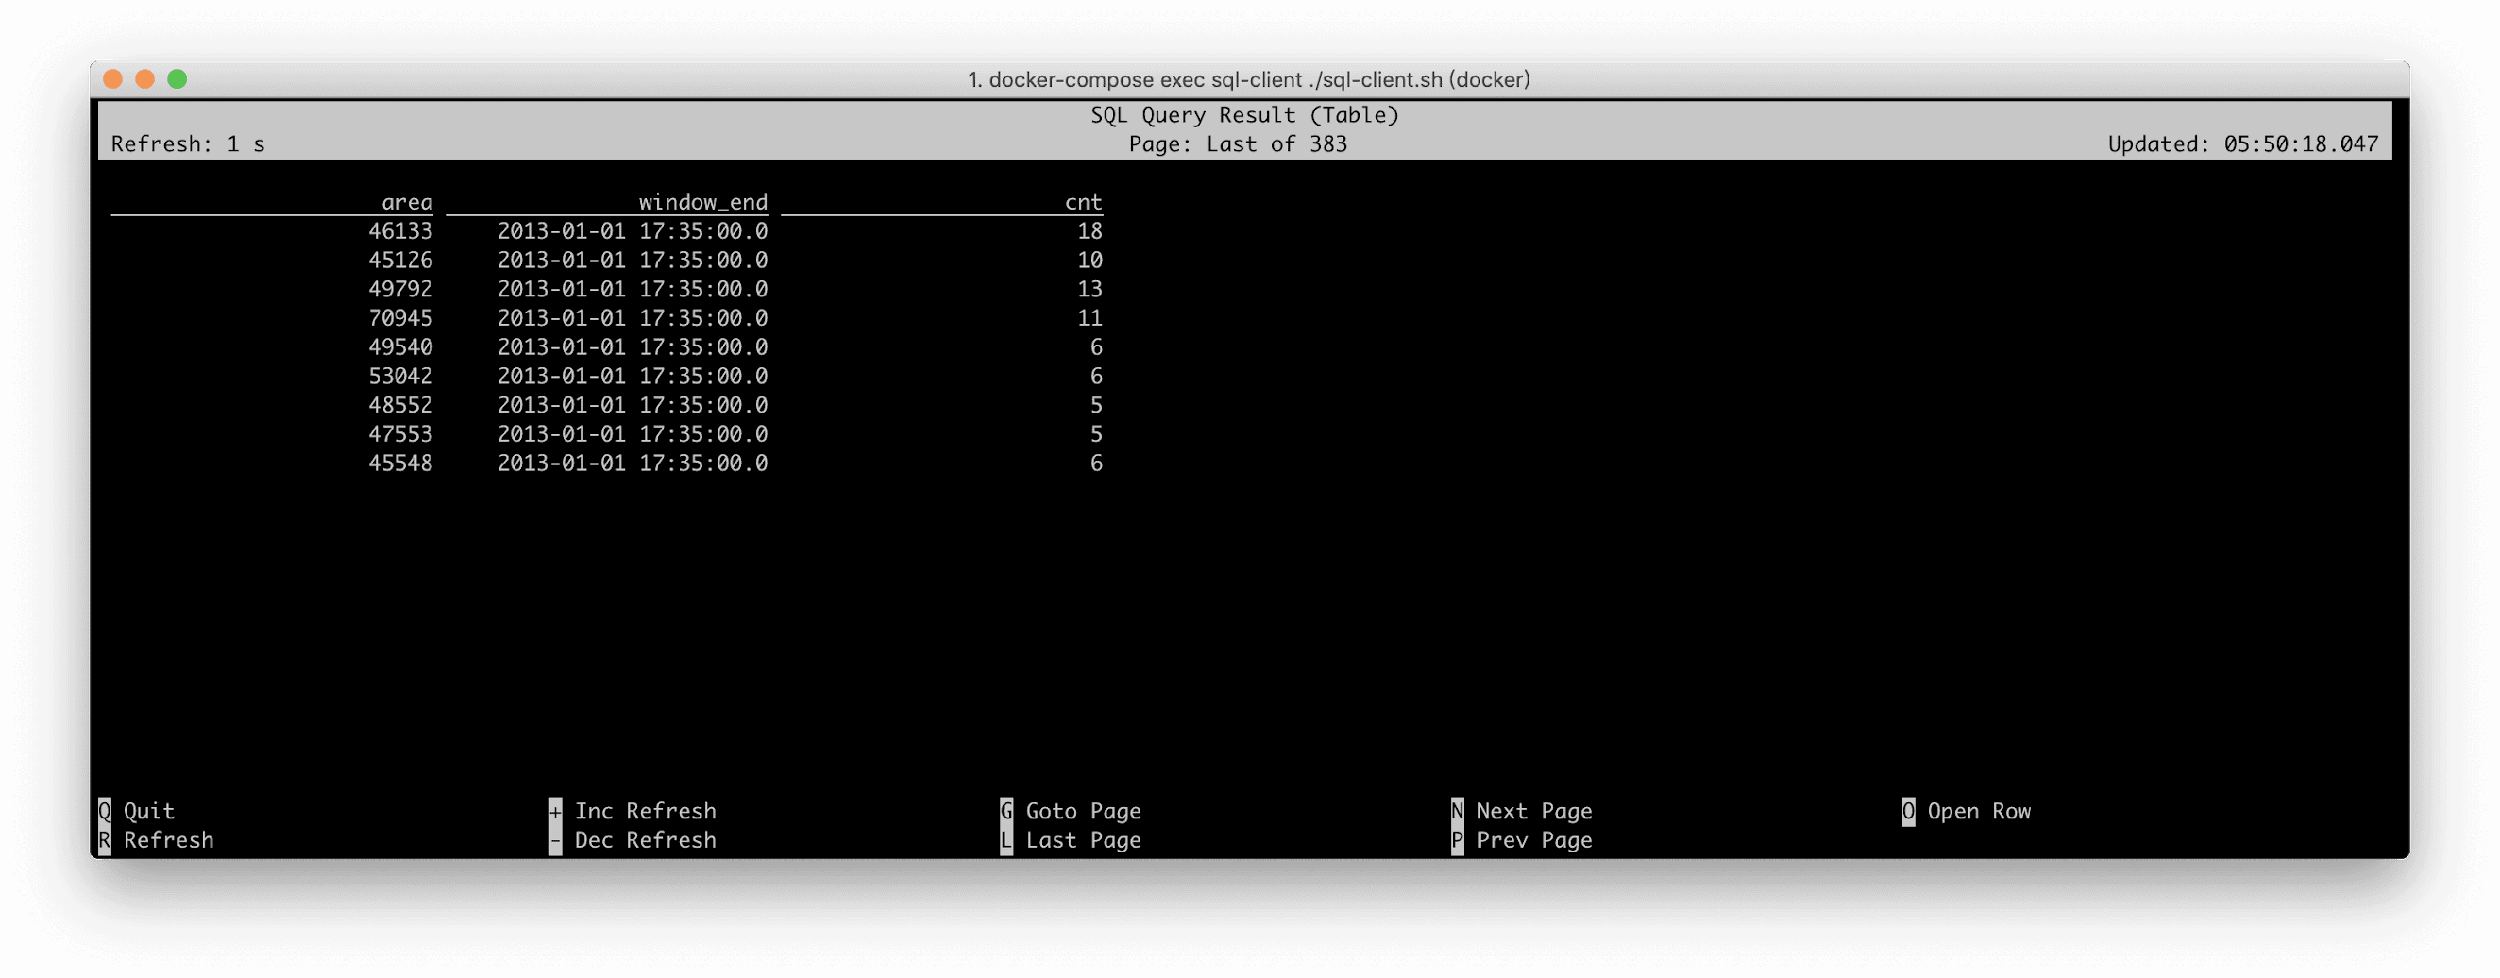
After running the query in the SQL CLI, the visualized results are as follows. The result for each area and window_end will not change after output, but the result with a batch of new windows is output every five minutes.
A batch of new windows is generated every 30 seconds during the demonstration because we have performed 10 times faster by reading the source in the Docker environment (relative to the original speed).
From the results, in example two and example three, you can see that Window Aggregate and Group Aggregate displayed obvious differences. The main difference is that the Window Aggregate output results show only when the window ends, and the output result is the final value, which is not modified. The output stream is an Append stream.
However, the Group Aggregate outputs the latest results every time a piece of data is processed. The results have an updated status, similar to data found in a database, and its output stream is an Update stream.
Another difference is that the windows have watermarks. With this feature, you know exactly which windows have expired to clear the expired state in time to ensure a stable state size.
However, for the Group Aggregate, since it is impossible to know which data has expired, the state size will grow limitlessly, which is not stable enough for production operations. Therefore, configure the State TTL for Group Aggregate jobs.
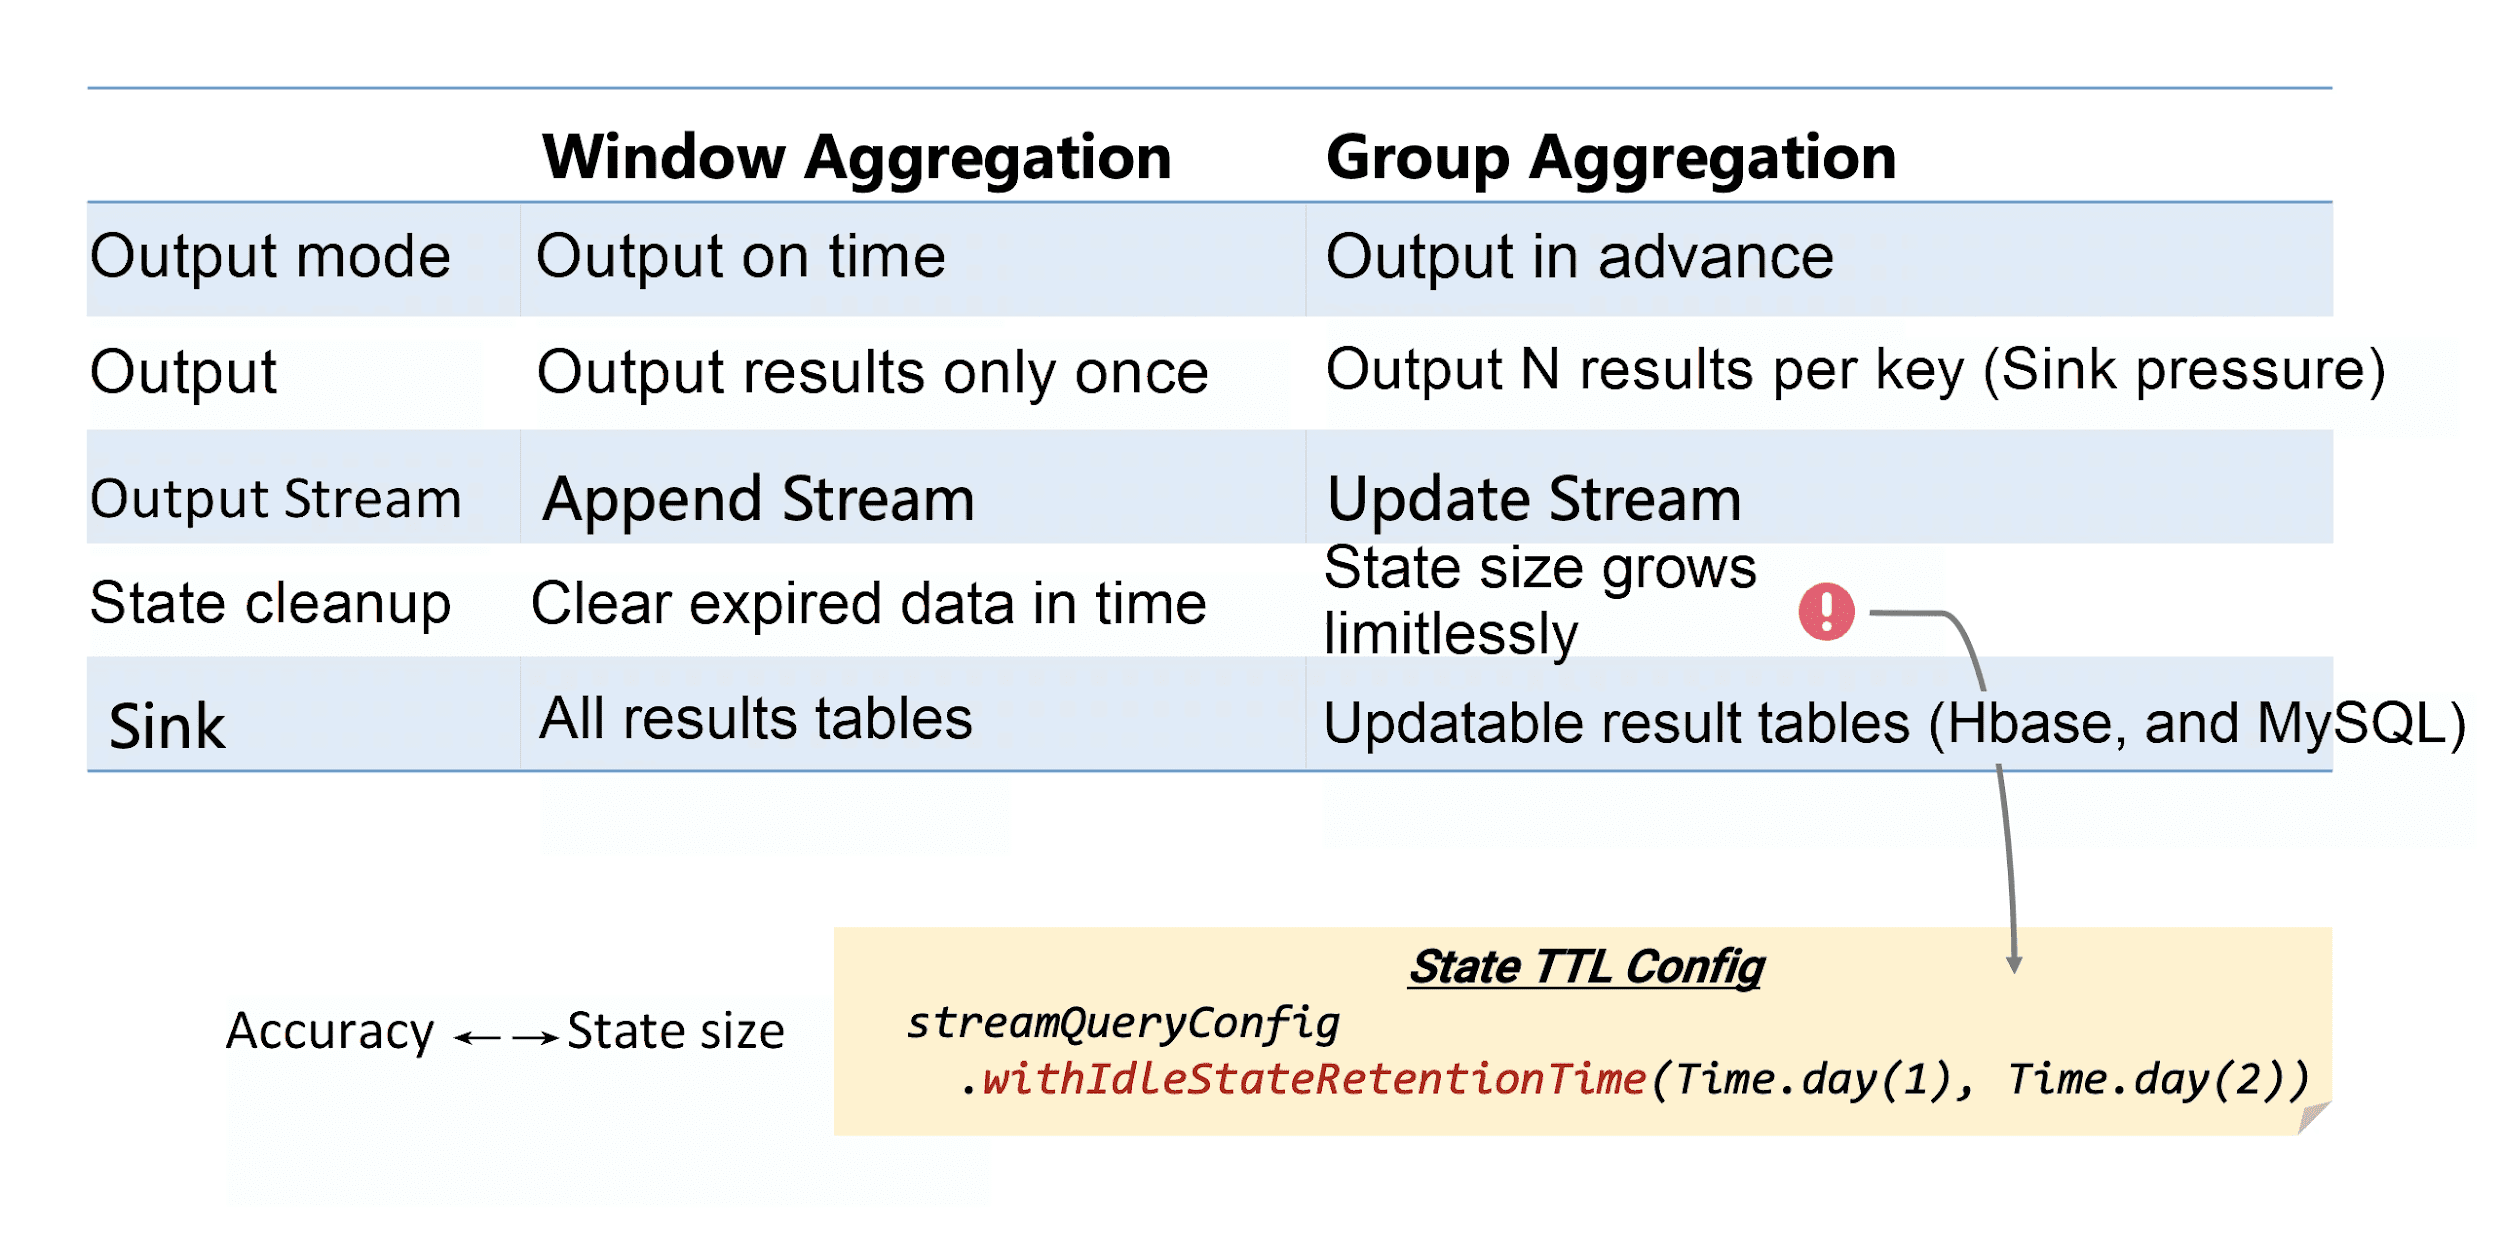
For example, to count real-time PV of each store every day, you need to set TTL to 24+ hours because its previous state from a day ago is generally not used.
SELECT  DATE_FORMAT(ts, 'yyyy-MM-dd'), shop_id, COUNT(*) as pv
FROM T
GROUP BY DATE_FORMAT(ts, 'yyyy-MM-dd'), shop_id
If the TTL value is too small, clearing useful states and data does happen which results in data accuracy issues. This is also a parameter that the user needs to weigh in.
The previous section describes the differences between Window Aggregate and Group Aggregate, as well as the differences between Append and Update streams. In Flink, you can write update streams only to external storage systems that support updates such as MySQL, HBase, and ElasticSearch.
It is possible to write While Append streams to any storage systems and to log systems, such as Kafka.
Let's suppose you want to write the "number of passengers for every 10 minutes" stream to Kafka.
A Kafka result table Sink_TenMinPsgCnts has been predefined (for the complete table definition, see training-config.yaml).
Before executing the query, run the following command to monitor the data written to TenMinPsgCnts topic:
docker-compose exec sql-client /opt/kafka-client/bin/kafka-console-consumer.sh --bootstrap-server kafka:9092 --topic TenMinPsgCnts --from-beginningThe Tumbling Window can describe the number of passengers for every 10 minutes. You can use the INSERT INTO Sink_TenMinPsgCnts command to directly write the query results into the result table.
INSERT INTO Sink_TenMinPsgCnts
SELECT
  TUMBLE_START(rideTime, INTERVAL '10' MINUTE) AS cntStart,
  TUMBLE_END(rideTime, INTERVAL '10' MINUTE) AS cntEnd,
  CAST(SUM(psgCnt) AS BIGINT) AS cnt
FROM Rides
GROUP BY TUMBLE(rideTime, INTERVAL '10' MINUTE);
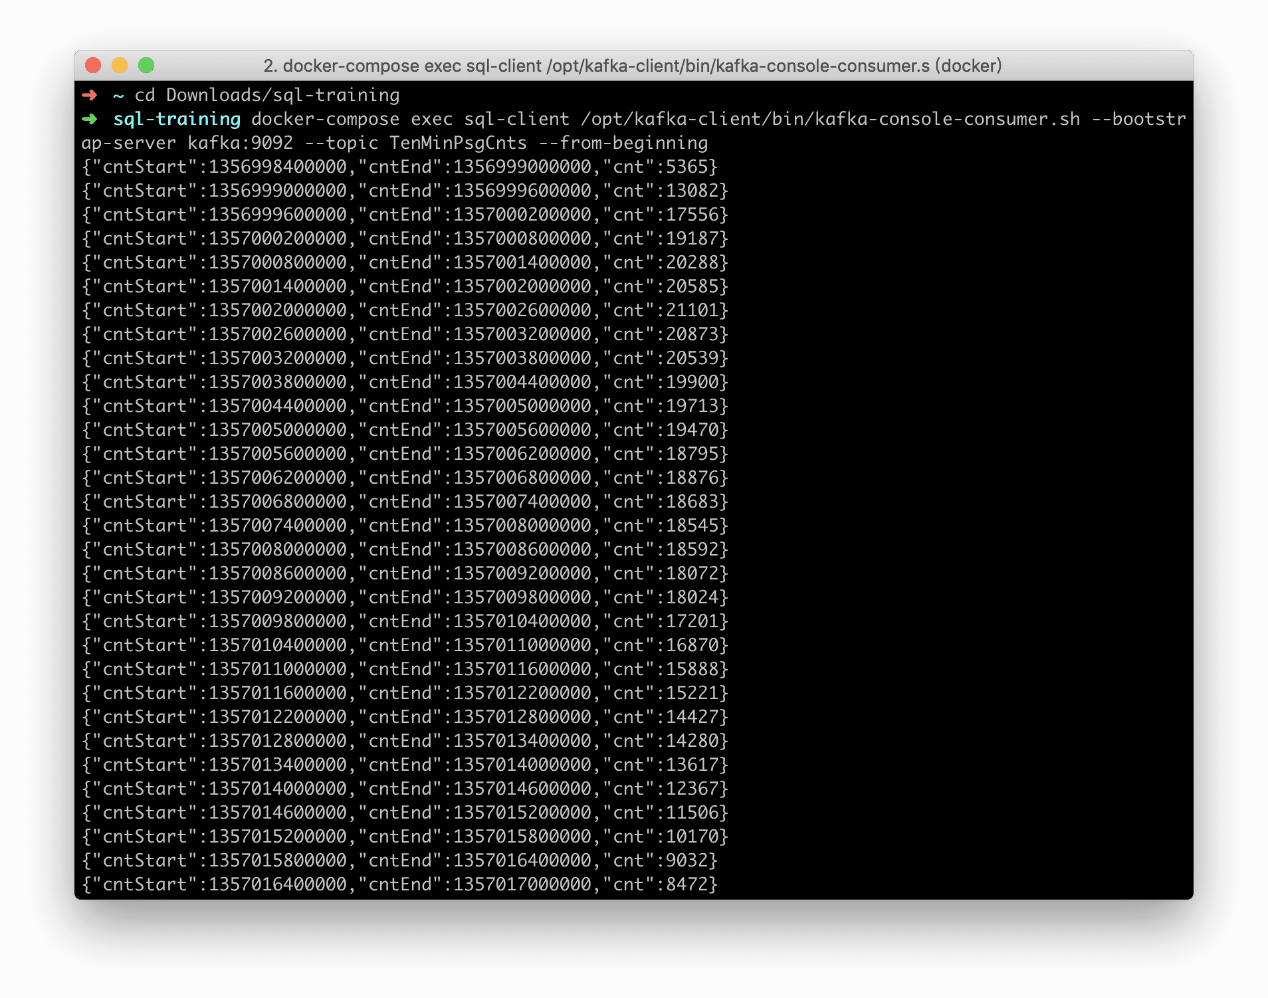
As seen above, write TenMinPsgCnts data topic to Kafka in JSON format:
Finally, write an update stream, which is continuously updated, to ElasticSearch (ES). You would want to write the "number of vehicles departing from each area" stream to ES.
An ElasticSearch result table Sink_AreaCnts has been predefined (for the complete table definition, see training-config.yaml). This table contains only two fields: areaId and cnt.
Similarly, you also use INSERT INTO to write the query results directly to the Sink_AreaCnts table.
INSERT INTO Sink_AreaCnts
SELECT toAreaId(lon, lat) AS areaId, COUNT(*) AS cnt
FROM Rides
WHERE isStart
GROUP BY toAreaId(lon, lat);
After you run the preceding query in SQL CLI, Elasticsearch automatically creates the area-cnts index. Elasticsearch provides a REST API. You can visit the following URLs.
http://localhost:9200/area-cnts;http://localhost:9200/area-cnts/_stats;http://localhost:9200/area-cnts/_search;http://localhost:9200/area-cnts/_search?q=areaId:49791;As the query continues to run, you can also observe that some statistical values (_all.primaries.docs.count and _all.primaries.docs.deleted) are constantly increasing: http://localhost:9200/area-cnts/_stats
This article helps to guide you through using Docker Compose and to get started with Flink SQL programming quickly. It also compares the differences between Window Aggregate and Group Aggregate, and it introduces how to write these two types of jobs to external systems.
If you are interested, you can perform more in-depth practices based on the Docker environment, such as running your own UDF, UDTF, and UDAF, and querying other built-in source tables.
Flink 1.9: Using SQL Statements to Read Data from Kafka and Write to MySQL

206 posts | 56 followers
FollowApache Flink Community China - December 25, 2019
Apache Flink Community China - September 27, 2020
Apache Flink Community China - August 2, 2019
Apache Flink Community China - August 11, 2021
Apache Flink Community China - December 25, 2019
Apache Flink Community China - September 27, 2020

206 posts | 56 followers
Follow ACK One
Provides a control plane to allow users to manage Kubernetes clusters that run based on different infrastructure resources
Learn More Container Registry
A secure image hosting platform providing containerized image lifecycle management
Learn More Super App Solution for Telcos
Alibaba Cloud (in partnership with Whale Cloud) helps telcos build an all-in-one telecommunication and digital lifestyle platform based on DingTalk.
Learn More ApsaraDB RDS for SQL Server
An on-demand database hosting service for SQL Server with automated monitoring, backup and disaster recovery capabilities
Learn MoreMore Posts by Apache Flink Community