By Yanfu
Before discussing the content, I want to discuss why we need to develop an alert platform.
First of all, as more enterprises move to the cloud, various monitoring systems will be required. Among them, SkyWalking specializes in tracing, Prometheus specializes in matches, and ES or Cloud Log Service specializes in log-related monitoring. There are at least three systems on top of the monitoring platforms of cloud platforms, such as Cloud Monitor. If those monitoring platforms do not have a unified configuration of alerts, they need to maintain a set of contacts in each system, which leads to a complicated management problem. At the same time, it will be very difficult to form contextual associations. For example, if an interface has a problem, the dial test of Cloud Monitor and the logs of Log Service may be raising the alert. Also, the Application Real-Time Monitoring Service (ARMS) is raising the alert. These alerts are not connected, which is a big pain point for developing an alert platform on the cloud.
Secondly, invalid alerts occur frequently. What is an invalid alert? When a serious fault occurs in a business system, related alerts may also occur in associated systems. Moreover, too many related alerts will overwhelm the key information, causing personnel of the operations and maintenance to be unable to handle the alerts in time. Finally, many alerts often occur now, but no one handles them. Even if someone handles them, how is the handling situation? How long does it take for a critical alert to be fixed from the time it occurs? How many people are handling it every day? Can the MTTR of enterprises be calculated? Those are also the problems to be solved by the unified alert platform we need to develop.
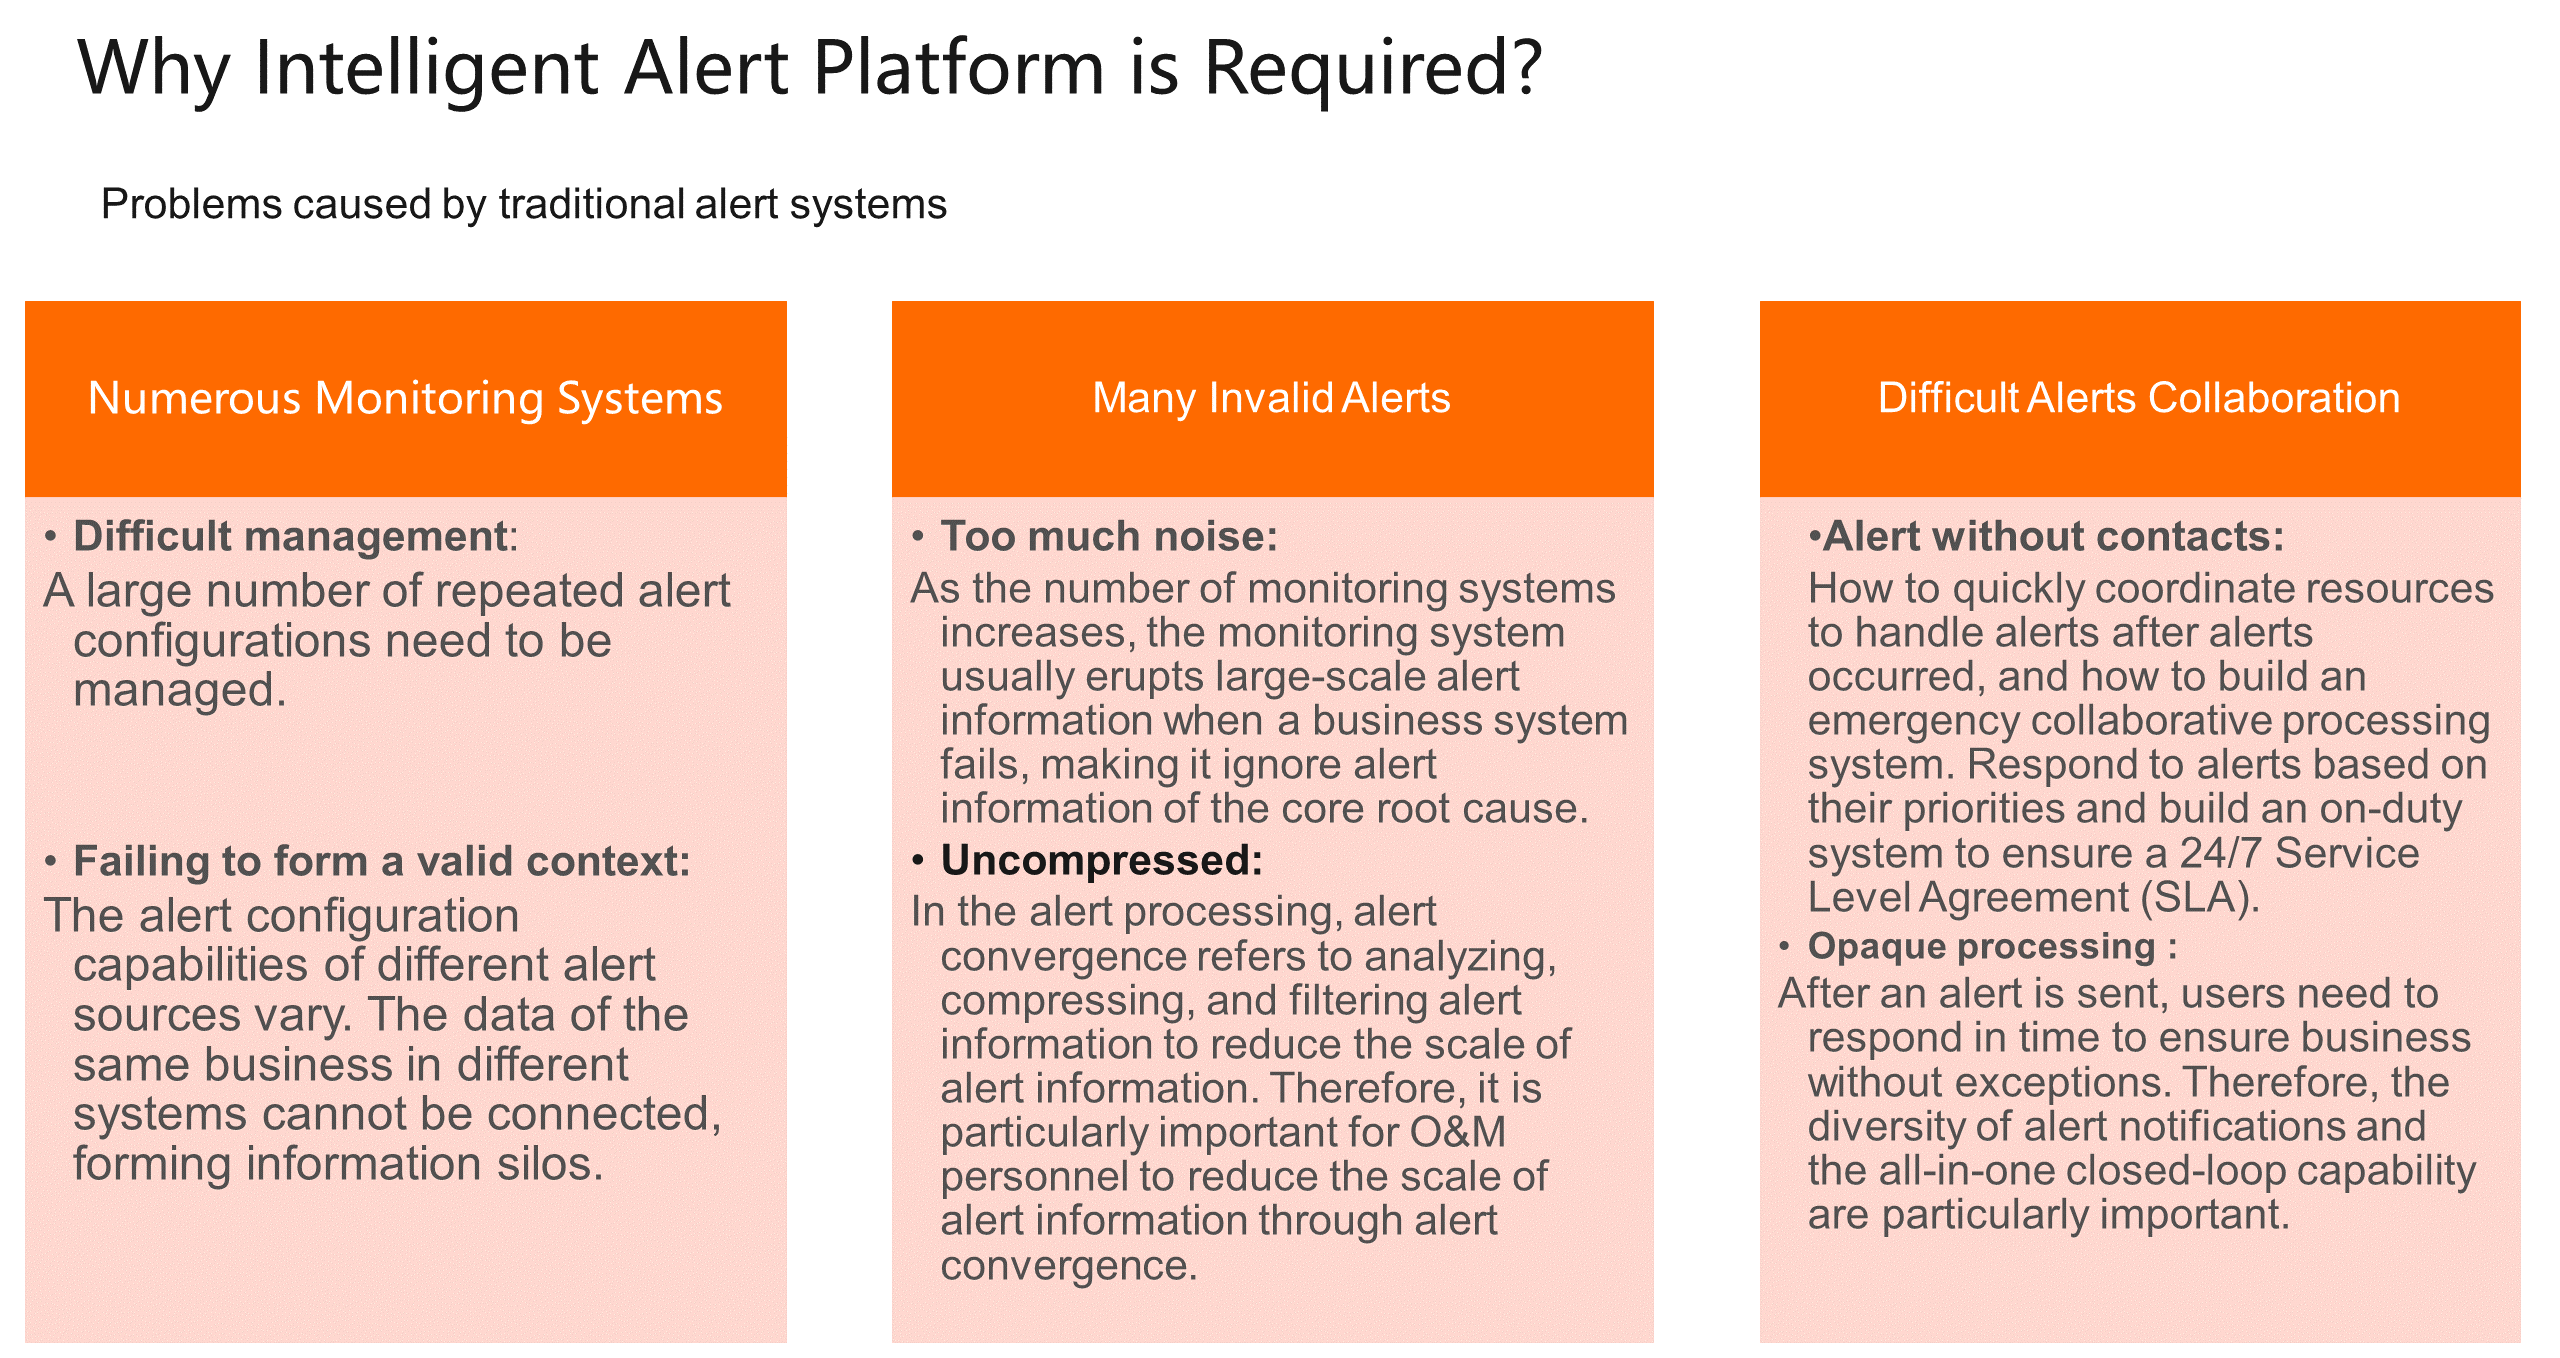
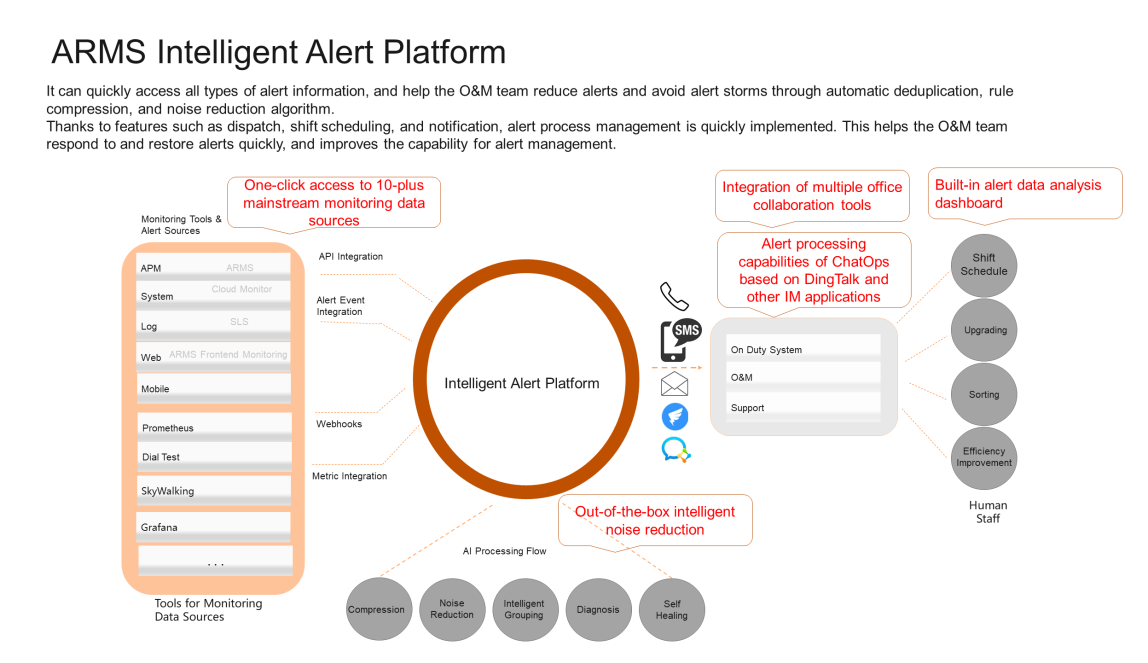
The intelligent alert platform of ARMS was developed to solve the three problems above.
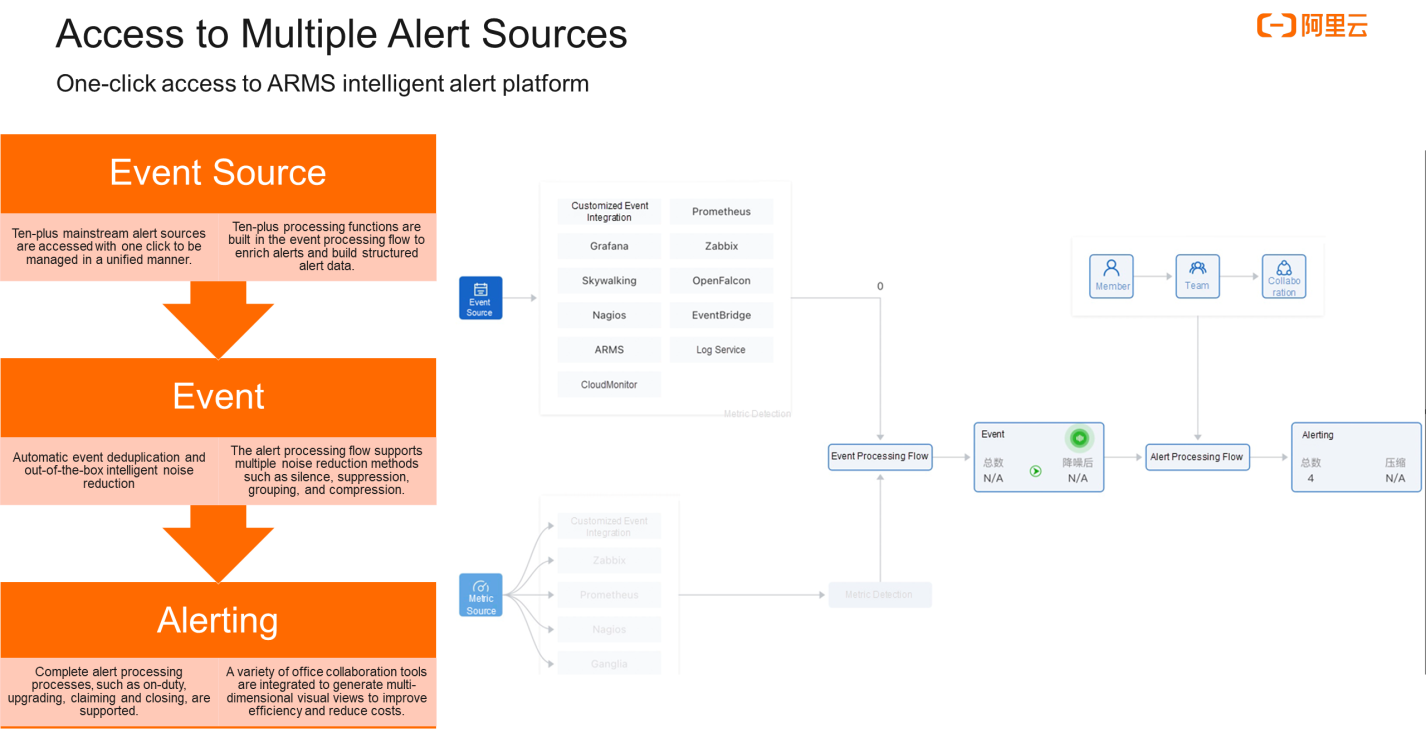
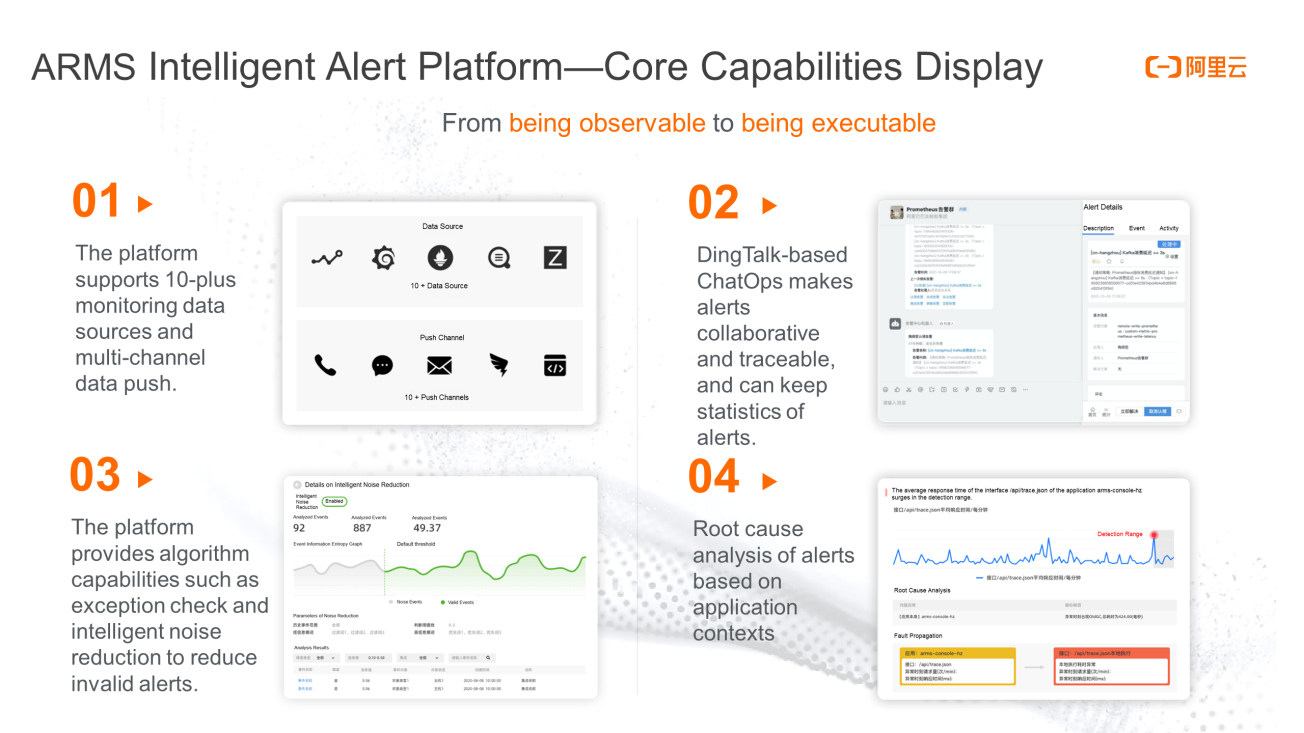
The intelligent alert platform of ARMS integrates many monitoring systems, including its own application monitoring, Cloud Monitor, and Log Service, and more than a dozen monitoring systems, providing out-of-the-box capabilities for intelligent noise reduction. At the same time, the entire collaborative workflow can be placed on IM tools, such as DingTalk, and users can more conveniently process alerts related to operations and maintenance to collaborate more efficiently. Finally, the alert analysis dashboard is provided to help users analyze whether alerts are being handled every day and what the handling situation is.
How many steps are required to form the abstract concept of alerting in your mind?
First, an alert event is generated from the event source. The event is in the state before the alert is sent. The event is not sent directly. It needs to be matched with the alert contact before the alert process can be generated. The following figure briefly depicts the alert process. This is also a common problem that many colleagues encounter when using the system. In spite of configuring the event, they do not know how to generate an alert. It is indispensable to add contacts to events to generate alerts.
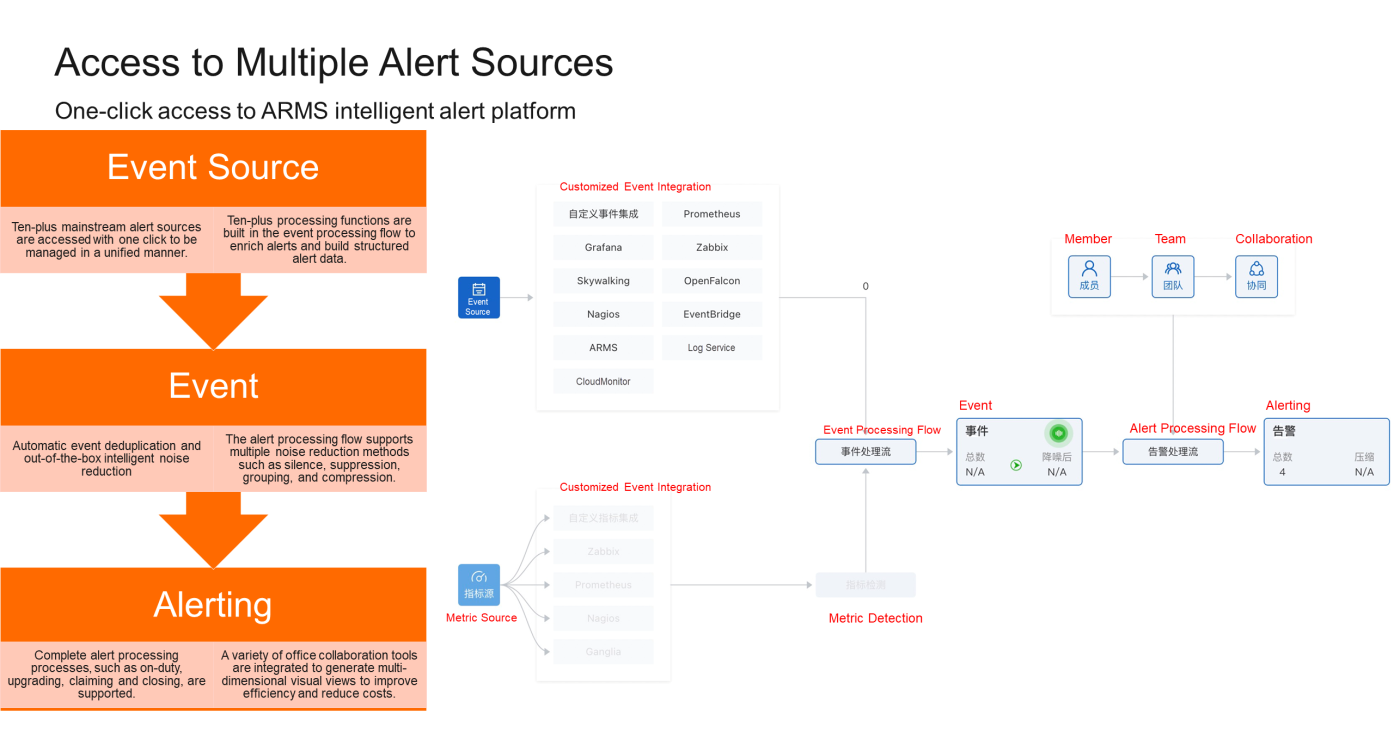
Alert systems used widely are not ingested by default. We also provide flexible ingesting methods of alert event sources. The event can be transmitted according to customized access methods. We will clean fields and ingest an alert that can be understood by the alert platform.
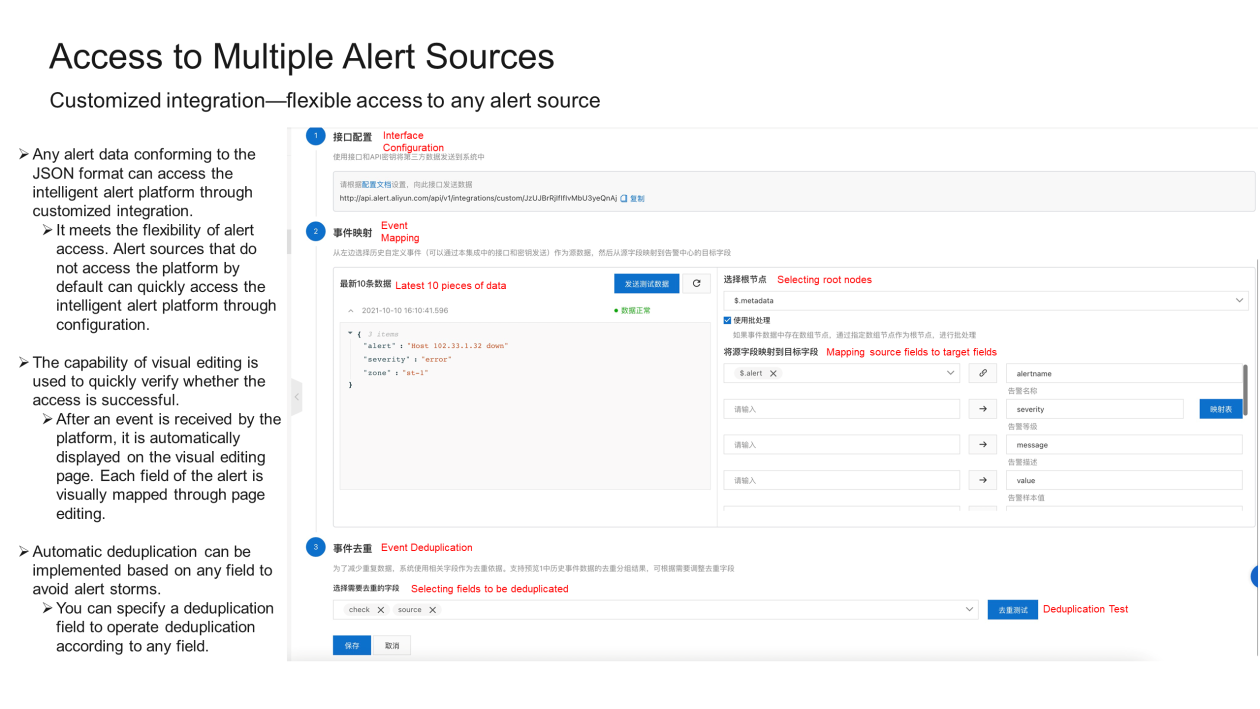
Let's take the work order system as an instance. When you want to send important events generated in the system to the alert platform, you can send alert events of the work order system to the alert platform through webhooks. After identifying and setting the relevant content, you are supposed to notify the corresponding contact by phone calls or text messages. In nature, the alert platform accepts events and allocates information related to the alert team to the alert platform to help users match and send events to contacts of the team.
Next, this article shows how the capability is realized and which features it has on the interface.
First, open the ARMS console and scroll down to the alert management module at the bottom. We can see an overview, which includes most of the access process, event handling process, etc.
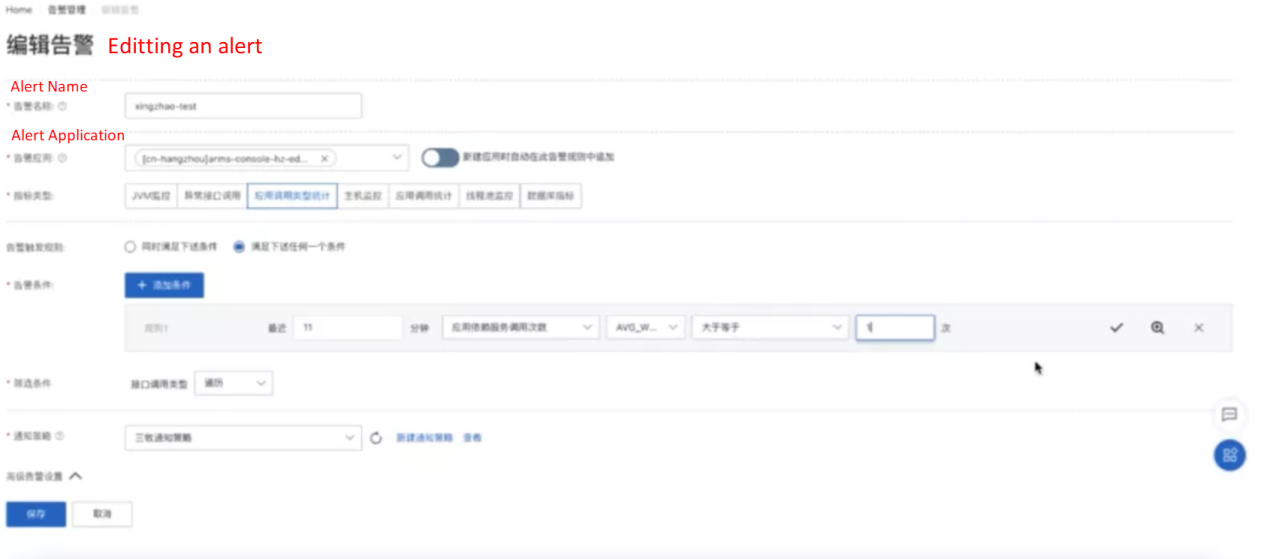
Users that have used ARMS can directly create an alert rule within the system first. The condition is the application response time. When the number of calls is bigger than one, it will generate an event.
If it is an open-source SkyWalking or other services, you need to set alert rules and transmit the corresponding events. After transmitting events, the corresponding alert event can be seen in the list of alert events.
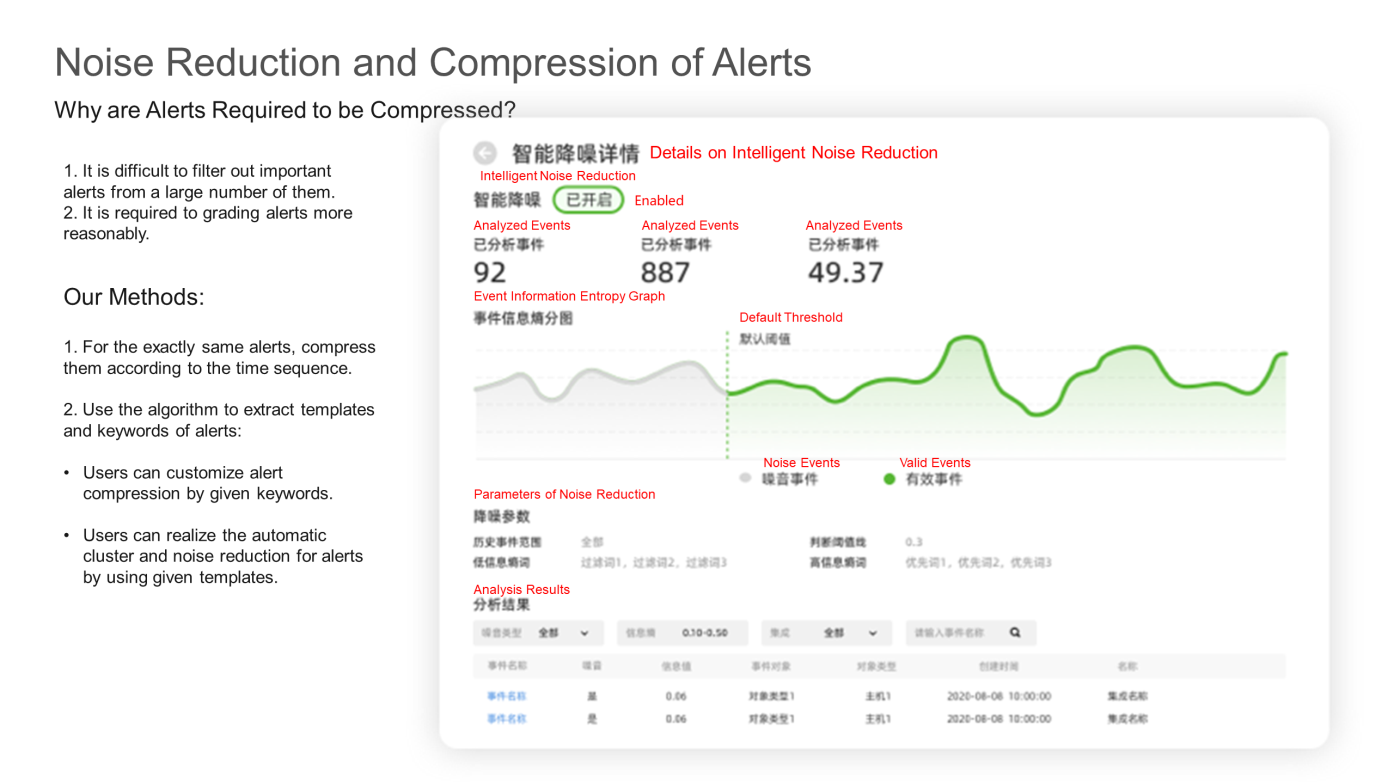
After the alert event is sent, the system will operate noise reduction processing on the alert event, recognize what the most keywords currently among alerts are, which keywords are highly repetitive, or which contents are highly matched. Meanwhile, the system compresses the alerts according to the keywords we input. For example, if you do not want to receive an alert from the test environment, you can use the word test as a masking word. Therefore, the alert event will not raise a second alert about features with test-related masking words.
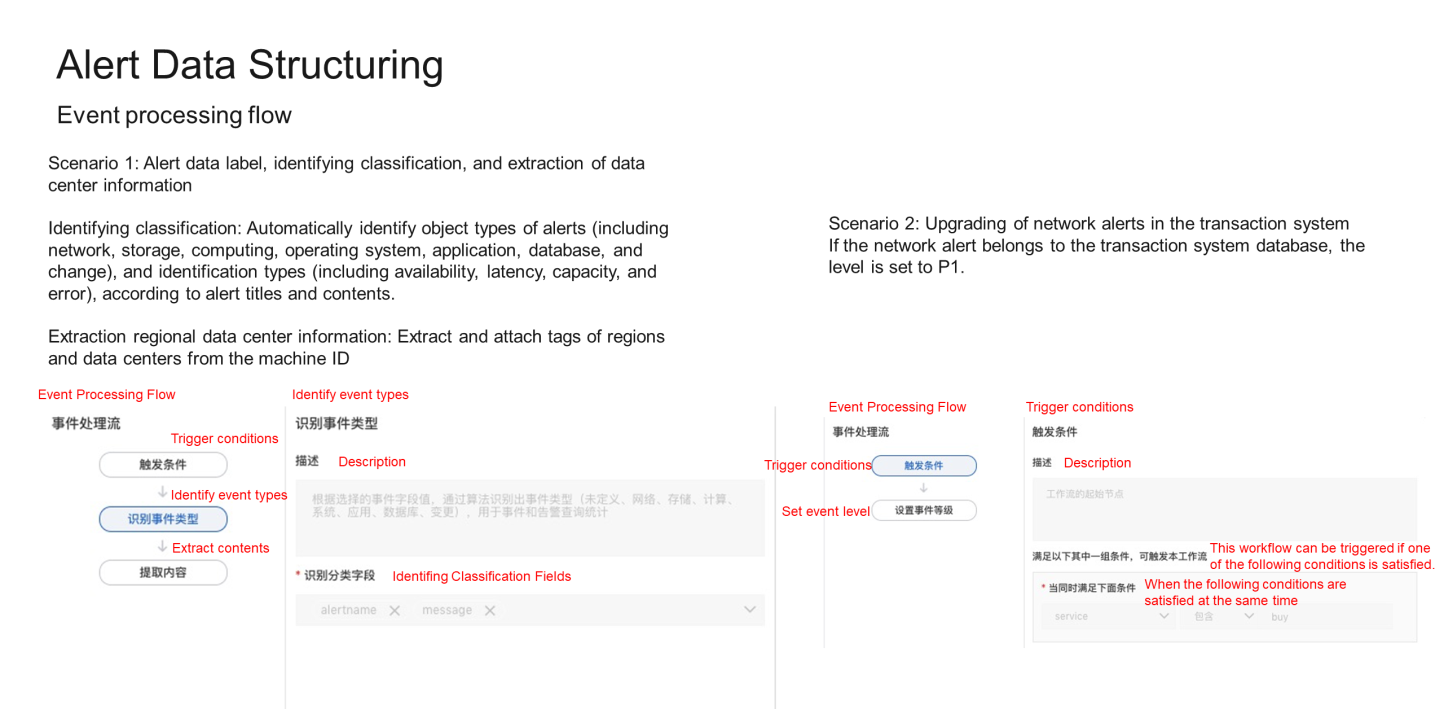
After the alert event is transmitted, the entire data will be placed in the event pool. These events need to be allocated, including who will receive these events and who will notify and operate the schedule management. If you match pre-made fields in the alert according to the alert name or other fields and match the exception of the pod status, it will generate an alert.
After the alert is generated, relevant contacts can be configured among the contacts. For example, you can import an address book or match DingTalk robots. In the general policy, you can realize further configuration by appointing a robot or person to receive alerts. It can also connect the work order system, such as Jira and other platforms, to ensure that information can be transmitted to those platforms.
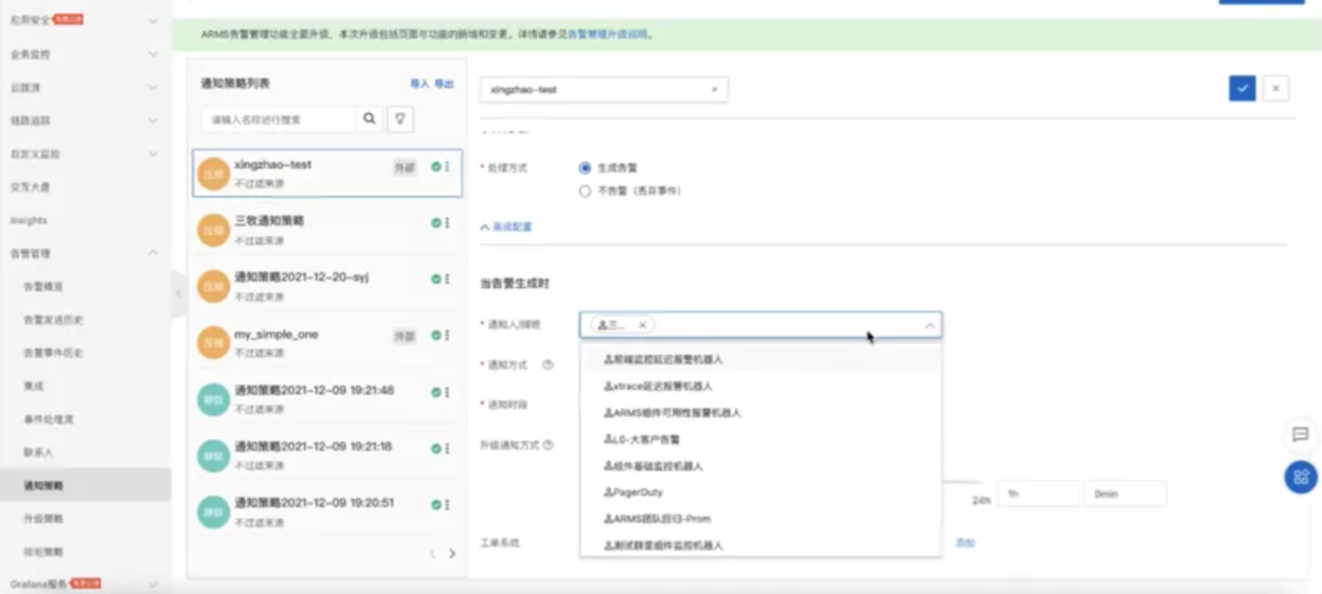
After the notification policy is configured, once an alert is generated, related alerts can be received. We recommend using DingTalk to receive related alerts.
Here is how to receive related alerts through DingTalk. For example, this is a related alert we received on DingTalk. After receiving this alert, you only need to have an account on DingTalk for this alert message to directly claim this alert, without the requirements of understanding relevant information or logging on to the system. Since it is deeply integrated with the DingTalk system, the alert can be claimed or solved after the alert is claimed.
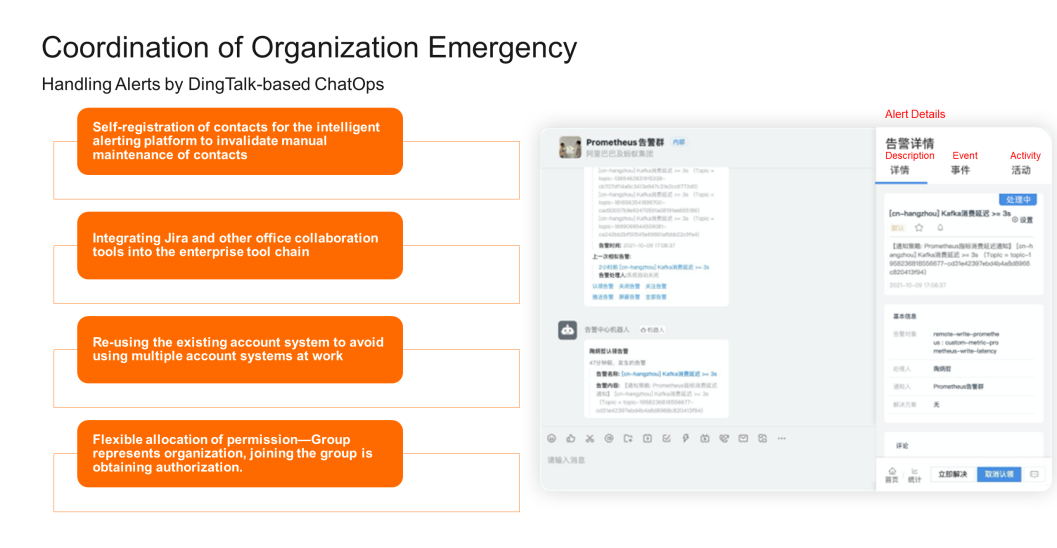
We will record the process in the activity. You will know the whole process of claiming and closing the alert. At the same time, statistics will be made every day (such as the number of alerts that occurred today), whether they have been processed, which have not been processed, and how the overall situation is. If the team is relatively large with many staff of the operations and maintenance that respectively operate L1 and L2 operations and maintenance, the team can take advantage of the feature of shift scheduling to schedule online. For example, one team member receives alerts this week, and another team member receives alerts next week. Meanwhile, the team can also manage the scheduling of upgrade strategies. When no one claims the important alert within ten minutes, the important alert will be accordingly upgraded.
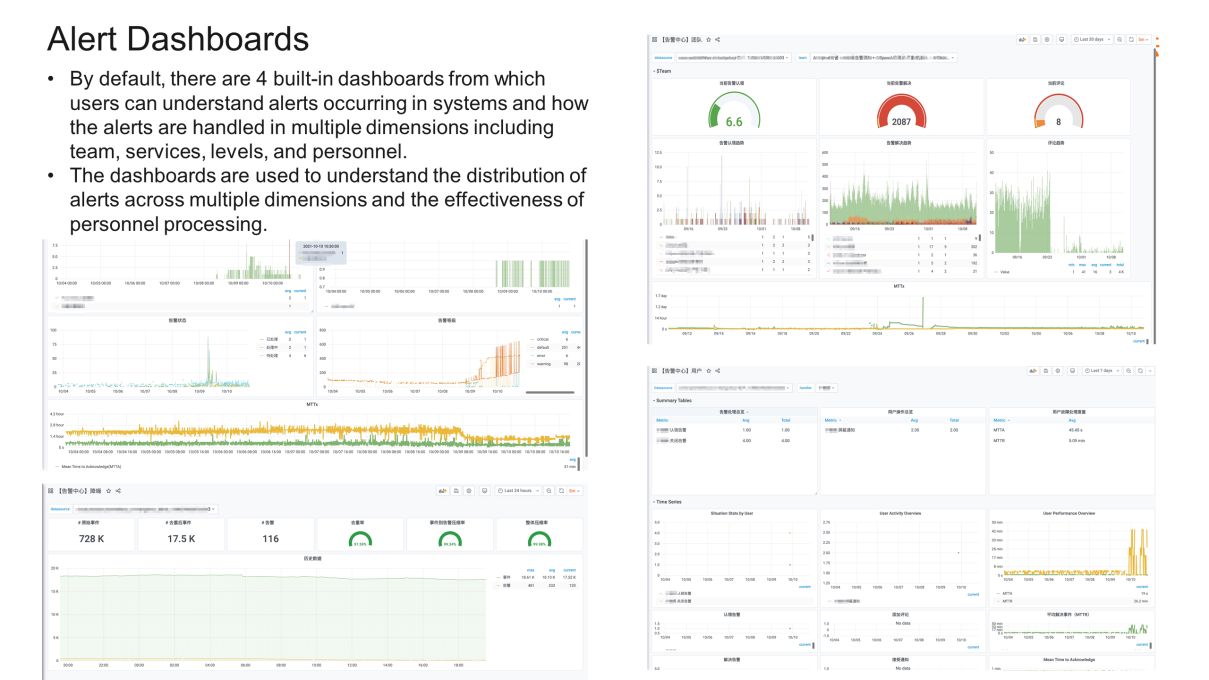
If you are a supervisor or director of operations and maintenance, you need to know whether so many alerts are in convergence after a period of time or whether the average MTTR is improved after using these tools. We provide an alert dashboard that allows you to learn the average response time and how alerts are processed every day. MTTR-related time and other statistics will be displayed on this dashboard. At the same time, this dashboard is integrated into Grafana. You can put relevant data on the Grafana or Prometheus data source for secondary development according to your needs.
Alerting is not only a process of management and collection. Most of the time, only an alert is found. Can Alibaba Cloud provide some suggestions for reference during the process of alerts? In this regard, we have also provided corresponding features to enhance this capability.
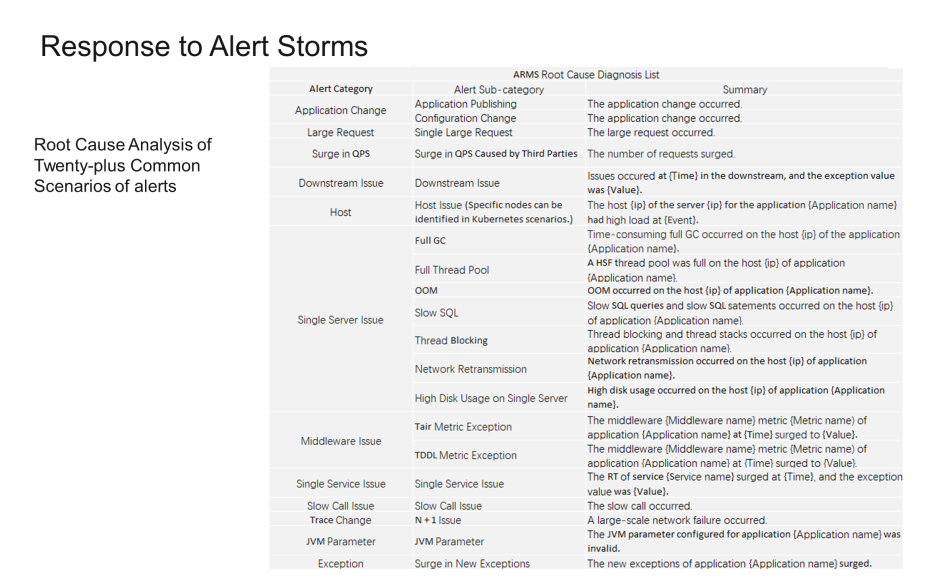
First, we provide a series of default alert capabilities based on application-monitoring-like products. Once relevant alerts are generated, we will provide relevant diagnostic capabilities. As shown in the preceding figure, automatic diagnosis reports are provided in more than 20 scenarios.
For example, if the response time of the application experiences a surge, we will generate an intuitive report. According to this report, you will know what caused the current surge. Then, the system will detect the factors that caused the surge in this application. Generally speaking, this diagnostic logic is the same as the ordinary diagnostic logic. In terms of the surge in the application, the system will check whether there is a surge in multiple hosts and then whether there is a surge in interfaces. If the data characteristics of the response time of these interfaces are consistent with the whole application, the system will further analyze which methods surge in this interface, what the transmitted input parameters are, and why such a surge happens. Meanwhile, we will also provide some feature requests to tell users how slow requests run.
Let's take version.JSON interface as an example. It has a similar surge in the application at the corresponding moment. This is the main core method, which leads to the slow response of interfaces.
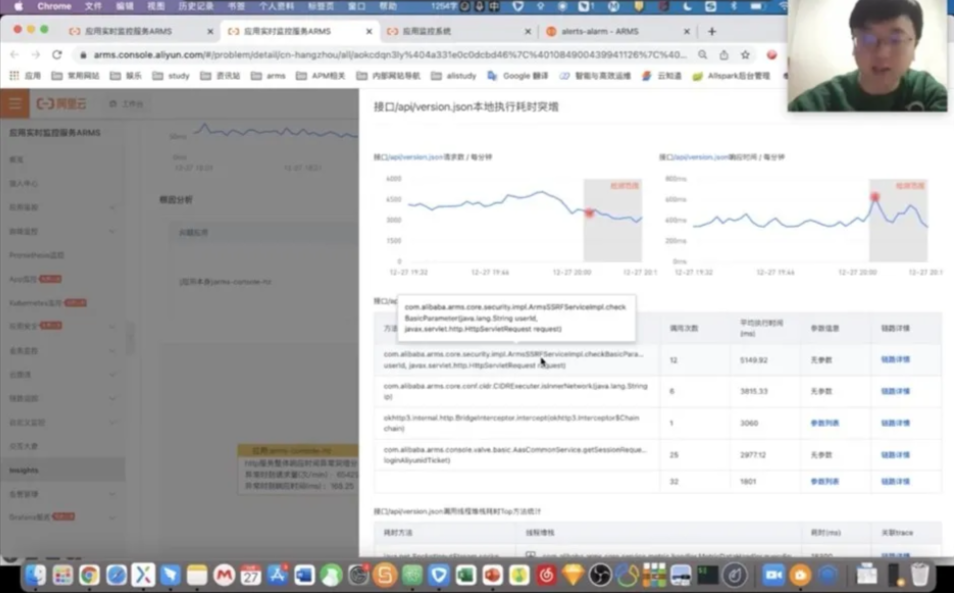
At the same time, we can reconfirm with the stack typed at that time that it was a handler method causing the slowness of interfaces. Then, we can further optimize it with the code.
This is a case of in-depth analysis of common problems with the insight of ARMS. Based on reports, ARMS can quickly integrate contexts, including Prometheus Monitoring for monitoring. The related data of frontend monitoring will also be integrated into reports to conduct all-around detection to converge related problems.

212 posts | 13 followers
FollowAlibaba Cloud Serverless - November 27, 2023
Alibaba Cloud Native Community - July 26, 2022
Alibaba Cloud Native Community - January 19, 2026
Alibaba Cloud Community - October 19, 2021
Alibaba Cloud Community - July 15, 2022
Alibaba Cloud Native Community - November 27, 2025

212 posts | 13 followers
Follow Application Real-Time Monitoring Service
Build business monitoring capabilities with real time response based on frontend monitoring, application monitoring, and custom business monitoring capabilities
Learn More Managed Service for Grafana
Managed Service for Grafana displays a large amount of data in real time to provide an overview of business and O&M monitoring.
Learn More Bastionhost
A unified, efficient, and secure platform that provides cloud-based O&M, access control, and operation audit.
Learn More Managed Service for Prometheus
Multi-source metrics are aggregated to monitor the status of your business and services in real time.
Learn MoreMore Posts by Alibaba Cloud Native