By Chengming Xu (Jingxiao)
In today's digital economy, cloud computing has become an essential infrastructure integrated into people's daily lives. Stability is not only a basic requirement for cloud products but also a crucial factor for the interests of customers and even the survival of businesses. This article focuses on the practical implementation rather than the methodology, sharing the experience and considerations in building stability for SAE on the business side.
Serverless App Engine (SAE), as the industry's first application-oriented serverless PaaS platform, offers fully managed and operation-free services for serverless web applications, micro-applications, and scheduled tasks. One of its core advantages lies in the low mental burden and zero transformation cost for users to deploy their applications/tasks directly on SAE. Users can solely focus on developing core business logic while SAE handles application lifecycle management, microservice management, logging, monitoring, and other functions. Without any modifications to business logic or version dependencies, users can seamlessly release code packages, integrate monitoring call chains, or migrate distributed scheduling frameworks. Additionally, SAE is building a new architecture based on traffic gateway hosting, which further simplifies user experience and reduces usage thresholds and costs through adaptive elasticity and idle billing.
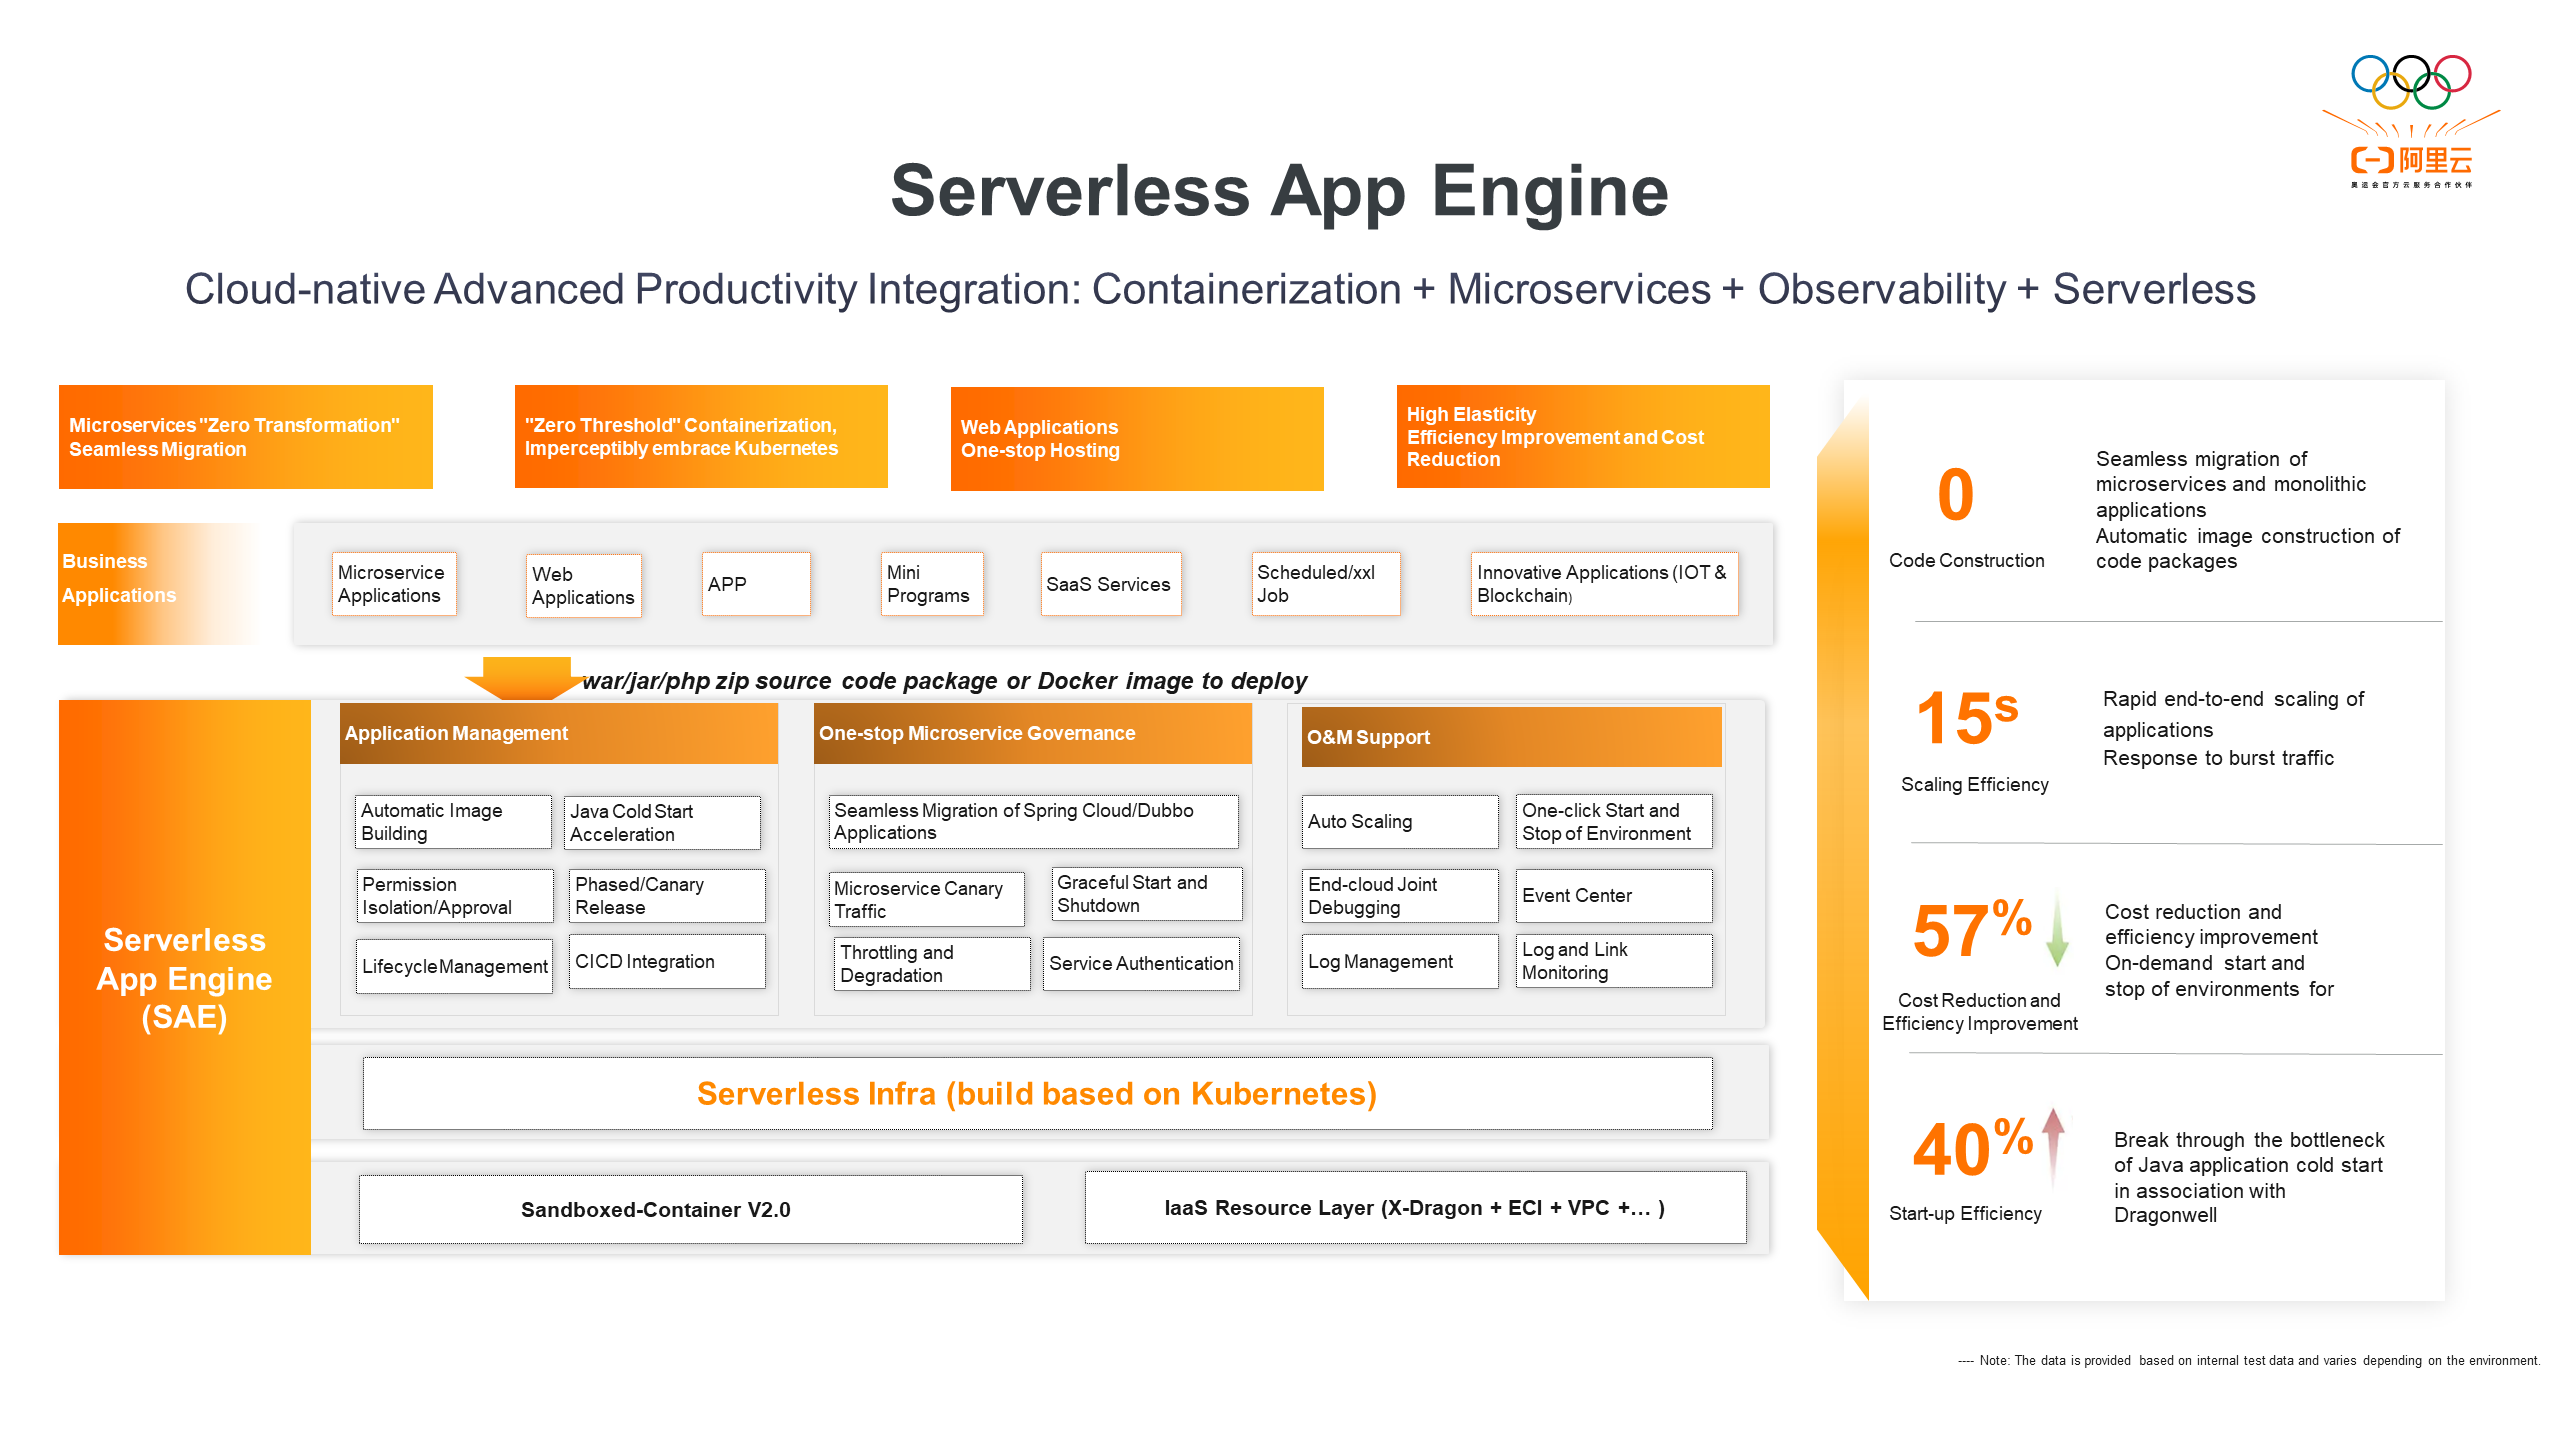
SAE products are designed to offer users a simple and user-friendly experience with an interactive interface. The complexity of the underlying Kubernetes is abstracted, reducing the understanding and usage barriers for users. As a PaaS product, SAE serves as the unified portal for developers and operations personnel on Alibaba Cloud. To simplify the user experience, SAE integrates with more than 10 other cloud products and services. These attributes pose significant challenges to SAE's R&D team in understanding user requirements, providing the simplest product experience, meeting user expectations at all levels, and creating a stable, secure, high-performance, and cost-effective cloud environment for user applications.
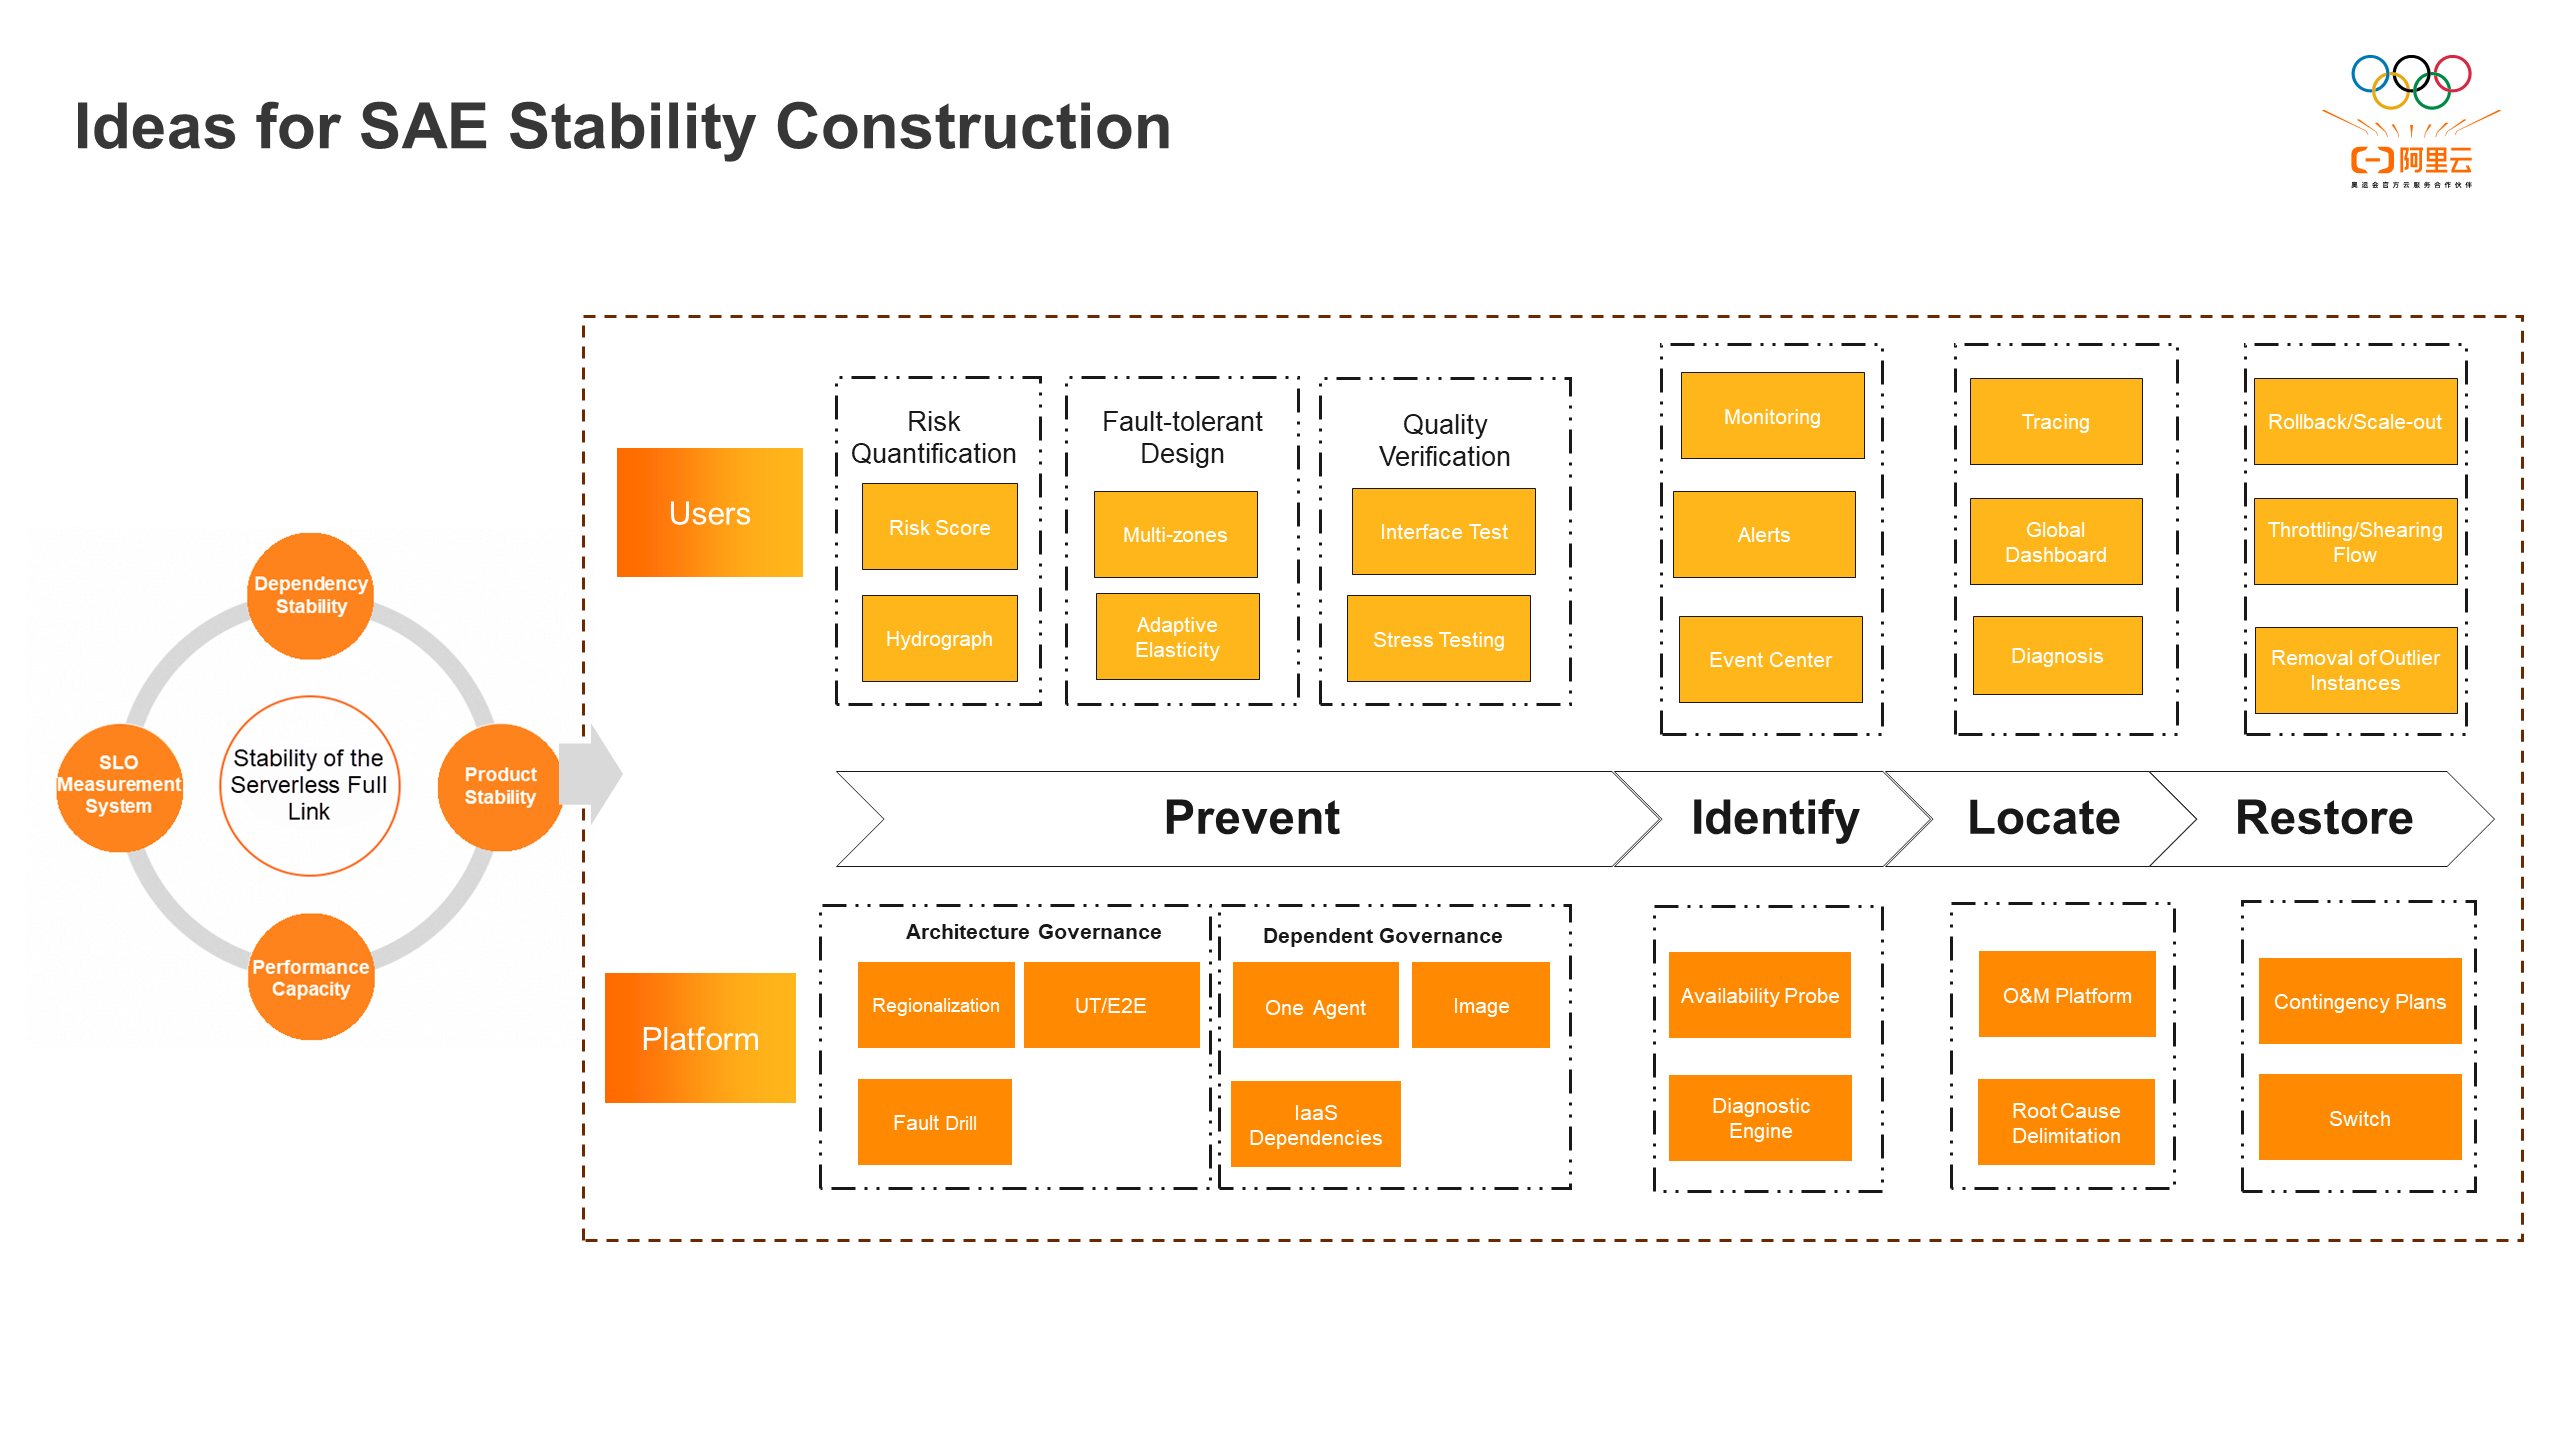
The stability construction of SAE is divided into four stages: fault prevention, fault identification, fault location, and fault restoration. From the platform perspective, fault prevention focuses on architecture governance and upgrades through regional transformation, comprehensive test coverage, fault drills, and other methods. This ensures the high reliability and availability of SAE backend services. It also emphasizes dependency management for agents, images, and IaaS layer dependencies to mitigate cascading failures caused by upstream and downstream issues. Fault detection relies on the diagnosis engine and runtime availability probes to promptly detect platform problems and address them through a unified alert center. The SAE operation and maintenance platform continuously improves to enhance the efficiency of internal operations and maintenance, as well as the ability to identify root causes and isolate problems. Contingency plans for potential risks and feature switches for new functions are crucial for quickly stopping losses and recovering from problems. Additionally, SAE utilizes risk quantification, fault tolerance design, quality verification, observability, event center, and diagnosis to help users solve their problems in a closed-loop manner, ensuring the overall stability of the Serverless full link.
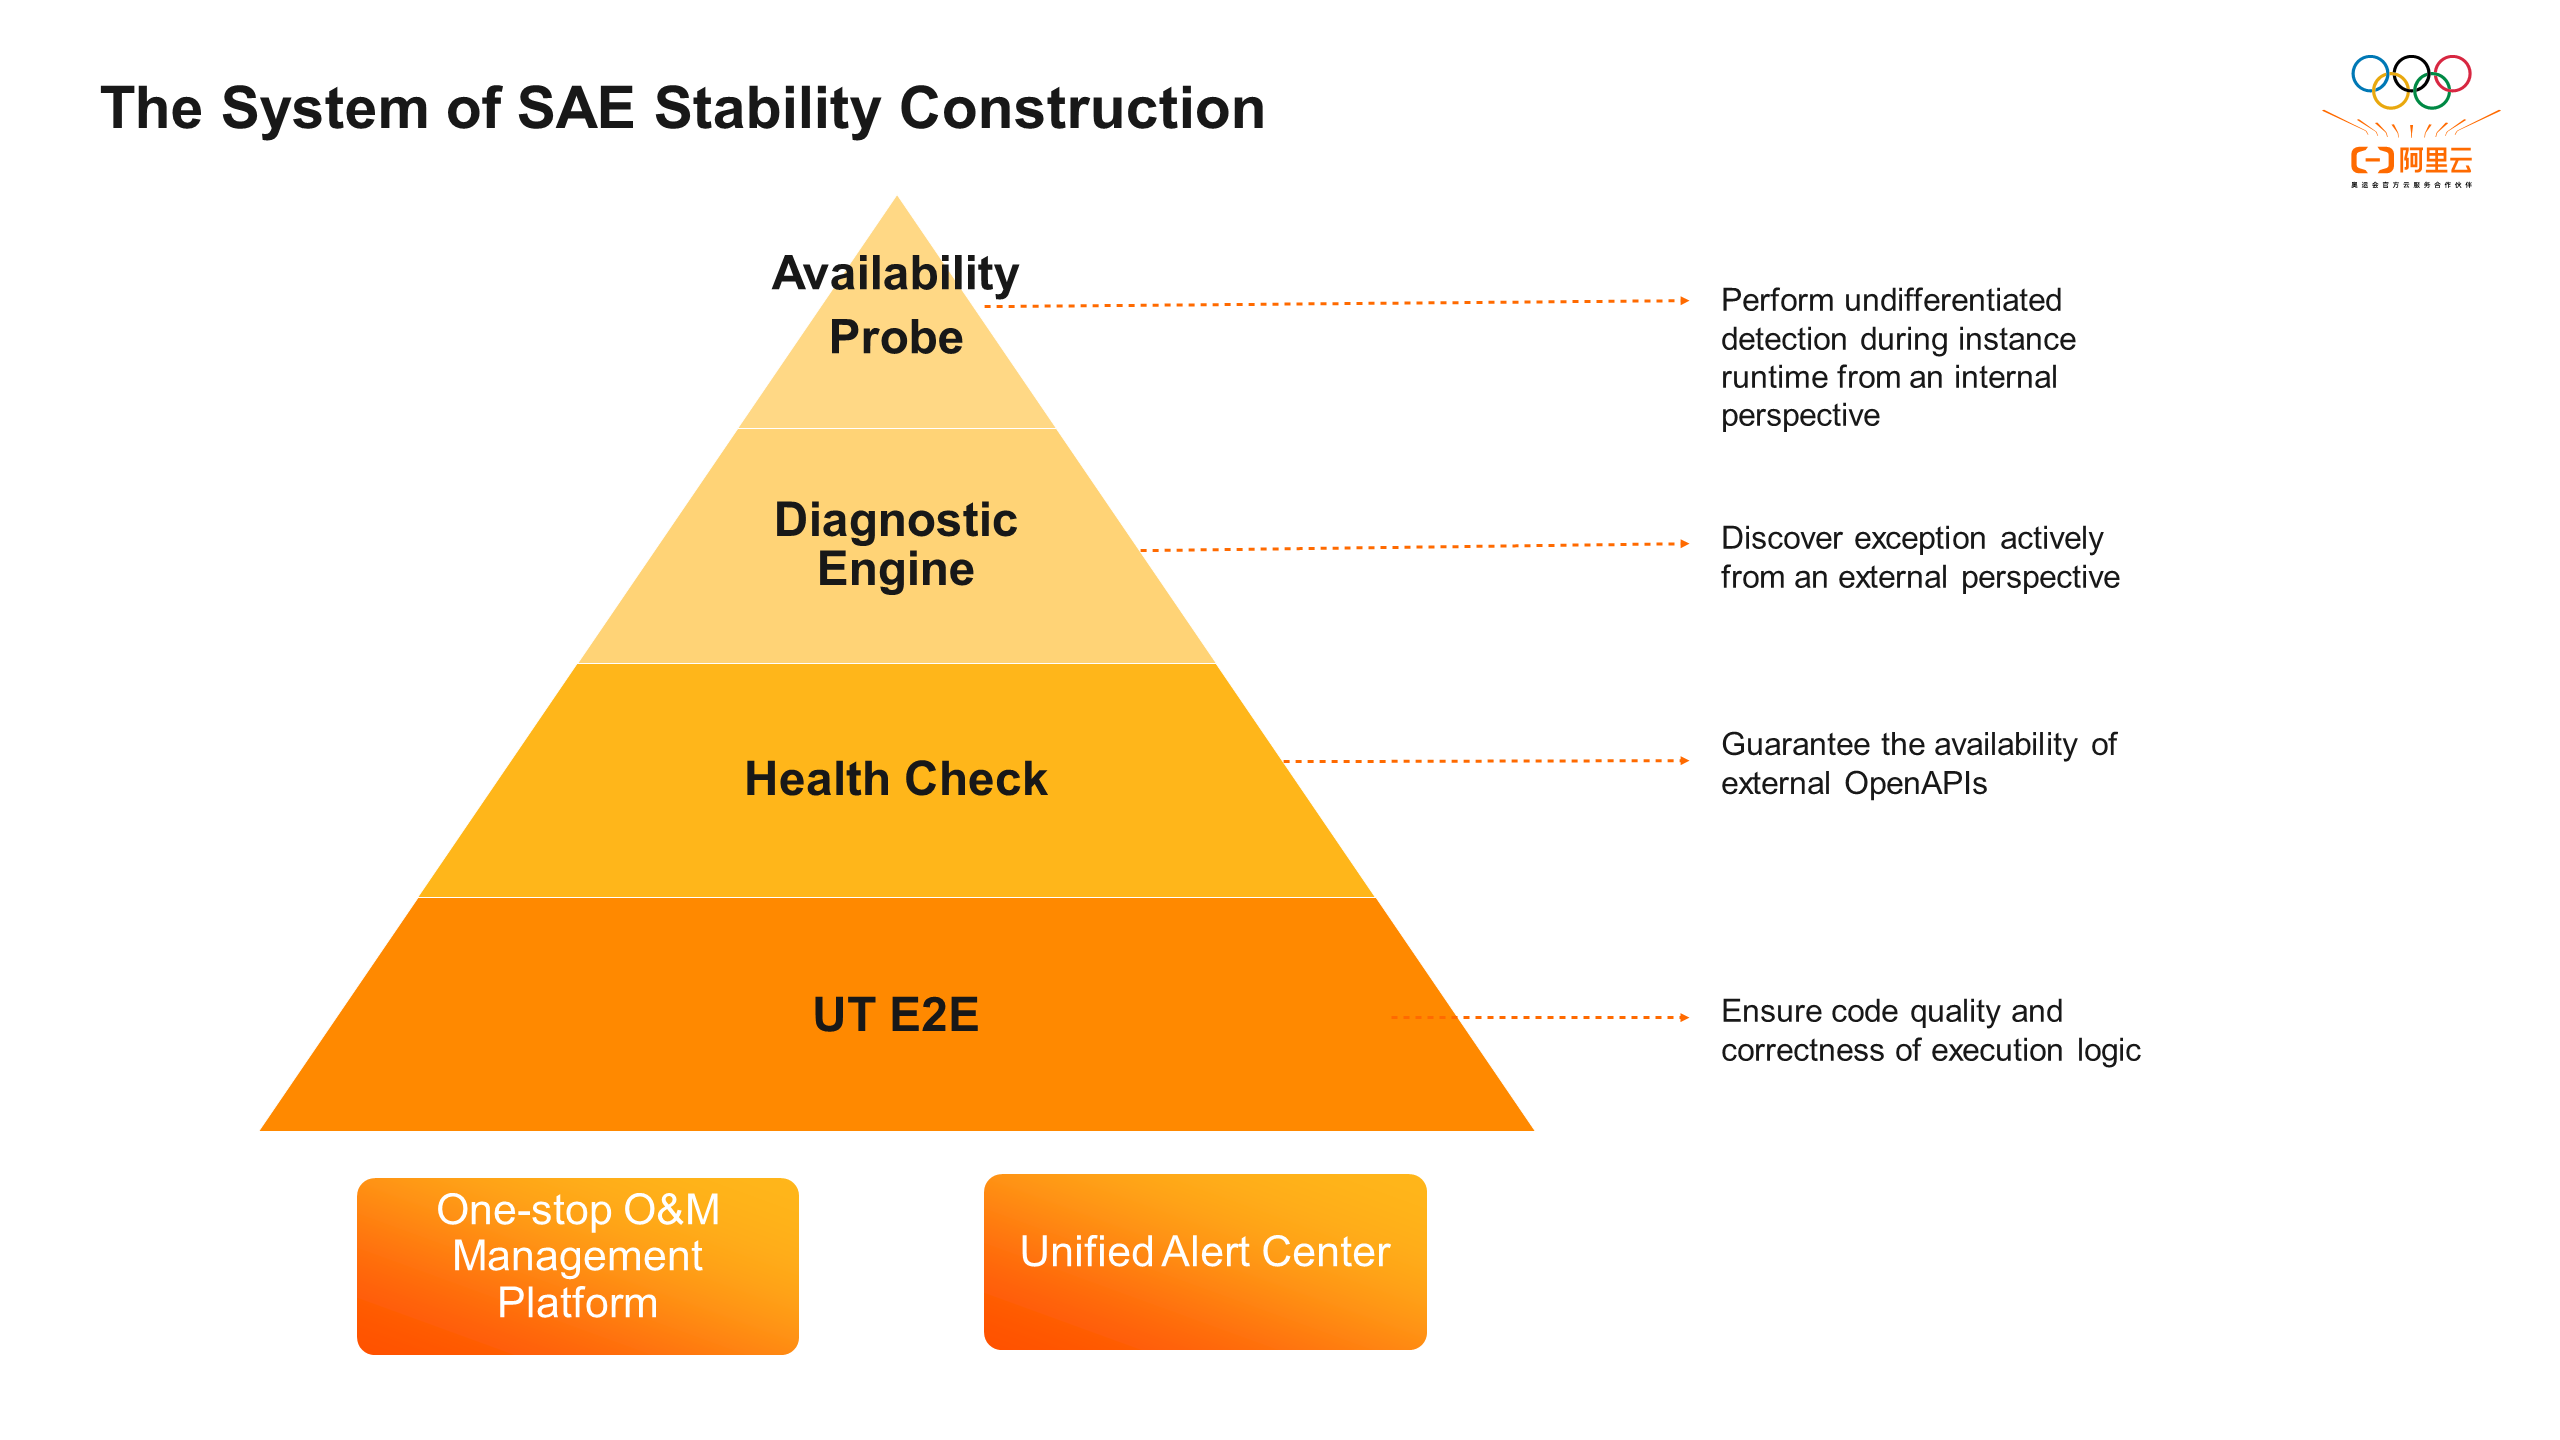
SAE's stability construction system consists of four parts: UT/E2E, inspections, diagnosis engine, and runtime availability probes. First, it improves code coverage through UT tests and expands core process E2E cases to ensure code quality and the correctness of program execution logic, thereby avoiding potential issues. Second, periodic inspections cover core processes of application lifecycle management to ensure the availability and SLA of the core OpenAPIs. By building the SAE diagnosis engine, it can monitor and consume various data sources in real-time from an external perspective. Through pattern diagnosis and root cause delimitation processes, it generates event alerts, enabling the early detection of abnormal issues before users notice them. Simultaneously, the SAE runtime availability probes ensure unbiased detection of instance runtime in real user environments, ensuring that the application's internal running environment meets expectations. The unified alert center facilitates efficient problem detection and the one-stop operation platform streamlines maintenance operations, improves problem locating efficiency, and comprehensively covers various types of exceptional issues, ensuring the stability of SAE applications.
SAE is built on top of a multi-tenant Kubernetes infrastructure. This allows for centralized management of all user applications in the same Kubernetes cluster, improving overall cluster management and resource allocation. However, there are also some drawbacks. The cluster becomes more vulnerable to issues, as small-scale exceptions or disruptions can affect large-scale user applications. Additionally, as product features evolve and user application instances expand, any changes or operations at the underlying level need to be approached with caution to avoid compatibility issues or unexpected exceptions. Furthermore, Kubernetes itself is a complex distributed system with many components, dependencies, and configurations, which increases overall complexity. In such a complex system, it is crucial to be able to quickly detect and locate faults effectively.
To address these challenges, SAE has developed the Infra Diagnostic Engine based on real business scenarios and experience in analyzing and troubleshooting historical problems. This engine formulates active discovery and diagnostic rules, refines them into a general diagnosis DSL, and builds an active discovery engine that monitors changes in Kubernetes resource status. Developers can configure the DSL on the O&M platform. The engine continuously monitors the changes in various Kubernetes resources and dynamically loads the DSL in real-time to trigger the diagnostic process. During the diagnosis process, the engine matches the status of the corresponding objects with the general pattern defined in the diagnostic rule. It analyzes the resources and their dependencies based on timeliness, frequency, and other factors to determine if they meet the rule definition. The engine then uses feature analysis plug-ins to identify the root cause of the problem and generate a diagnostic event. This mechanism enables the proactive discovery of abnormal resource states in Infra and is applicable to scenarios that use Kubernetes as the underlying technology.
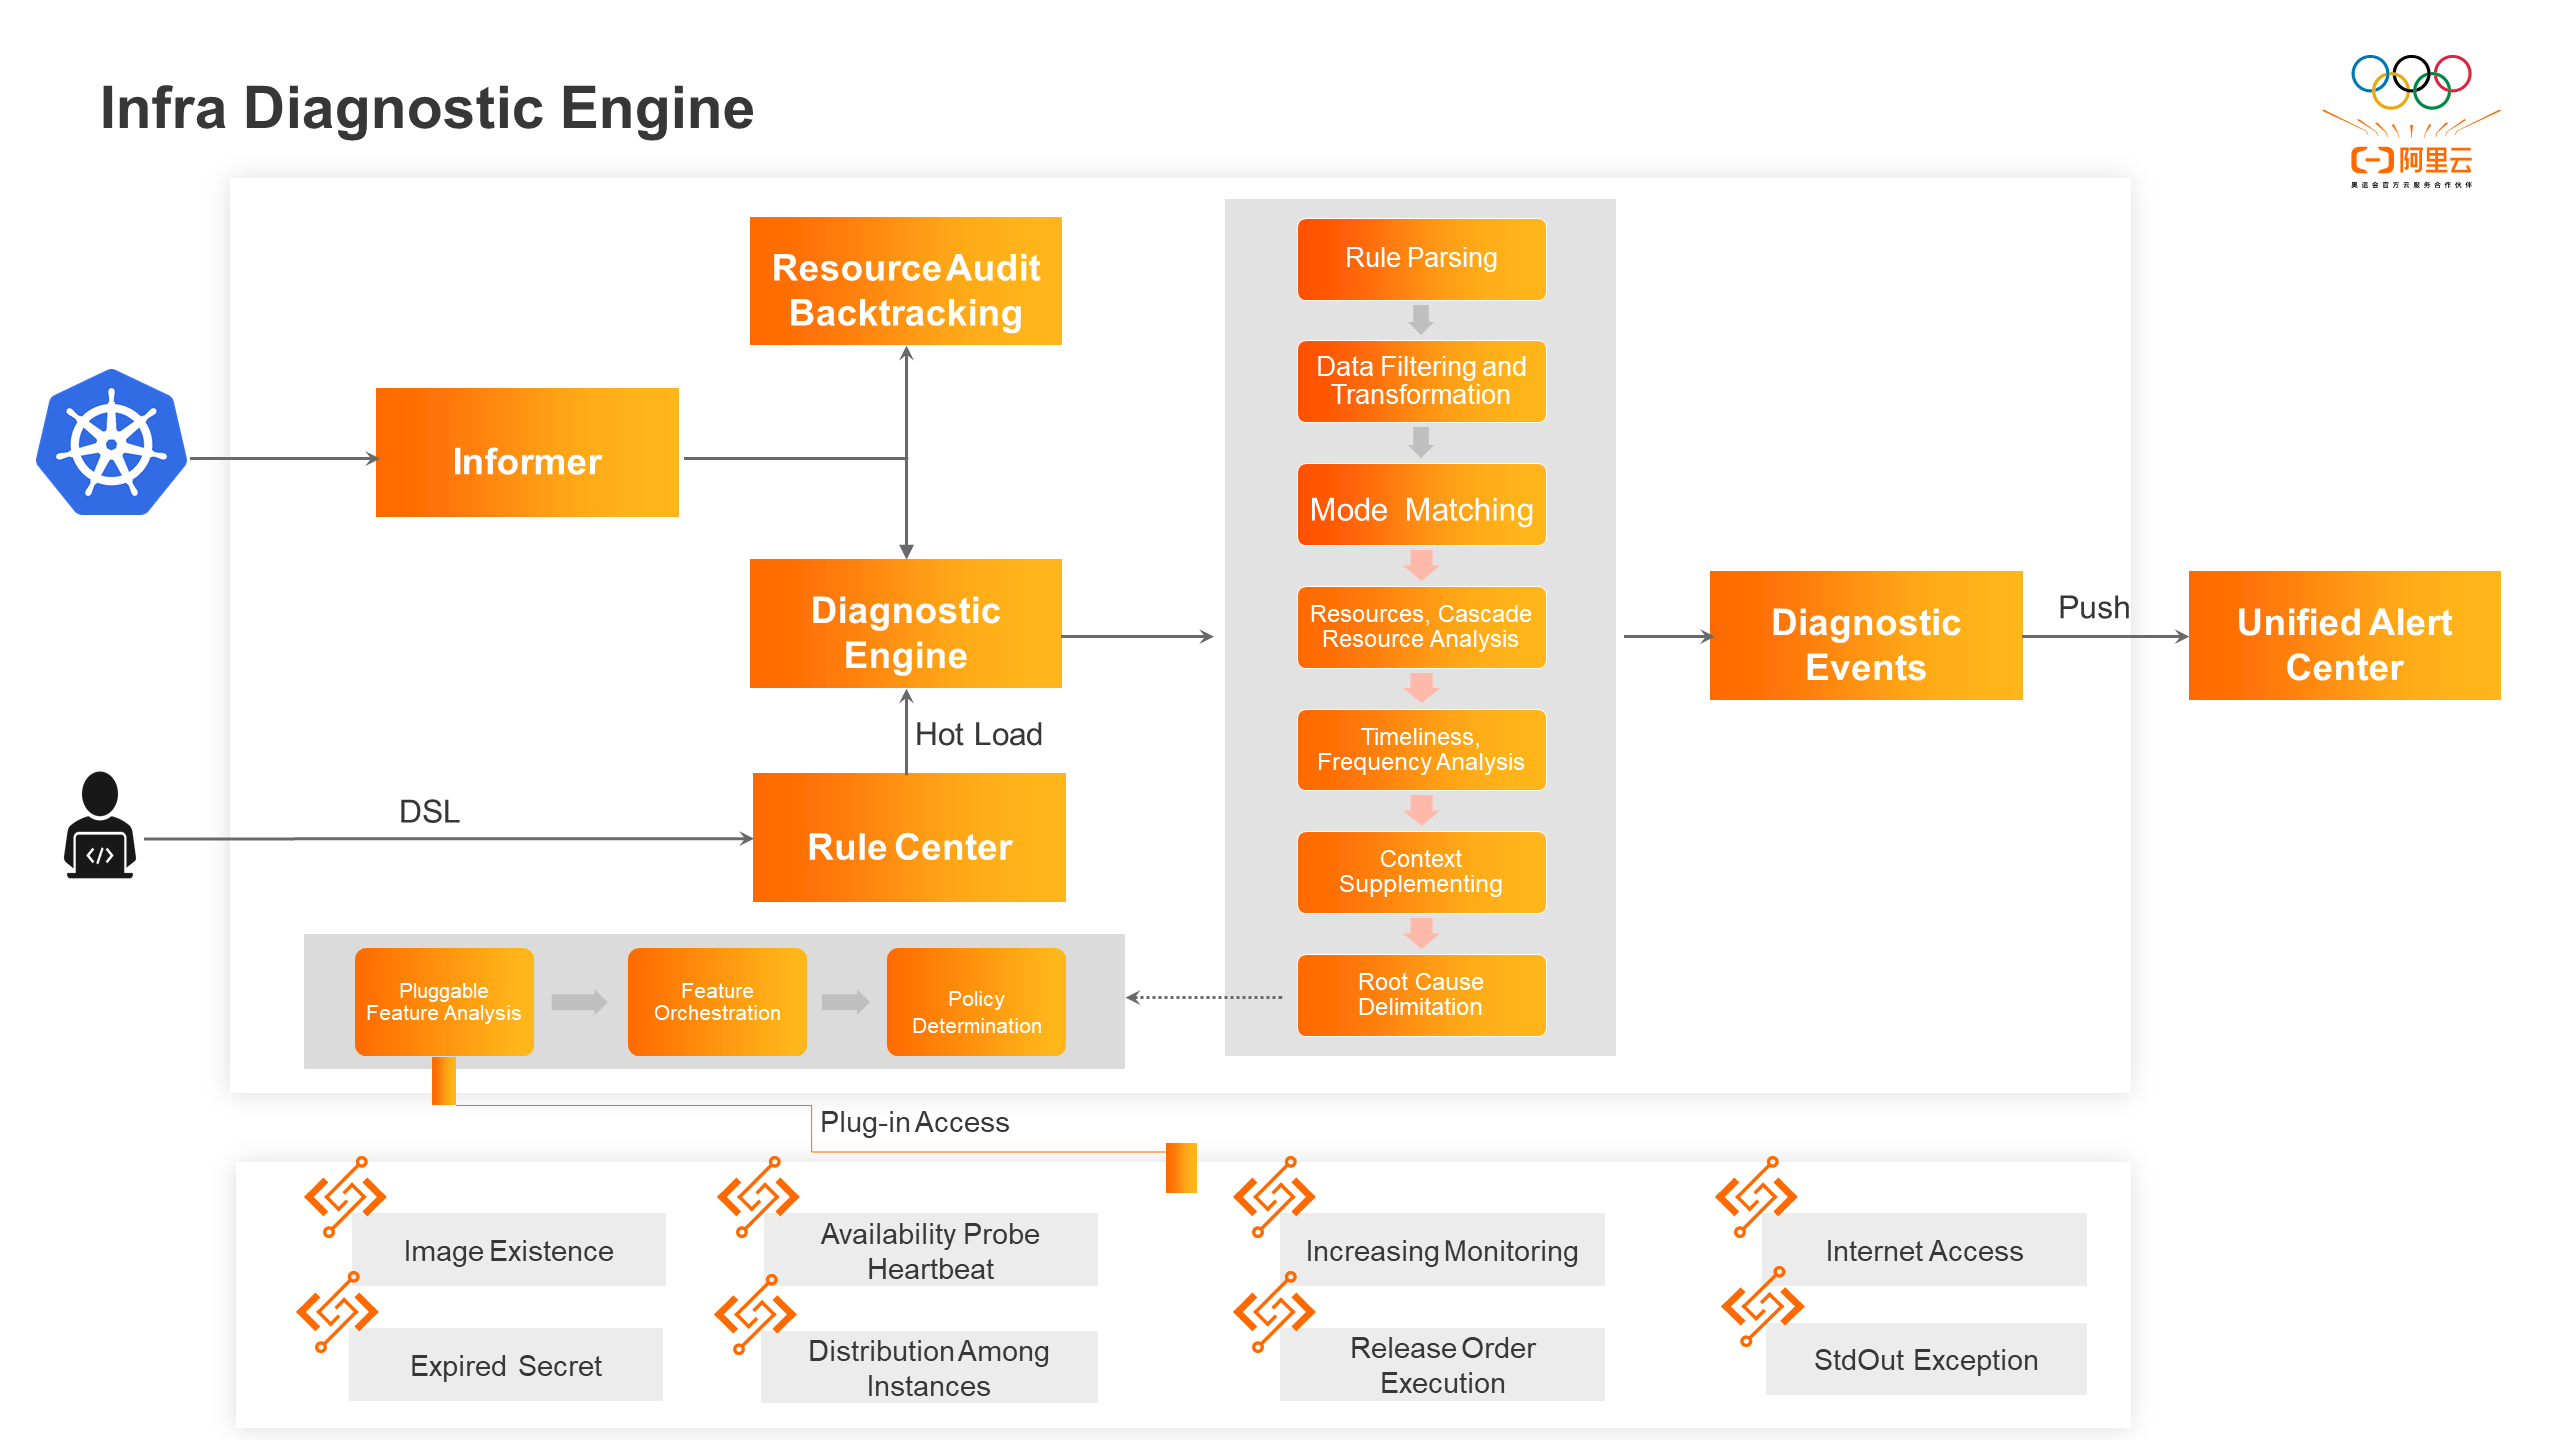
The SAE active discovery engine uses the status of Kubernetes resources as the event source for diagnosis, triggering a full-process diagnosis whenever there is a status change. Additionally, the engine retains snapshots of resource running statuses in Simple Log Service (SLS) for historical problem tracking and timeline analysis. The key challenge in status listening is to ensure that events are not missed or duplicated in real-time conditions.
As the core mechanism of Kubernetes, the controller mode ensures that the current state of the cluster continuously approaches the desired target state through a control loop. This includes perceiving the current state (informer) and processing the state (controller). The informer acts as an intermediary between the controller and the apiserver, listening for changes in Kubernetes resource status and triggering event callbacks. During this process, the listed resource objects are cached in the local cache to reduce subsequent read operations on the apiserver. Compared to periodic polling, the informer mechanism efficiently and reliably processes event notifications in real-time.
In SAE scenarios, directly using the native informer mechanism poses challenges. The large number of resources in the cluster, which increases with business scale, can consume a significant amount of memory resources, leading to a high risk of memory overflow. Furthermore, when the SAE active discovery engine restarts or switches to the master, the list process is triggered again. This can cause a significant load on the engine due to a large number of events for existing resources, resulting in redundant diagnosis of resource objects. Additionally, if a resource is deleted during the restart process, the deleted event cannot be obtained again after startup, resulting in event loss.
To address these issues, the SAE active discovery engine has made several modifications and enhancements to the native informer mechanism:
• Resource occupation compression: The cache module is removed, and objects are temporarily stored in the workqueue when an event callback is triggered. After the event is processed, the object is deleted from the queue. Unlike the native workqueue that may have multiple versions of the same resource object, the SAE active discovery engine only keeps the latest version of the object by comparing resourceVersion, reducing redundancy.
• Bookmark mechanism: The engine obtains the latest resourceVersion from the processed objects and watched bookmark events. The engine stores the progress information persistently when the instance exits. After the new instance starts, the engine reads and executes list operations at the specified resourceVersion, ensuring that redundant sync events are not consumed due to restart.
• Dynamic finalizer management: Finalizers can be added to resource objects such as pods and jobs. The finalizers are only removed when the active discovery engine has finished processing, ensuring event continuity in scenarios with high concurrency and component restart.
This status listening mechanism covers all core Kubernetes resources in SAE clusters, avoiding event loss and outdated status issues. Based on this mechanism, a Kubernetes resource view is built to display the status changes of associated Kubernetes resource objects from an application perspective. The normal memory usage of the component is less than 100 MB.
Kubernetes has a large number of resource objects, and exceptions are very divergent. Therefore, if we configure alert policies for each abnormal case, it is inefficient and impossible to achieve comprehensive coverage. In this case, SAE, through the summary of historical problems, abstracts the following scenario paradigms:
● Whether resource A has the x field
● Resource A is in the x state
● Resource A is in the x state for s minutes
● Whether resource A has the x field and the y field at the same time
● Whether resource A has the x field and is in the y state
● Whether resource A has the x field and is in the y state for s minutes
Resource A references resource B, but resource B does not exist
Resource A refers to resource B. Resource A is in the x state, but resource B is in the y state
● Resource A refers to resource B. Resource A is in the x state, but resource B is in the y state for s minutes
Escape the preceding scenario paradigms into a general-purpose DSL. The Sidecar Container is in the Not Ready state for 300 seconds and can be configured as (after streamlining):
{
  "PodSidecarNotReady": {
    "duration": 300,
    "resource": "Pod",
    "filterField": [{
      "field": ["status", "phase"],
      "equalValue": ["Running"]
    }, {
      "field": ["metadata", "labels", "sae.component"],
      "equalValue": ["app"]
    }, {
      "field": ["metadata", "deletionTimestamp"],
      "nilValue": true
    }],
    "checkField": [{
      "field": ["status", "containerStatuses"],
      "equalValue": ["false"],
      "subIdentifierName": "name",
      "subIdentifierValue": ["sidecar"],
      "subField": ["ready"]
    }]

  }
}
The Service is in the Deleting state for 300 seconds, which can be expressed as (after streamlining):
{
  "ServiceDeleting": {
    "duration": 300,
    "resource": "Service",
    "filterField": [{
      "field": ["metadata", "labels", "sae-domain"],
      "equalValue": ["sae-domain"]
    }],
    "checkField": [{
      "field": ["metadata", "deletionTimestamp"],
      "notEqualValue": [""]
    }]
  }
}
The diagnosis engine processes the Kubernetes unstructured objects obtained from real-time status listening. It matches the DSL rules of the corresponding resources and uses the dynamic parsing feature of the syntax tree to obtain field information for pattern matching. You can obtain any fields, field arrays, or specified sub-fields in the field array from the unstructured objects for an exact or fuzzy match. If a diagnosis rule is hit, it will be placed in the DelayQueue and delay alerts will be sent according to the configured duration. During alerts, the status field and Warning event information at the target time are included to provide additional diagnostic context.
If the object is subsequently listened to and found to not match any diagnosis rules, it will be removed from the DelayQueue. This indicates that the problem has been resolved and no alert will be triggered. In addition to event-driven mode, for some diagnostic items that need to be periodically executed, such as verifying the existence of SLB backend virtual server group corresponding to the Service, checking if the listening exists, confirming the effectiveness of ALB routing rule corresponding to the Ingress, and ensuring the consistency of the order, the status information of the Service, Ingress, and other object resources in Kubernetes is not sufficient. Therefore, continuous access to the corresponding cloud product, DB, and other external resources is required for determination. In this scenario, the latest version of the resource object is maintained in the DelayQueue. The resource object is re-enqueued after verification and is only deleted from the DelayQueue when it is deleted. Additionally, a random offset is added to the delay time to disperse the resource objects and prevent access throttling caused by triggering diagnostics simultaneously.
The SAE active discovery engine can handle resources with general processing logic. It supports rule configuration for any CRD and provides complete functions such as resource/cascading resource verification, resource missing/leakage detection, and timeliness frequency check. R&D personnel can make real-time changes to the DSL through the O&M platform to update the diagnosis rules.
Pattern matching has a good diagnostic effect for exceptions that have direct states in resource objects or clear causes in corresponding Kubernetes events. However, for complex issues with dependencies and multi-component interactions, false alerts are often generated. Developers need to further analyze the problem based on its appearance and identify whether it is caused by user errors or platform internal failures in order to locate the root cause.
With the root cause delimitation capability of the Infra diagnosis engine, expert experience is converted into an automated diagnosis flow. This capability effectively reduces the occurrence of false alerts and converges the perception of user-side exceptions. The core of the root cause delimitation capability is to analyze the problem from multiple dimensions, split and drill down its image, and combine feature items for structured and automated analysis to find the root cause. For example, in the case of an image pull failure, the analysis tree for root cause delimitation is as follows (simplified):
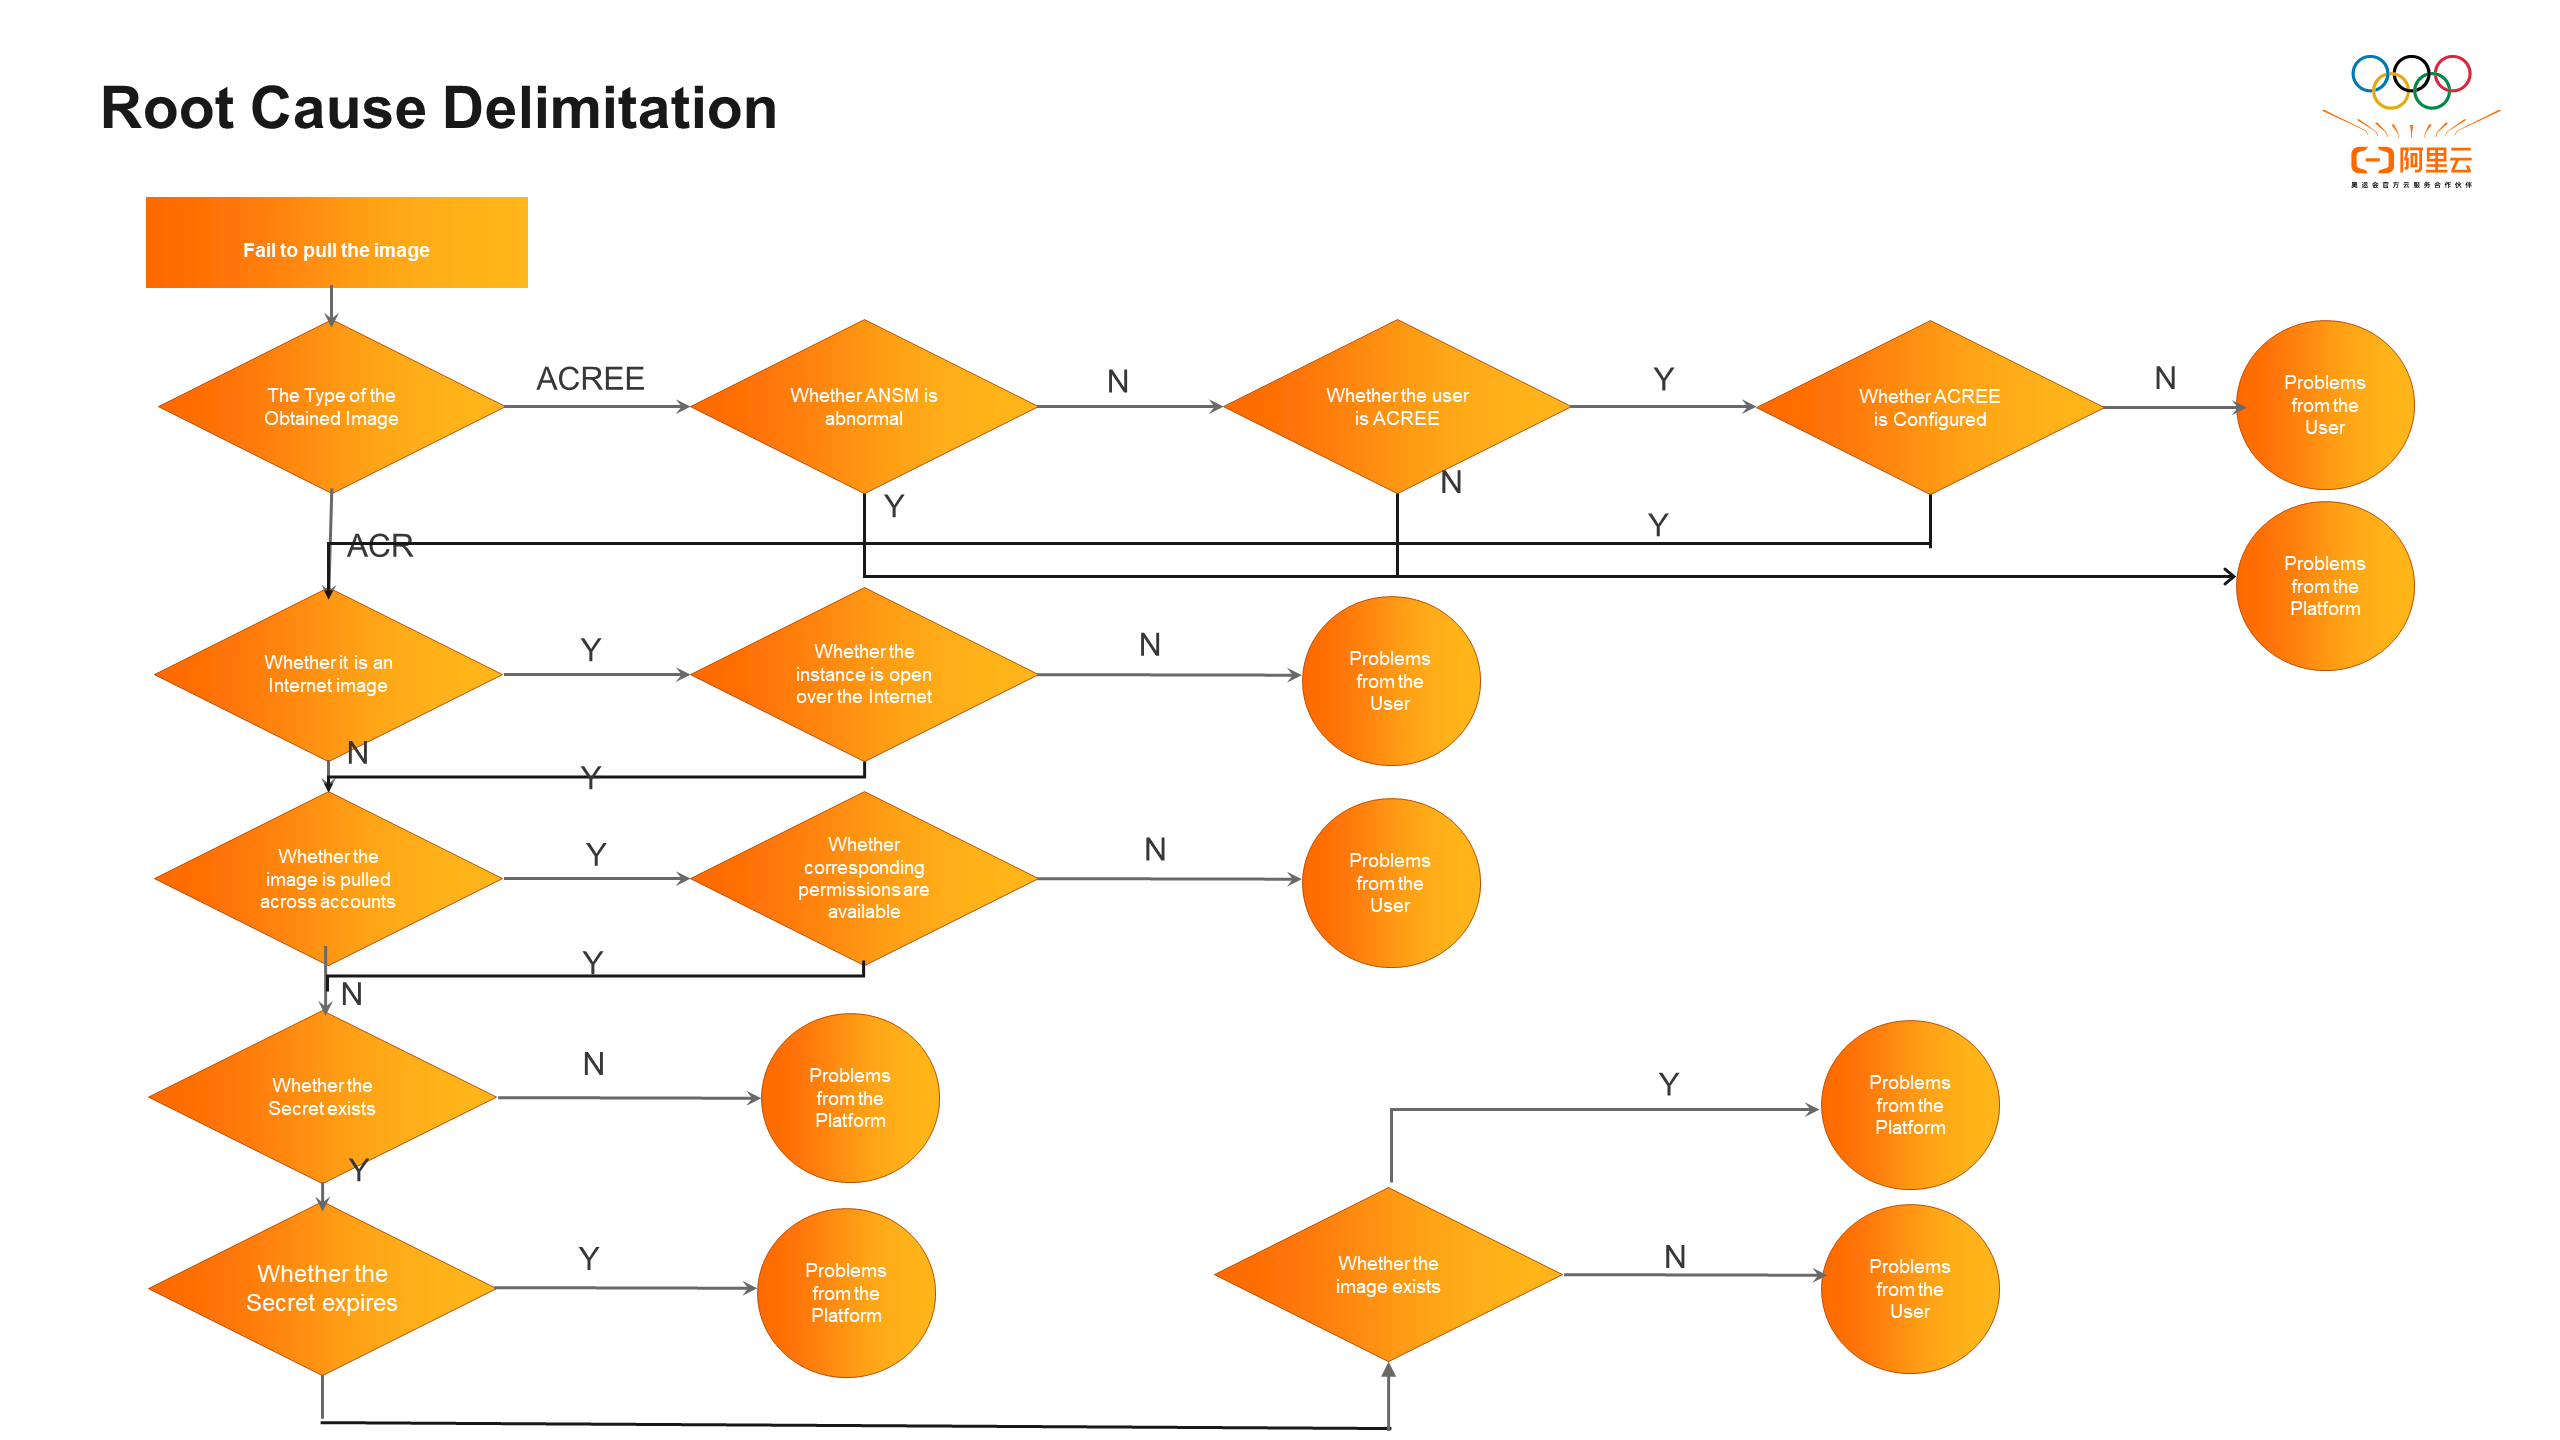
Each node in root cause delimitation represents the business logic for a specific diagnostic case, and it frequently changes. Adding all nodes to the active discovery engine would require publishing any changes online, resulting in high development and operational costs. Additionally, it would be impossible to implement resource isolation and fault isolation, which would increase the complexity and security risks of the entire engine. Therefore, the design of the active discovery engine adopts a microkernel architecture. This architecture retains the core logic of the component, extracts diagnostic items as lightweight feature plug-ins, communicates with the active discovery engine through the adapter mode, and achieves dynamic routing and triggering of the plug-ins through the reflection mechanism. By parsing the plug-in DSL, the engine generates a directed acyclic graph, orchestrates the entire call process, and delimits the root cause of the target diagnostic item. Feature plug-ins are deployed and run in Alibaba Cloud Function Compute, which can trigger millisecond-level cold start delays. The plug-ins are allocated to run resources separately and support real-time code modification and hot updates.
Using plug-in transformation to delimit root causes has the following benefits:
• Agile development: This approach facilitates separation of concerns and engineering decoupling, simplifies the coding, debugging, and maintenance processes, and improves development and deployment efficiency.
• Dynamic extensibility: By modifying the declarative DSL, runtime plug-ins can be plugged in and out in real time, allowing for flexible customization and modification of the diagnosis process.
• Fault isolation: This approach reduces the impact radius and prevents the entire active discovery engine from being abnormal due to a single plug-in exception. The impact is limited to the plug-in itself.
• Composition and orchestration: With the help of the plug-in atomization capability, the input and output of the plug-in are processed and forwarded through a unified state machine execution mechanism, making it easier to implement more complex diagnostic logic.
In addition to the image-related feature plug-ins shown in the figure, there are also common feature plug-ins that help locate and troubleshoot problems. These include increasing monitoring, executing release orders, analyzing abnormal distribution of application instances, capturing instance standard output, and capturing running environment snapshots.
Active discovery based on Kubernetes resource status changes can address most stability issues. However, it lacks an internal perspective, which means it fails to fully reflect the health of the instance running environment, effectively perceive exceptions caused by user dependencies during startup and runtime instance environment differences, and define the boundary of runtime issues caused by application running exceptions.
By constructing SAE runtime availability probes, real-time detection and reporting of availability indicators are carried out within user instances. This ensures the health status of instance deployment and running states in real user environments, regardless of language applications. The status represents the real running status of the entire instance and can be used to eliminate the impact of user application exceptions. This allows for effective exposure of difficult and hidden problems, definition of the root causes of runtime availability, and improvement of stability coverage.
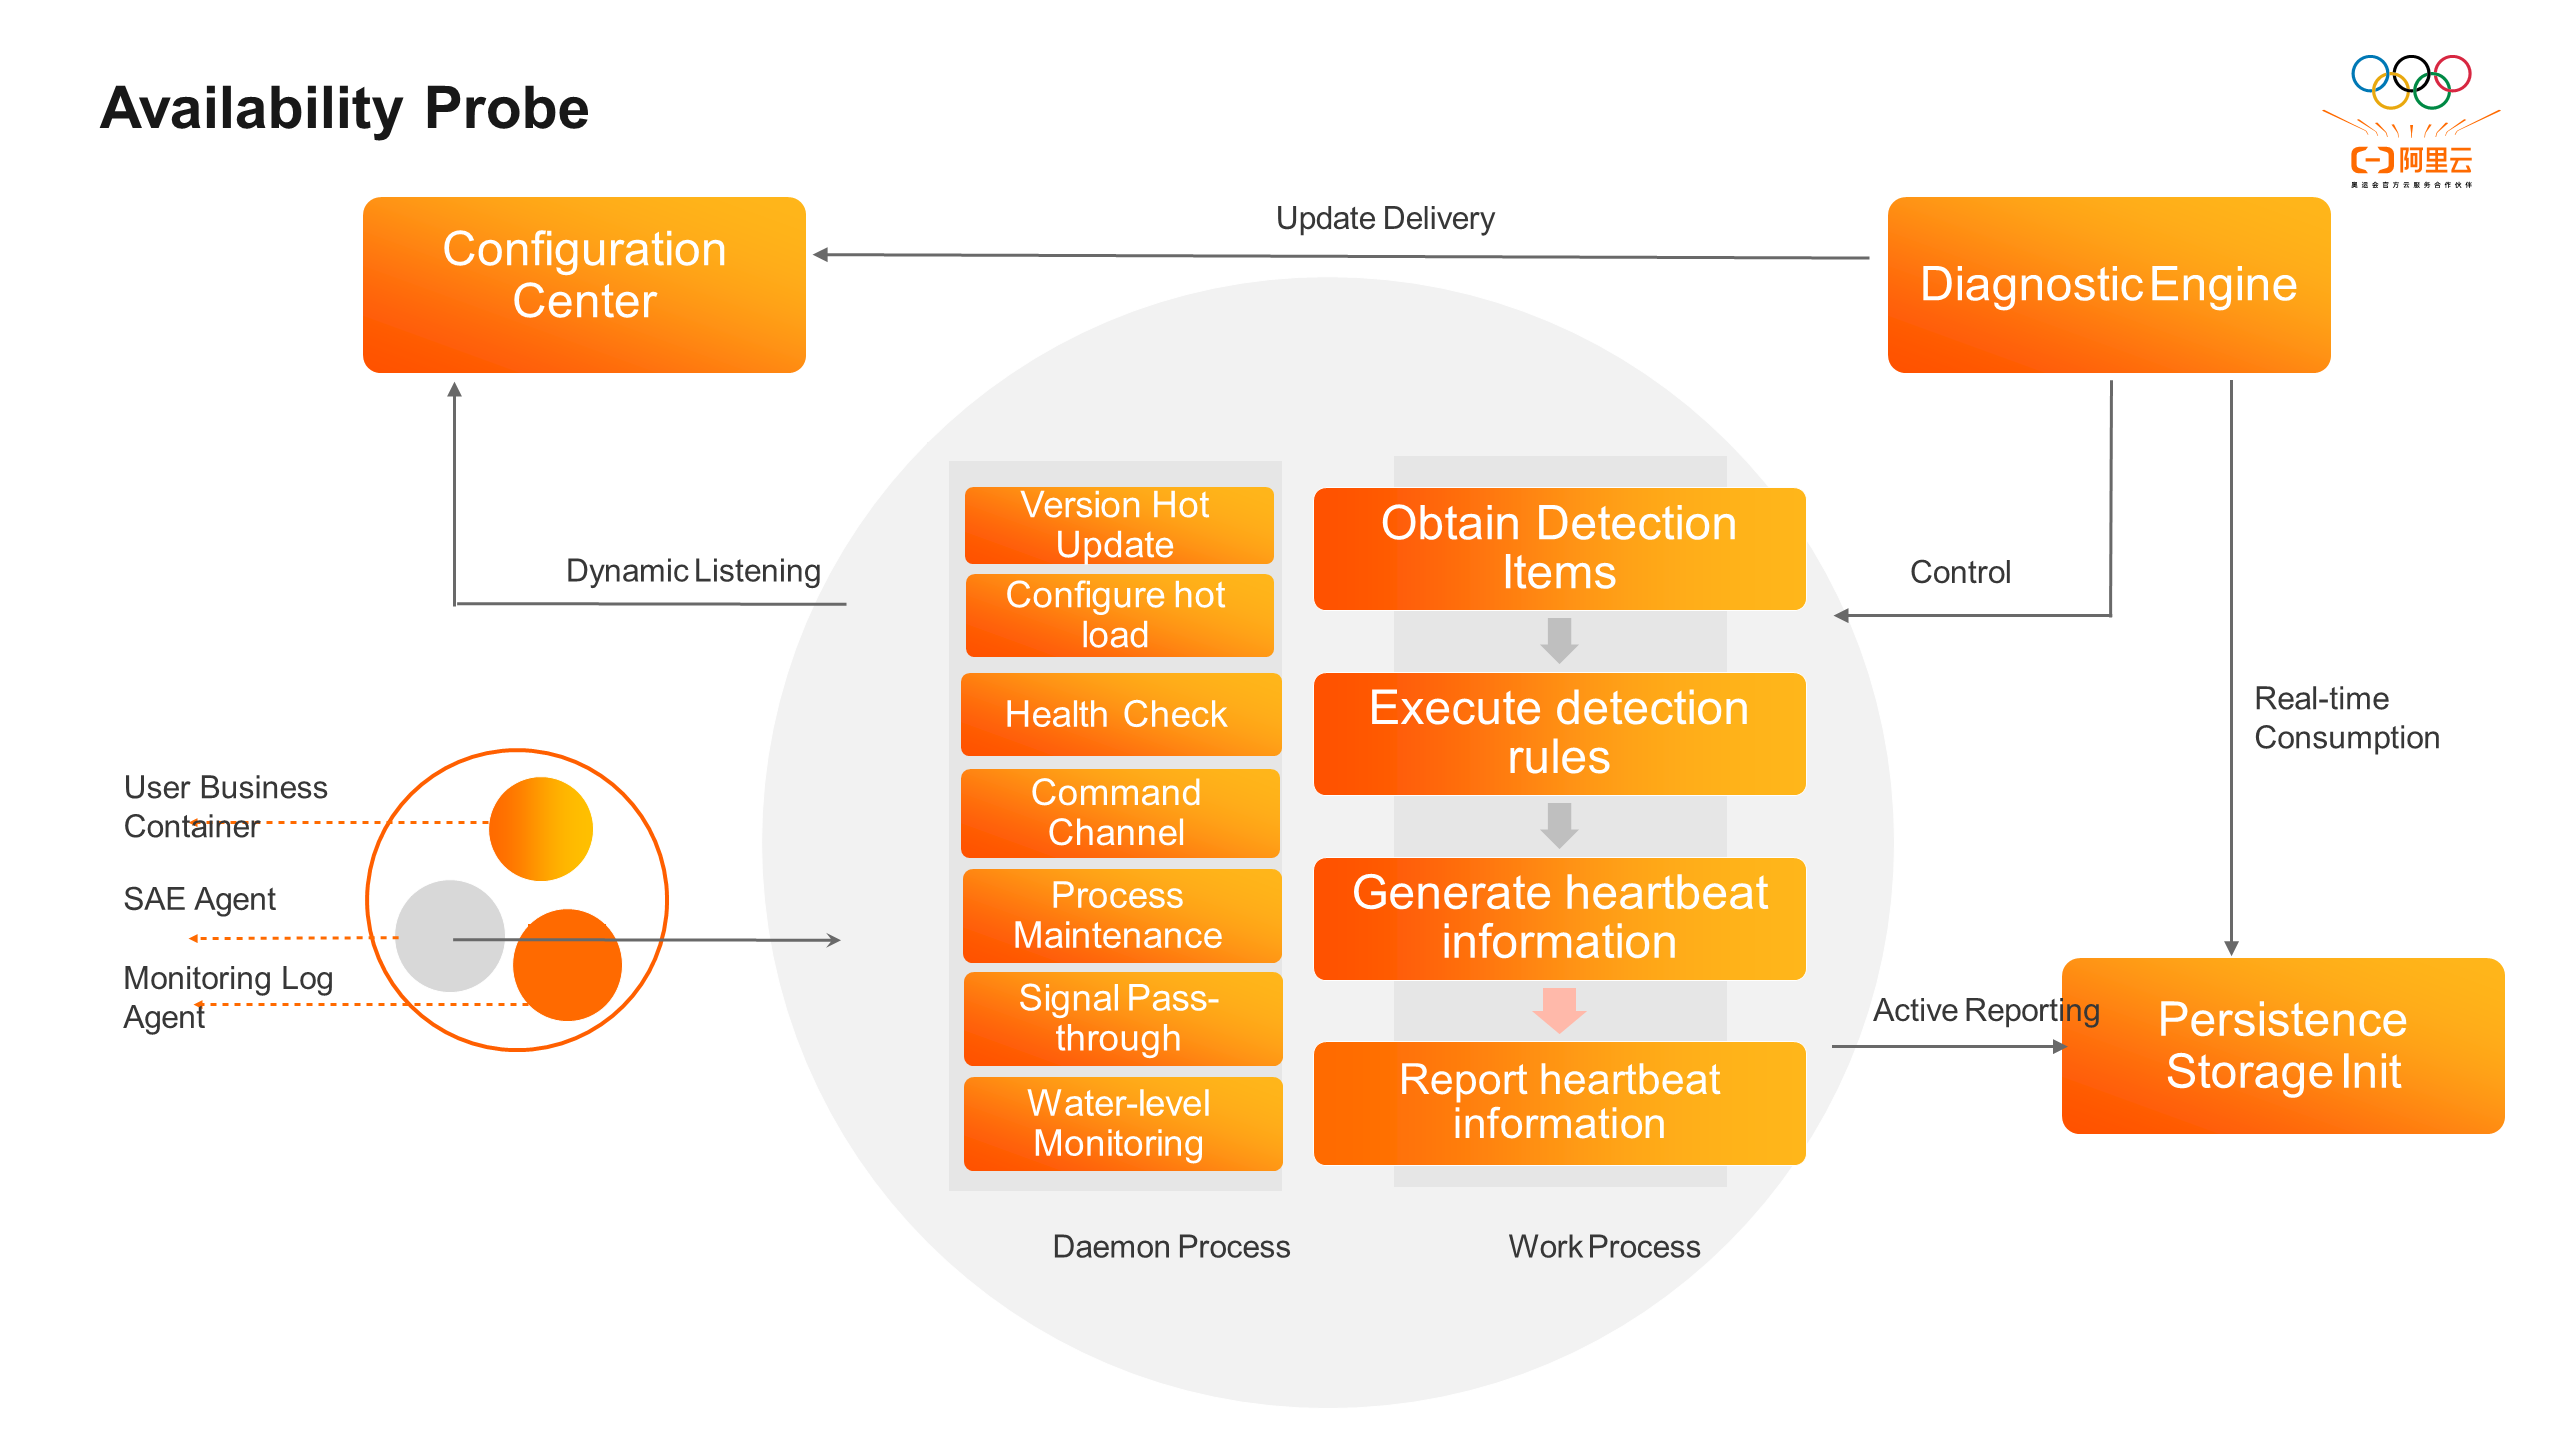
As shown in the figure, the SAE runtime availability probe runs in user instances as a sidecar. Its architecture is divided into the following parts:
• Configuration center: This center configures whether the canary release version of the probe and the dependency check items are effective. It supports the user and application dimensions.
• Daemon process: This process is responsible for general process management functions, such as version hot updates, configuration hot loading, health checks, command channels, process maintenance, signal transmission, and water level monitoring.
• Work process: This process undertakes computing tasks and executes specific dependency detection logic. It attaches metadata to report heartbeat information to the persistent storage unit.
• Persistent storage unit: This unit stores heartbeat information for further consumption and processing by the diagnostic engine. It also provides a visual dashboard display.
• Diagnostic engine: This engine consumes the heartbeat data of probes in persistent storage units, enhances the capability of root cause delimitation, accesses the configuration center to update probe configuration information, and controls probe behavior for operation and maintenance purposes.
SAE comprehensively sorts out the dependencies related to the deployment state and running state of an application. The following factors can seriously affect the running of application instances:
| Dependencies | Detection Means |
| Container exceptions | The probe periodically reports heartbeats to indicate that it is alive. At the same time, the probe reports the heartbeat in exit status when it exits. The SAE active discovery engine determines whether an instance is alive and available according to the heartbeat and exit statuses. |
| Network errors | The probe provides the dial test to ensure network quality. |
| Agent startup exceptions | The probe verifies the agent package and the log output to make a judgment. |
| Storage mount exceptions | The probe detects and accesses the status of the mounted file system in real time. |
| Time zone exceptions | The probe obtains the remote server time for verification. |
As to the way of reporting heartbeat, because SAE adopts a single network interface controller mode, the instance is only bound to the user ENI network interface controller, the platform network cannot access the remote user instance, and the pull model cannot be used to obtain heartbeat information. On the contrary, the push model naturally supports horizontal expansion and does not occupy the user port to avoid potential port conflicts and data breach risks, so the probe uses the push model for active end-side reporting.
For each dependency, the SAE runtime availability probe executes the periodic detection logic, generates the result status code, and reports the heartbeat to the persistent storage unit after populating it with the metadata and compressing associated items. SAE active discovery engine consumes heartbeat data in real time, obtains heartbeat status code to determine the runtime of the instance, and triggers exception alerts. At the same time, after the heartbeat data is summarized and visualized, the full lifecycle trajectory of the instance can be drawn, and the SLA availability dashboard can be built for SAE's internal reference.
Since the SAE runtime availability probe runs in the user instances, the robustness of the probe itself is particularly important. To implement fine-grained version control and real-time hot updates and ensure that the probe can fix problems in a timely manner and continuously iterate, the SAE probe uses the daemon + worker process running mode. The daemon is responsible for general logic such as configuration pull, worker process maintenance and update, semaphore capture and passthrough to ensure that the worker process can exit normally and automatically recover from exceptions, while the worker process is responsible for task scheduling, execution of specific dependency verification logic, and heartbeat generation and reporting. The SAE active discovery engine uses the version number in the heartbeat to identify and control the progress of the canary release update. The dual-process decoupling feature moves volatile logic to the worker process. Distributed self-updating, compared with single-process processing, which updates versions depending on triggering CloneSet to update the image in place each time, ensures real-time updates and does not go through Kubernetes links. This reduces the pressure on cluster access and the impact on user service container traffic during the update process.
Since the sidecar container in the SAE instance shares the resource specification with the user's business container, it is necessary to prevent the probe from consuming too many resources and affecting its normal operation due to resource preemption with the business container. By analyzing and optimizing the code of the SAE runtime availability probe and extrapolating the computational logic to the SAE active discovery engine for processing, the probe is lightweight enough to ensure that the probe is almost free of CPU usage after it is launched, with the memory only accounting for several MB. At the same time, to avoid excessive resource occupation in extreme cases, the SAE probe also adds the component self-monitoring capability to collect the resource consumption of the current process at regular intervals and compare it with the configured expected target threshold. If the consumption is too large, the fuse logic will be triggered to automatically exit.
Because the SAE runtime availability probe starts before the user service container and resides in all user instances, it can install common tools, commands, and scripts, such as ossutils, wget, iprote, procps, and arthas, in advance. In addition, it is configured with Alibaba Cloud intranet software sources to prevent related tools from being unable to be installed and commands from being executed due to continuous crashes of user containers or reduced images such as Alpine. This improves O&M efficiency and O&M experience during troubleshooting. At the same time, because the two are located in the same network plane, the SAE probe can be used as a jump server to detect problems such as network connectivity, network delay, and the existence of resources. Suppose that the command is executed in a centralized manner through exec. Because the API server is required during the exec calling procedure, the access concurrency and packet size need to be reasonably evaluated for multi-tenancy clusters, resulting in certain stability risks. However, by using the probe as a command channel, the control traffic in the SAE cluster can be isolated from the data traffic, and the execution and reporting of various commands and scripts can be supported safely and reliably. Many plug-ins in the SAE active discovery engine are implemented by using the SAE runtime availability probe as a command channel.
In the future, SAE will explore the combination of runtime availability probes and ebpf technology to provide more in-depth debugging and troubleshooting methods for kernel calls, network packet capture, performance tracking, etc.
There are many alert generation sources of SAE, including diagnostic events from the diagnostic engine, heartbeat information from availability probes, Kubernetes events, runtime component logs, DB data, CloudMonitor, and Prometheus monitoring. The data format of each alert source is different, and the alert capabilities of each platform are different. Therefore, you cannot customize the settings based on your business requirements.
To ensure that all types of stability issues can reach R&D personnel in a timely manner, SAE builds a unified alert center and formulates a unified event model specification. By integrating and consuming various alert sources, SAE converts heterogeneous data into SAE events for unified processing. After filtering events in the blacklist and whitelist, deduplicating and compressing, enriching metadata, and associating context information, SAE reports complete events to ARMS. The end-to-end alerting process is implemented with the product-based capabilities of ARMS, such as alert contact management, multi-channel distribution, and dynamic scheduling. On this basis, the alert classification mechanism and alert escalation capability are improved to handle urgent and serious problems in a timely and effective manner and improve the alert handling efficiency. The event center is built to reveal internal events for users to subscribe to. It also supports the production of visual dashboards, core indicators, and audit details of historical alerts, realizing one-stop management of the whole process of alerts.
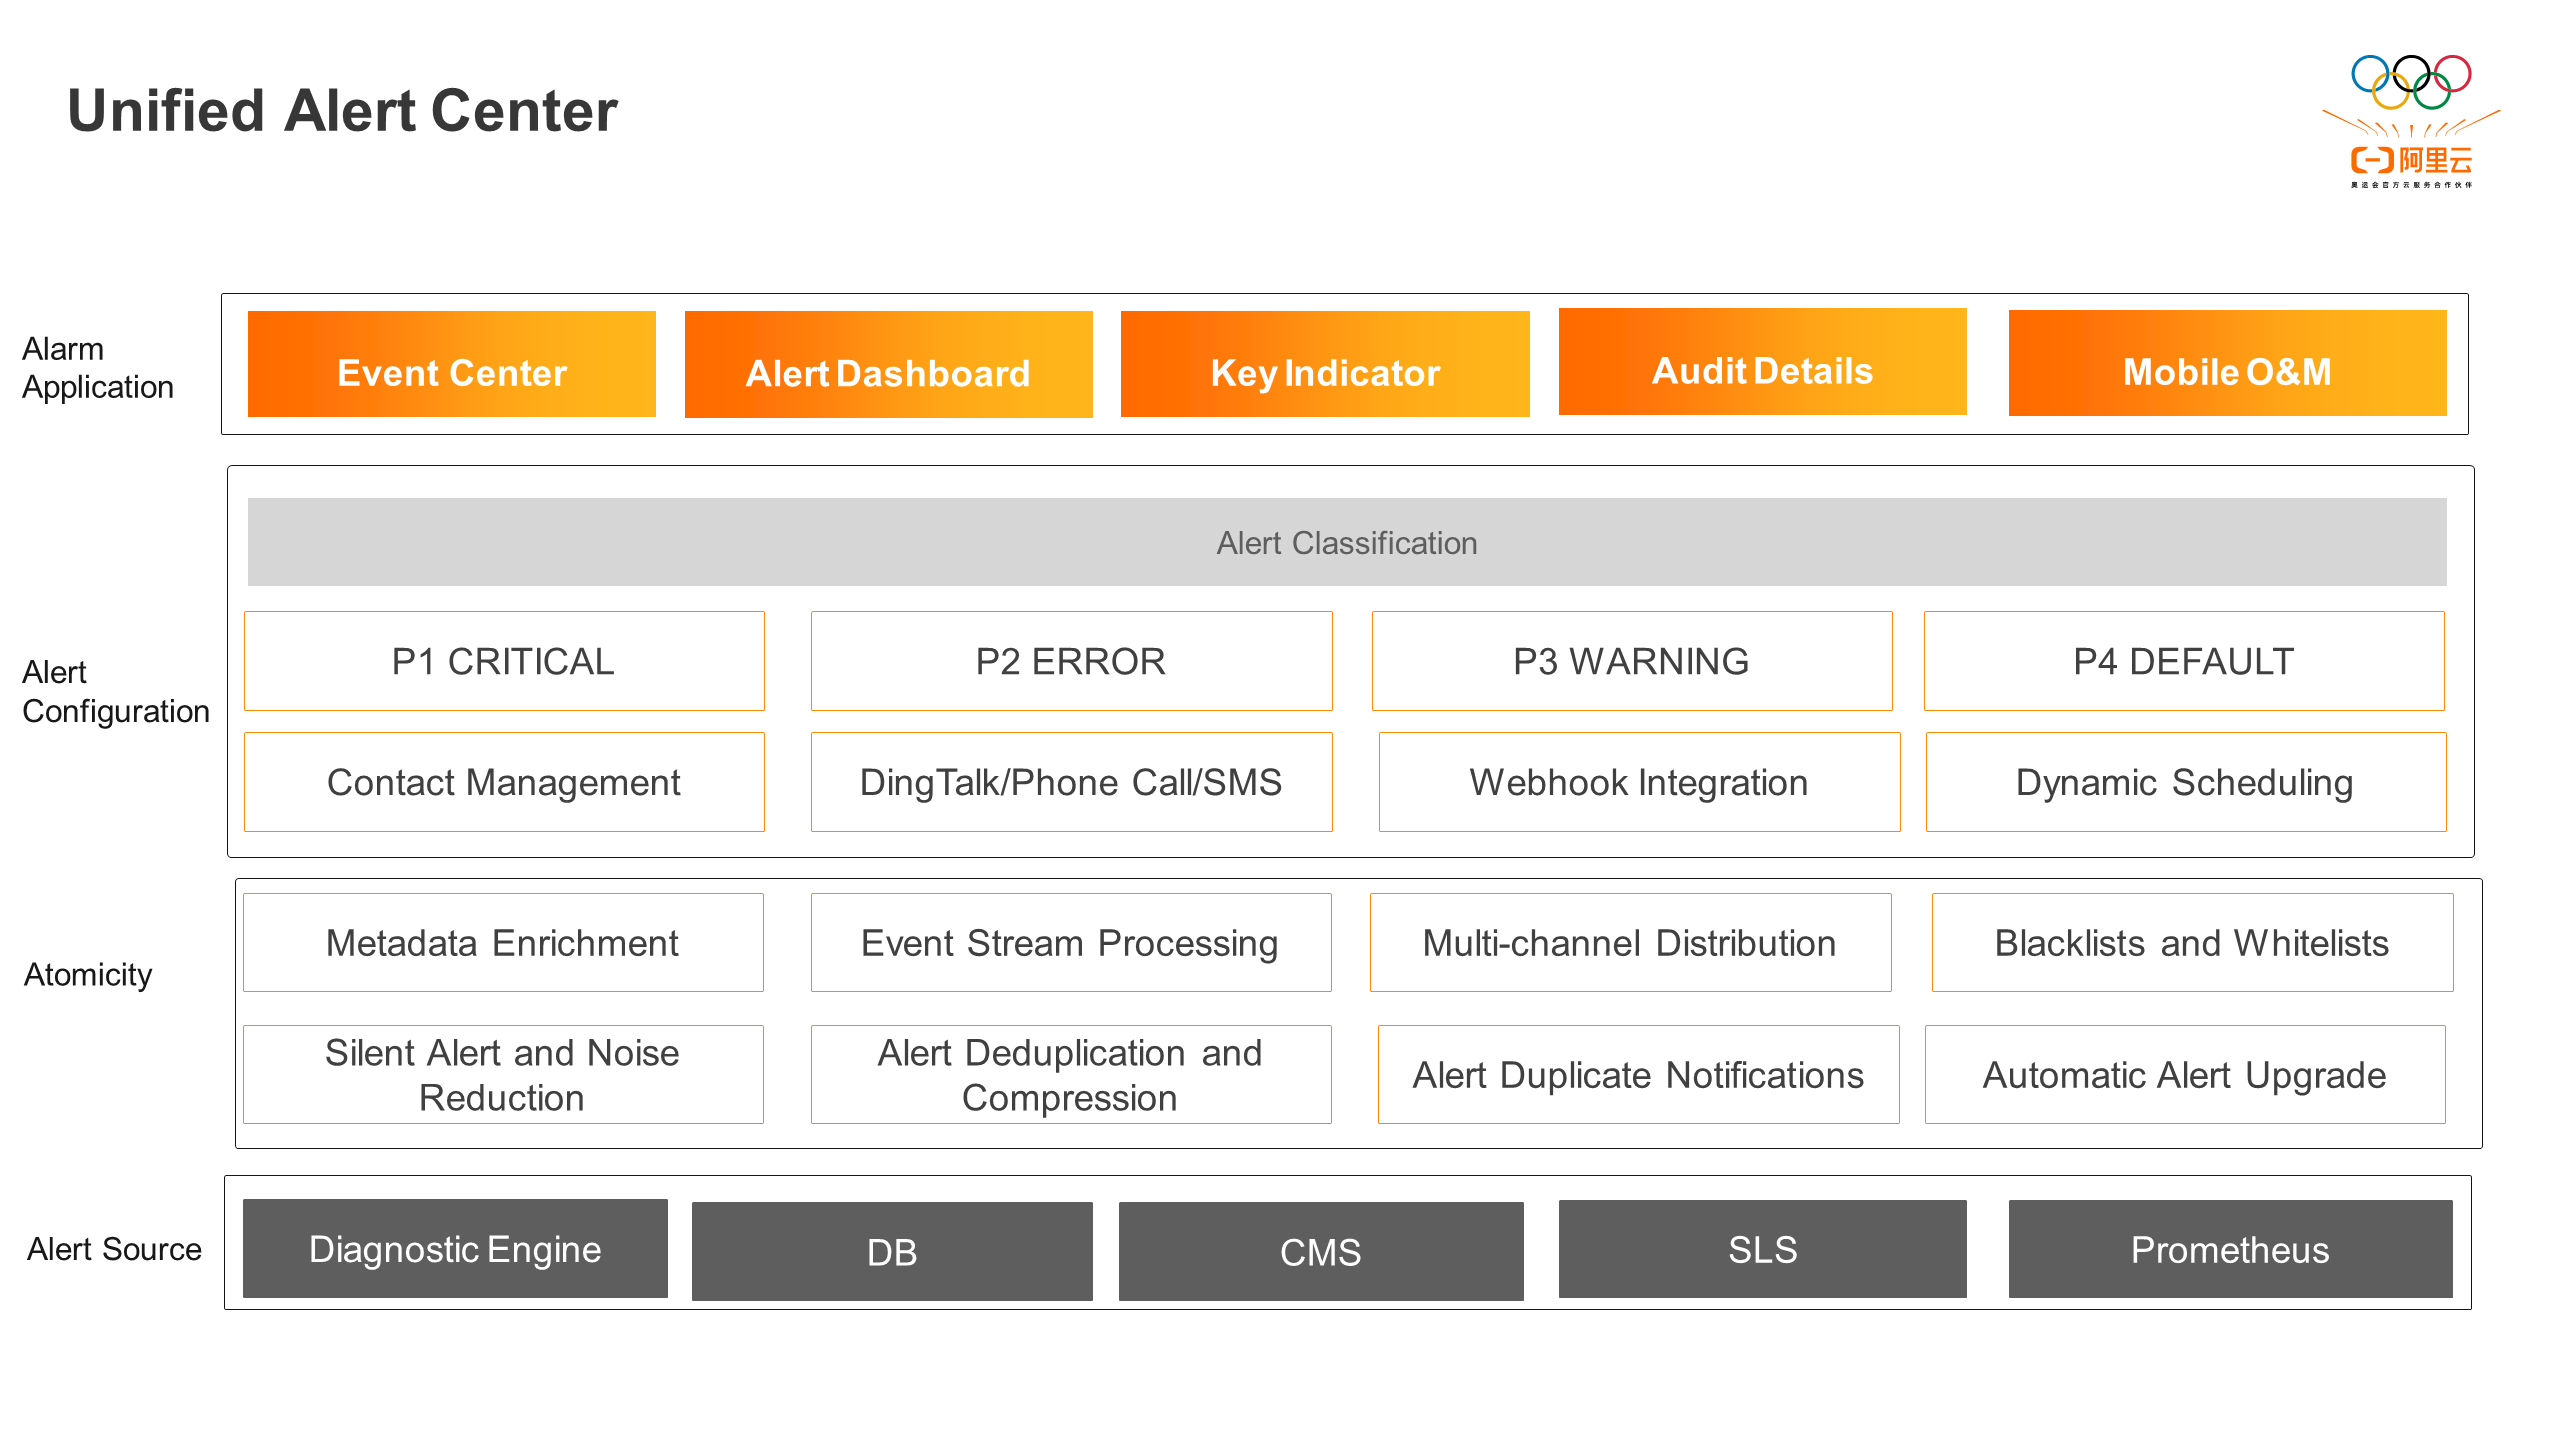
With the improvement of active discovery capability and the enhancement of diagnostic coverage, different types of alerts are mixed together. If R&D personnel still use the same way to verify and troubleshoot alerts, there will often be cases where alert processing is not timely and alert missing occurs, resulting in the situation that even though the diagnostic engine has detected the problem, due to improper internal alert processing, there are still complaints from customers.
Effective handling of alerts depends on the accuracy of the alerts themselves, which means it is necessary to reduce false positives, false negatives, and convergence of invalid alerts. On the other hand, it depends on the diversion of alerts. That is, adopt different processing forms for alerts of different categories and with different impacts to allocate limited energy more reasonably and ensure that problems can be effectively solved.
Based on the fault level of Alibaba Cloud and the business characteristics of SAE, SAE classifies alerts into four levels:
| Alert Level | Description | Solution | MTTD (Mean Time to Detect) | MTTA (Mean Time to Acknowledge) | MTTR (Mean Time to Recover) |
| P1 critical | High risk that requires immediately handling exceptions that affect product core SLA and SLO, as well as a large number of customers or those with high GC levels. | Phone call + SMS + DingTalk alert | 1 min | 5 min | 10 min |
| P2 error | Medium risk that requires quickly handling data plane exceptions that affect a small number of customers or those with medium and high GC levels. | SMS + DingTalk alert, supplemented by the alert escalation policy | 1 min | 10 min | 1h |
| P3 warning | Low risk that requires handling control plane exceptions that affect individual users. | DingTalk alerts, supplemented by the alert escalation policy | 1 min | 1h | 24h |
| P4 default | Potential risks that can be handled regularly. There is no or almost no impact on users. | Silence alerts, supplemented by the alert escalation policy | 1h | 24h | 7d |
SAE takes the core SLA and SLO indicators of the product as the traction, sorts out all existing alerts and new alerts, and configures the default alert level. At the same time, it implements an alert escalation mechanism. When an alert is issued, the unified alert center will count the number of applications, users, and alert increments affected by all alerts of the same type within the time window between alert generation and alert resolution, and determine whether the alert should be escalated based on the escalation policy. The upgrade policy is as follows:
| Alert trace | P4->P3 | P3->P2 | P2->P1 |
| Control trace | - | Upgrade to P2 if the number of affected applications is greater than or equal to 100. Upgrade to P2 if the number of GC6/CG7 users is greater than or equal to 10. Last for 60 minutes |
Upgrade to P1 if the number of affected applications is greater than or equal to 200. Upgrade to P1 if the number of GC6/CG7 users is greater than or equal to 50. Last for 60 minutes |
| Data trace + runtime | Upgrade to P3 if the number of affected applications is greater than or equal to 50. Upgrade to P3 if the number of GC6/CG7 users is greater than or equal to 5. | Upgrade to P2 if the number of affected applications is greater than or equal to 100. Upgrade to P2 if the number of GC6/CG7 users is greater than or equal to 10. | Upgrade to P1 if the number of affected applications is greater than or equal to 200. Upgrade to P1 if the number of GC6/CG7 users is greater than or equal to 50. |
SAE unified alert center uses the ARMS alert dashboard to quantify the industry-standard emergency response metrics MTTD, MTTA, and MTTR to measure the quality of alert handling. At present, through the fine-grained alert classification system and alert escalation mechanism, alert problems can be efficiently diverted, and research and development personnel can solve urgent problems in a more targeted manner, thus effectively improving the alert reach rate and processing efficiency.
In addition to informing internal R&D personnel of platform-side problems, the SAE unified alert center will also manage, store, analyze, and display events in the form of a product-based event center, and transmit the diagnosed user-side problems and notices that need attention to customers, so that customers can respond to faults in a timely manner and perform O&M to prevent further deterioration of problems.
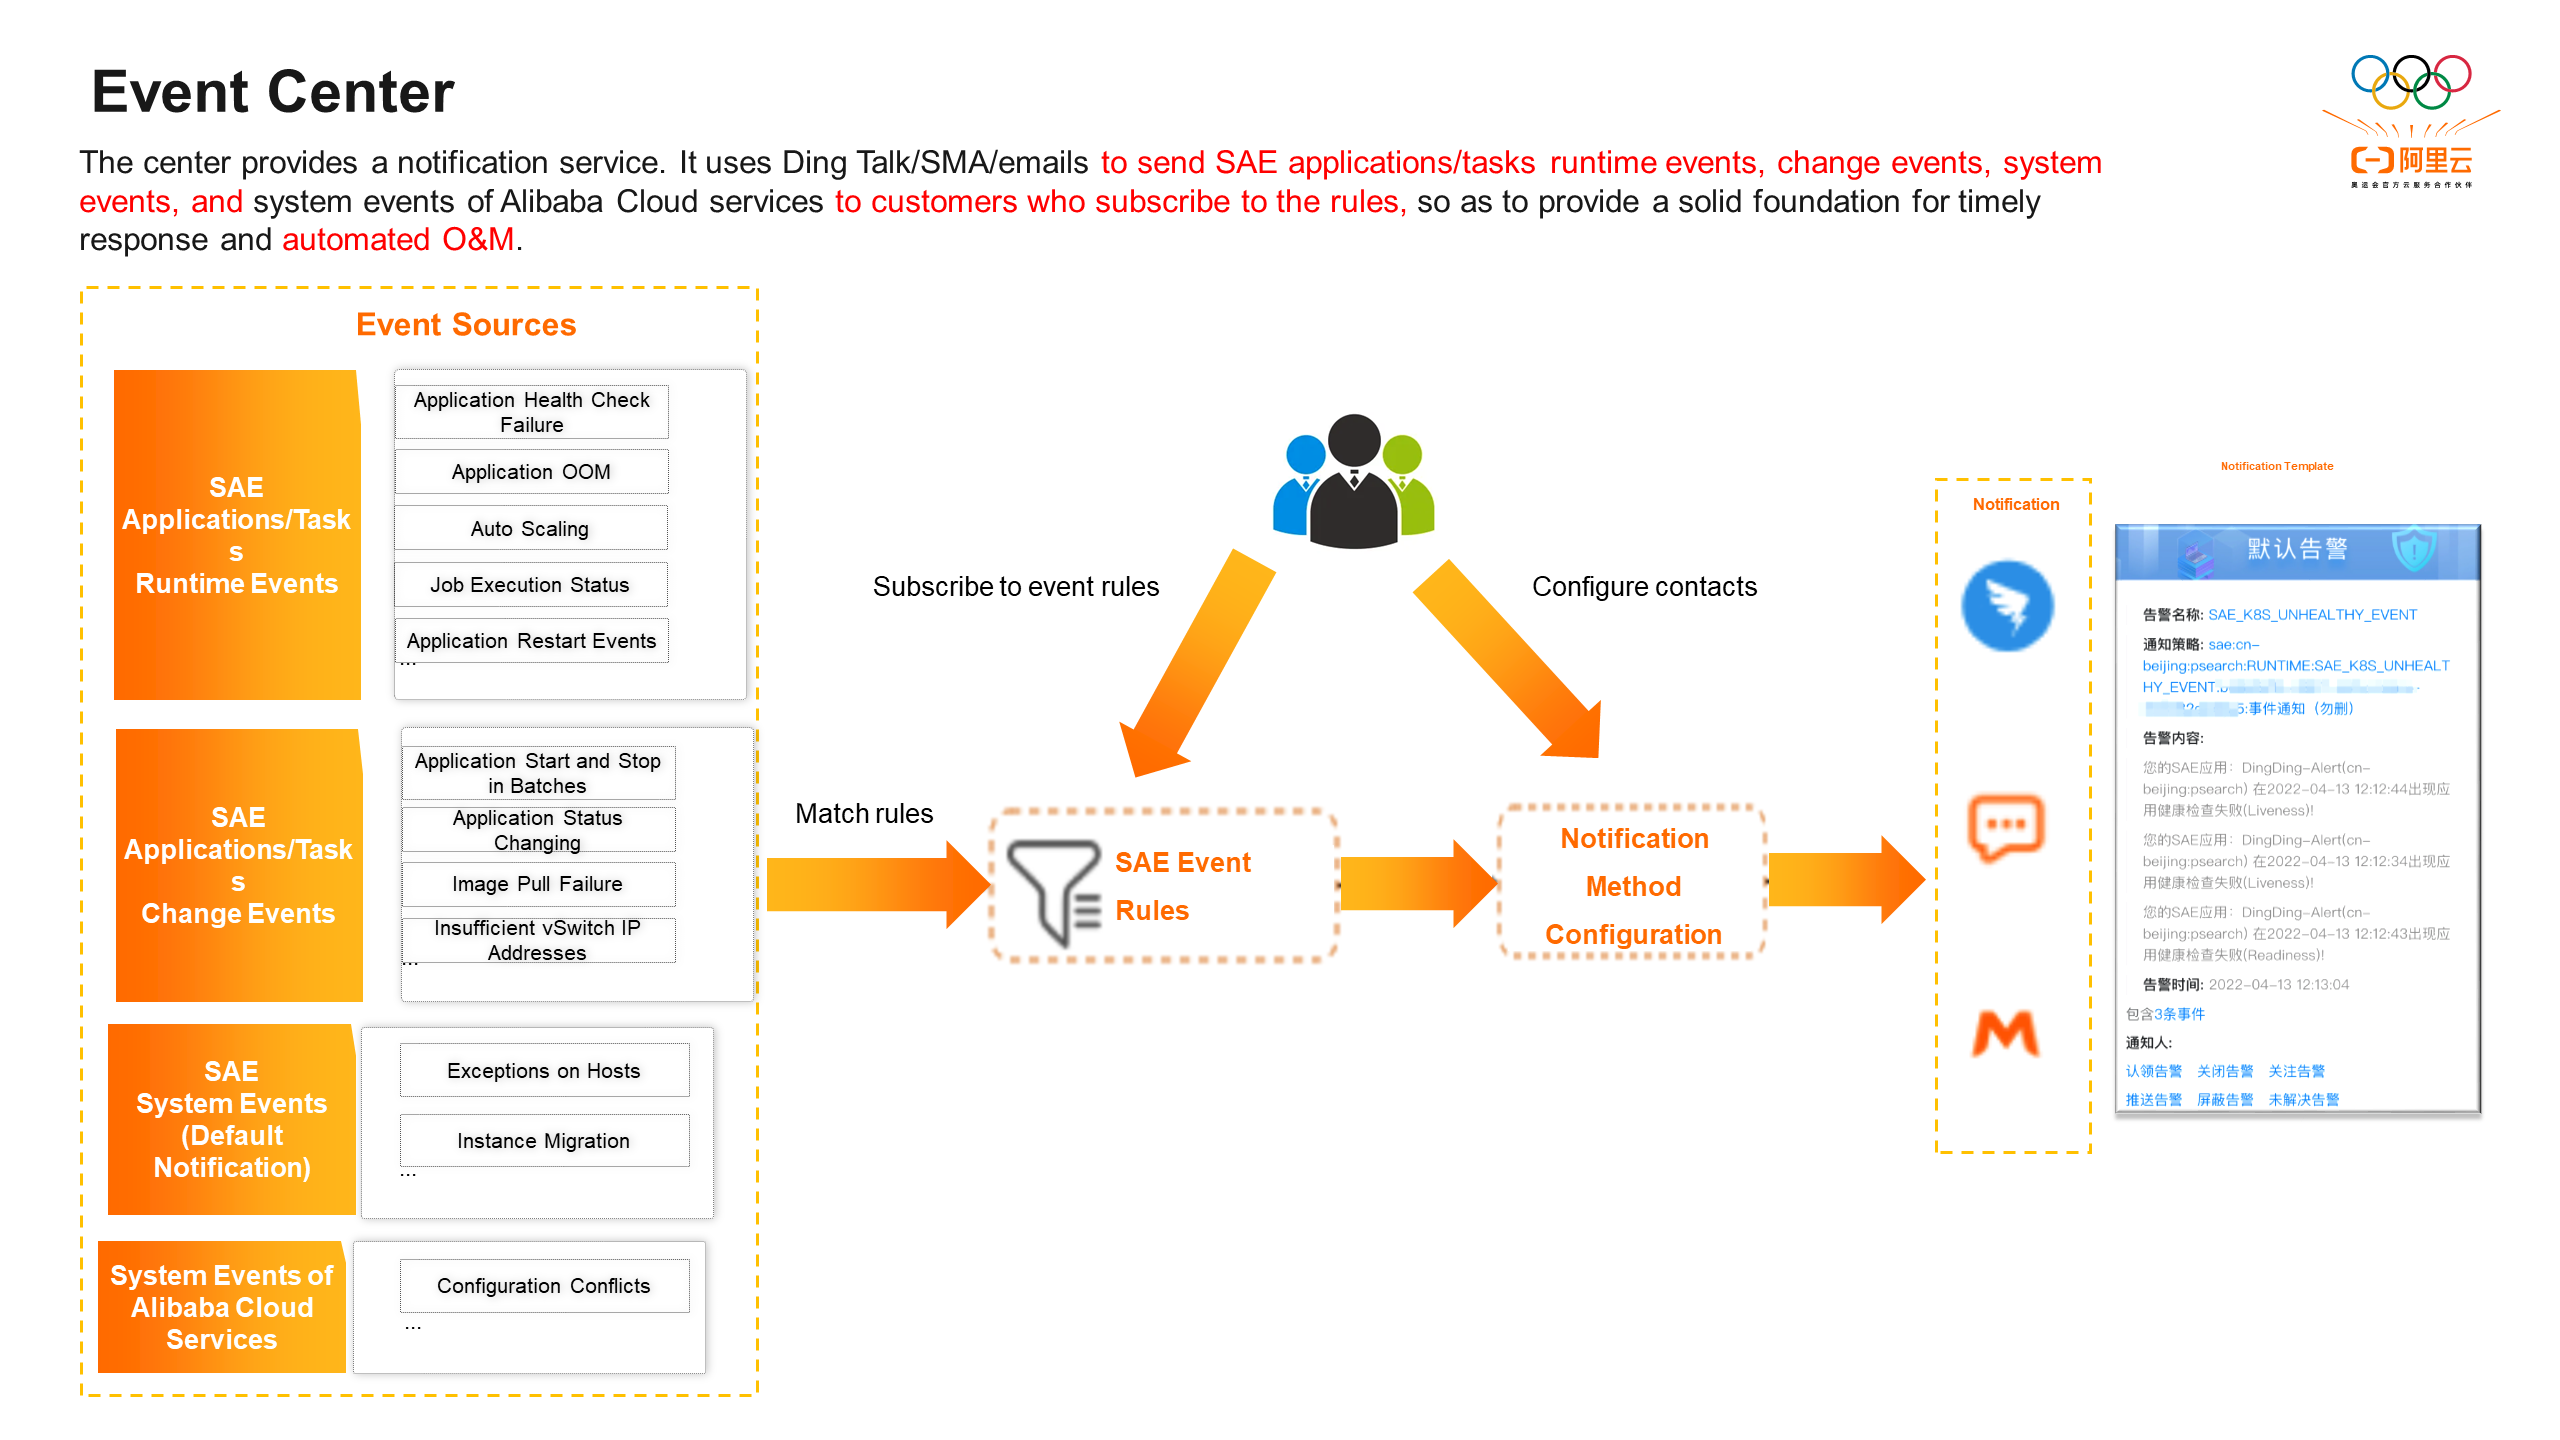
Currently, SAE Event Center classifies events into the following categories:
Runtime events, which are generated during application running and require users to actively subscribe to.
Change events, which are generated when users change O&M and require users to actively subscribe to.
System events, which are defined within the SAE system and do not require users to actively subscribe to them. They are enabled by default. When an event occurs, it will be notified to the user's primary account through Cloud Pigeon.
At the same time, as an application hosting PaaS platform, SAE integrates many Alibaba Cloud products and provides a unified management view for users. However, the disadvantage of this mode is that users often give feedback on the problems of other cloud products. SAE also needs to identify and define the cloud product to which exceptions should belong. Meanwhile, the weak hosting mode of SAE often leads to conflicts between user operations and platform operations, resulting in mutual overriding or failure.
In response to such issues, the event center will not only disclose its own platform events, but also override SAE-related cloud products and disclose them in the form of cloud product events. The specific issues will be divided into the following four categories:
• Abnormal indicators (depends on CloudMonitor): SLB listeners lose packets, EIPs lose packets due to the inbound and outbound speed limits, and bandwidth is full.
• Full quota (depends on the quota center): The number of SLB instances, the number of listeners, the number of backend servers, and the number of EIPs exceed the upper limit.
• Configuration conflicts: in SLB and ALB products and between gateway routing products.
• Resources deleting: NAS file systems, mount sources, mount directories, OSS buckets, AK/SK, mount directories, SLS projects, and logstores.
In the console, you can select the event items to be subscribed to based on the application, namespace, and region, and configure notification policies such as the detection cycle, trigger threshold, and contacts. This way, you can reach your concerns in real time.
When an alert is generated, SAE R&D personnel follow these steps: log in to the Operation and Maintenance (O&M) platform, locate the corresponding application or instance, analyze and determine the cause of the exception, and perform the necessary O&M operations. The problem-solving process involves multiple preliminary steps, which leads to a decrease in efficiency. Additionally, R&D personnel cannot always be beside their computers, and the O&M platform is not optimized for mobile devices. This makes it inconvenient to handle alerts when there is no computer available during commutes or weekends.
Based on the concept of ChatOps, real-time communication tools automatically perform corresponding actions based on the dialogue. SAE customizes the DingTalk card style to display the alert content and enrich the diagnostic context. Common operations such as deleting instances, freeing instances, restarting applications, stopping diagnostics, temporarily stopping alerts, etc. are fixed at the bottom of the card. This allows R&D personnel to perform one-click O&M on their mobile phones using DingTalk anytime and anywhere, improving overall efficiency and R&D experience.
In the future, one-click O&M will evolve into automated O&M. It will automatically perform deterministic O&M operations when alerts are generated, such as clearing long-standing resources, managing full disks, handling accumulated tasks, and migrating node instances. It aims to achieve automatic fault isolation and self-recovery in the near future.
Stability construction is a long-term investment that deserves focused attention. We should admire and strive to be proactive in maintaining stability, rather than being reactive firefighting heroes. It is essential to design systems and architectures from a systemic perspective. Discovering and solving hidden corner cases is also a testament to the technical expertise of personnel. SAE will continue to optimize and enhance stability construction to achieve early prevention, proactive detection, accurate identification, and rapid recovery. Moreover, SAE will remain user-centered, meeting user demands and building a Serverless PaaS platform with open-source, minimalist, and cutting-edge technology.
99 posts | 7 followers
FollowAlibaba Developer - December 16, 2021
Aliware - March 22, 2021
Alibaba Cloud Native - October 9, 2021
Alibaba Cloud New Products - December 4, 2020
Alibaba Cloud Native Community - July 20, 2021
Alibaba Cloud Native Community - June 29, 2022
99 posts | 7 followers
Follow Serverless Application Engine
Serverless Application Engine (SAE) is the world's first application-oriented serverless PaaS, providing a cost-effective and highly efficient one-stop application hosting solution.
Learn More Cloud-Native Applications Management Solution
Accelerate and secure the development, deployment, and management of containerized applications cost-effectively.
Learn More Function Compute
Alibaba Cloud Function Compute is a fully-managed event-driven compute service. It allows you to focus on writing and uploading code without the need to manage infrastructure such as servers.
Learn More Container Compute Service (ACS)
A cloud computing service that provides container compute resources that comply with the container specifications of Kubernetes
Learn MoreMore Posts by Alibaba Cloud Serverless