Use LoongCollector to collect Nginx logs from an ECS instance into Simple Log Service (SLS). Within 30 minutes, you can configure log collection, analyze data with SQL, view a dashboard, set up alerts, and clean up resources to avoid fees.

Prerequisites
Activate SLS and prepare an account
Activate SLS: If this is your first time, log on to the Simple Log Service console and follow the on-screen instructions to activate the service.
Prepare an account:
Alibaba Cloud account: Has full permissions by default.
RAM user: If you use a RAM user, you must grant it the required permission policies:
AliyunLogFullAccess: Grants permissions to create and manage SLS resources such as projects and logstores.AliyunECSFullAccess: Grants permissions to install the collection agent on an ECS instance.AliyunOOSFullAccess: Grants permissions to automatically install the collection agent on an ECS instance through Operation Orchestration Service (OOS).
In a production environment, you can create custom permission policies for more granular control over RAM user permissions.
Prepare an ECS instance
Ensure the ECS instance security group allows outbound traffic on port 80 (HTTP) and port 443 (HTTPS).
Generate mock logs
Create a script file named
generate_nginx_logs.shand paste the following content. This script writes a standard Nginx access log entry to/var/log/nginx/access.logevery 5 seconds.Grant execution permissions:
chmod +x generate_nginx_logs.sh.Run the script in the background:
nohup ./generate_nginx_logs.sh &.
Create a project and logstore
A project isolates and manages data in SLS. A logstore holds the log data within a project.
Log on to the Simple Log Service console.
Click Create Project:
Region: Select the same region as your ECS instance to collect logs over the internal network.
Project Name: Enter a globally unique name, such as
nginx-quickstart-abc.
Keep the default settings for other configurations and click Create.
After the project is created, click Create Logstore.
Enter a Logstore Name (for example,
nginx-access-log), keep the default settings for the other configurations, and click OK.By default, a Standard logstore is created, which is billed based on the volume of data written.
Install LoongCollector
After the logstore is created, click OK in the confirmation dialog box to open the Quick Data Import panel.
On the Nginx - Text Logs card, click Integrate Now.
Machine Group Configurations:
Scenario: Servers
Installation Environment: ECS
Click Create Machine Group. In the panel that appears, select the target ECS instance.
Click Install and Create Machine Group. After the installation is successful, enter a Name for the machine group, such as
my-nginx-server, and then click OK.NoteIf the installation fails or remains pending, ensure the ECS region is the same as the project region.
Click Next to proceed to the heartbeat status check.
When you create a machine group for the first time, if the heartbeat status is FAIL, click Automatic Retry. The status changes to OK in about two minutes.
Create a collection configuration
After the heartbeat status is OK, click Next to go to the Logtail Configurations page:
: Enter a name for the configuration, such as
nginx-access-log-config.: Enter
/var/log/nginxin the first box andaccess.login the second box.Processor Configurations:
Log Sample: Click Add Sample Log and paste a sample log entry:
192.168.*.* - - [15/Apr/2025:16:40:00 +0800] "GET /nginx-logo.png HTTP/1.1" 0.000 514 200 368 "-" "Mozilla/5.0 (Windows NT 10.0; Win64; x64) AppleWebKit/537.36 (KHTML, like Gecko) Chrome/131.0.*.* Safari/537.36"Processing Method: Click Data Parsing (NGINX Mode). In the NGINX Log Configuration section, configure log_format by copying and pasting the following content. Then, click Confirm.
log_format main '$remote_addr - $remote_user [$time_local] "$request" '
                    '$status $body_bytes_sent "$http_referer" '
                    '"$http_user_agent" $request_time $request_length';
In a production environment, the
log_formatspecified here must match the definition in your Nginx configuration file (usually in/etc/nginx/nginx.conf).Log parsing example:
Raw log
Structured log
192.168.*.* - - [15/Apr/2025:16:40:00 +0800] "GET /nginx-logo.png HTTP/1.1" 0.000 514 200 368 "-" "Mozilla/5.0 (Windows NT 10.0; Win64; x64) AppleWebKit/537.36 (KHTML, like Gecko) Chrome/131.0.*.* Safari/537.36"body_bytes_sent: 368 http_referer: - http_user_agent: Mozilla/5.0 (Windows NT 10.0; Win64; x64) AppleWebKit/537.36 (KHTML, like Gecko) Chrome/131.0.x.x Safari/537.36 remote_addr:192.168.*.* remote_user: - request_length: 514 request_method: GET request_time: 0.000 request_uri: /nginx-logo.png status: 200 time_local: 15/Apr/2025:16:40:00
Click Next to go to the Query and Analysis Configurations page. It takes about 1 minute for the collection configuration to take effect. Click Automatic Refresh. Preview data indicates that the configuration is effective.
Query and analyze logs
Click End to go to the End page, and then click Query Log. You are redirected to the query and analysis page of the target logstore. Use SQL to extract key metrics from structured logs. Set the time range to Last 15 Minutes:
If an error pop-up appears, the index is not yet configured. Close it and wait about 1 minute until you can view log content from the access.log file.
Example 1: Total page views (PV)
Count the total number of log entries within the specified time range.
* | SELECT count(*) AS pvExample 2: Requests and error rate per minute
Calculate the total requests, error requests (HTTP status code ≥ 400), and error rate per minute.
* | SELECT
  date_trunc('minute', __time__) as time,
  count(1) as total_requests,
  count_if(status >= 400) as error_requests,
  round(count_if(status >= 400) * 100.0 / count(1), 2) as error_rate
GROUP BY time
ORDER BY time DESC
LIMIT 100
Example 3: PVs by request method (GET, POST, etc.)
Group and count page views by minute and request method (GET, POST, etc.).
* |
SELECT
    date_format(minute, '%m-%d %H:%i') AS time,
    request_method,
    pv
FROM (
    SELECT
        date_trunc('minute', __time__) AS minute,
        request_method,
        count(*) AS pv
    FROM
        log
    GROUP BY
        minute,
        request_method
)
ORDER BY
    minute ASC
LIMIT 10000
Visualize data on a dashboard
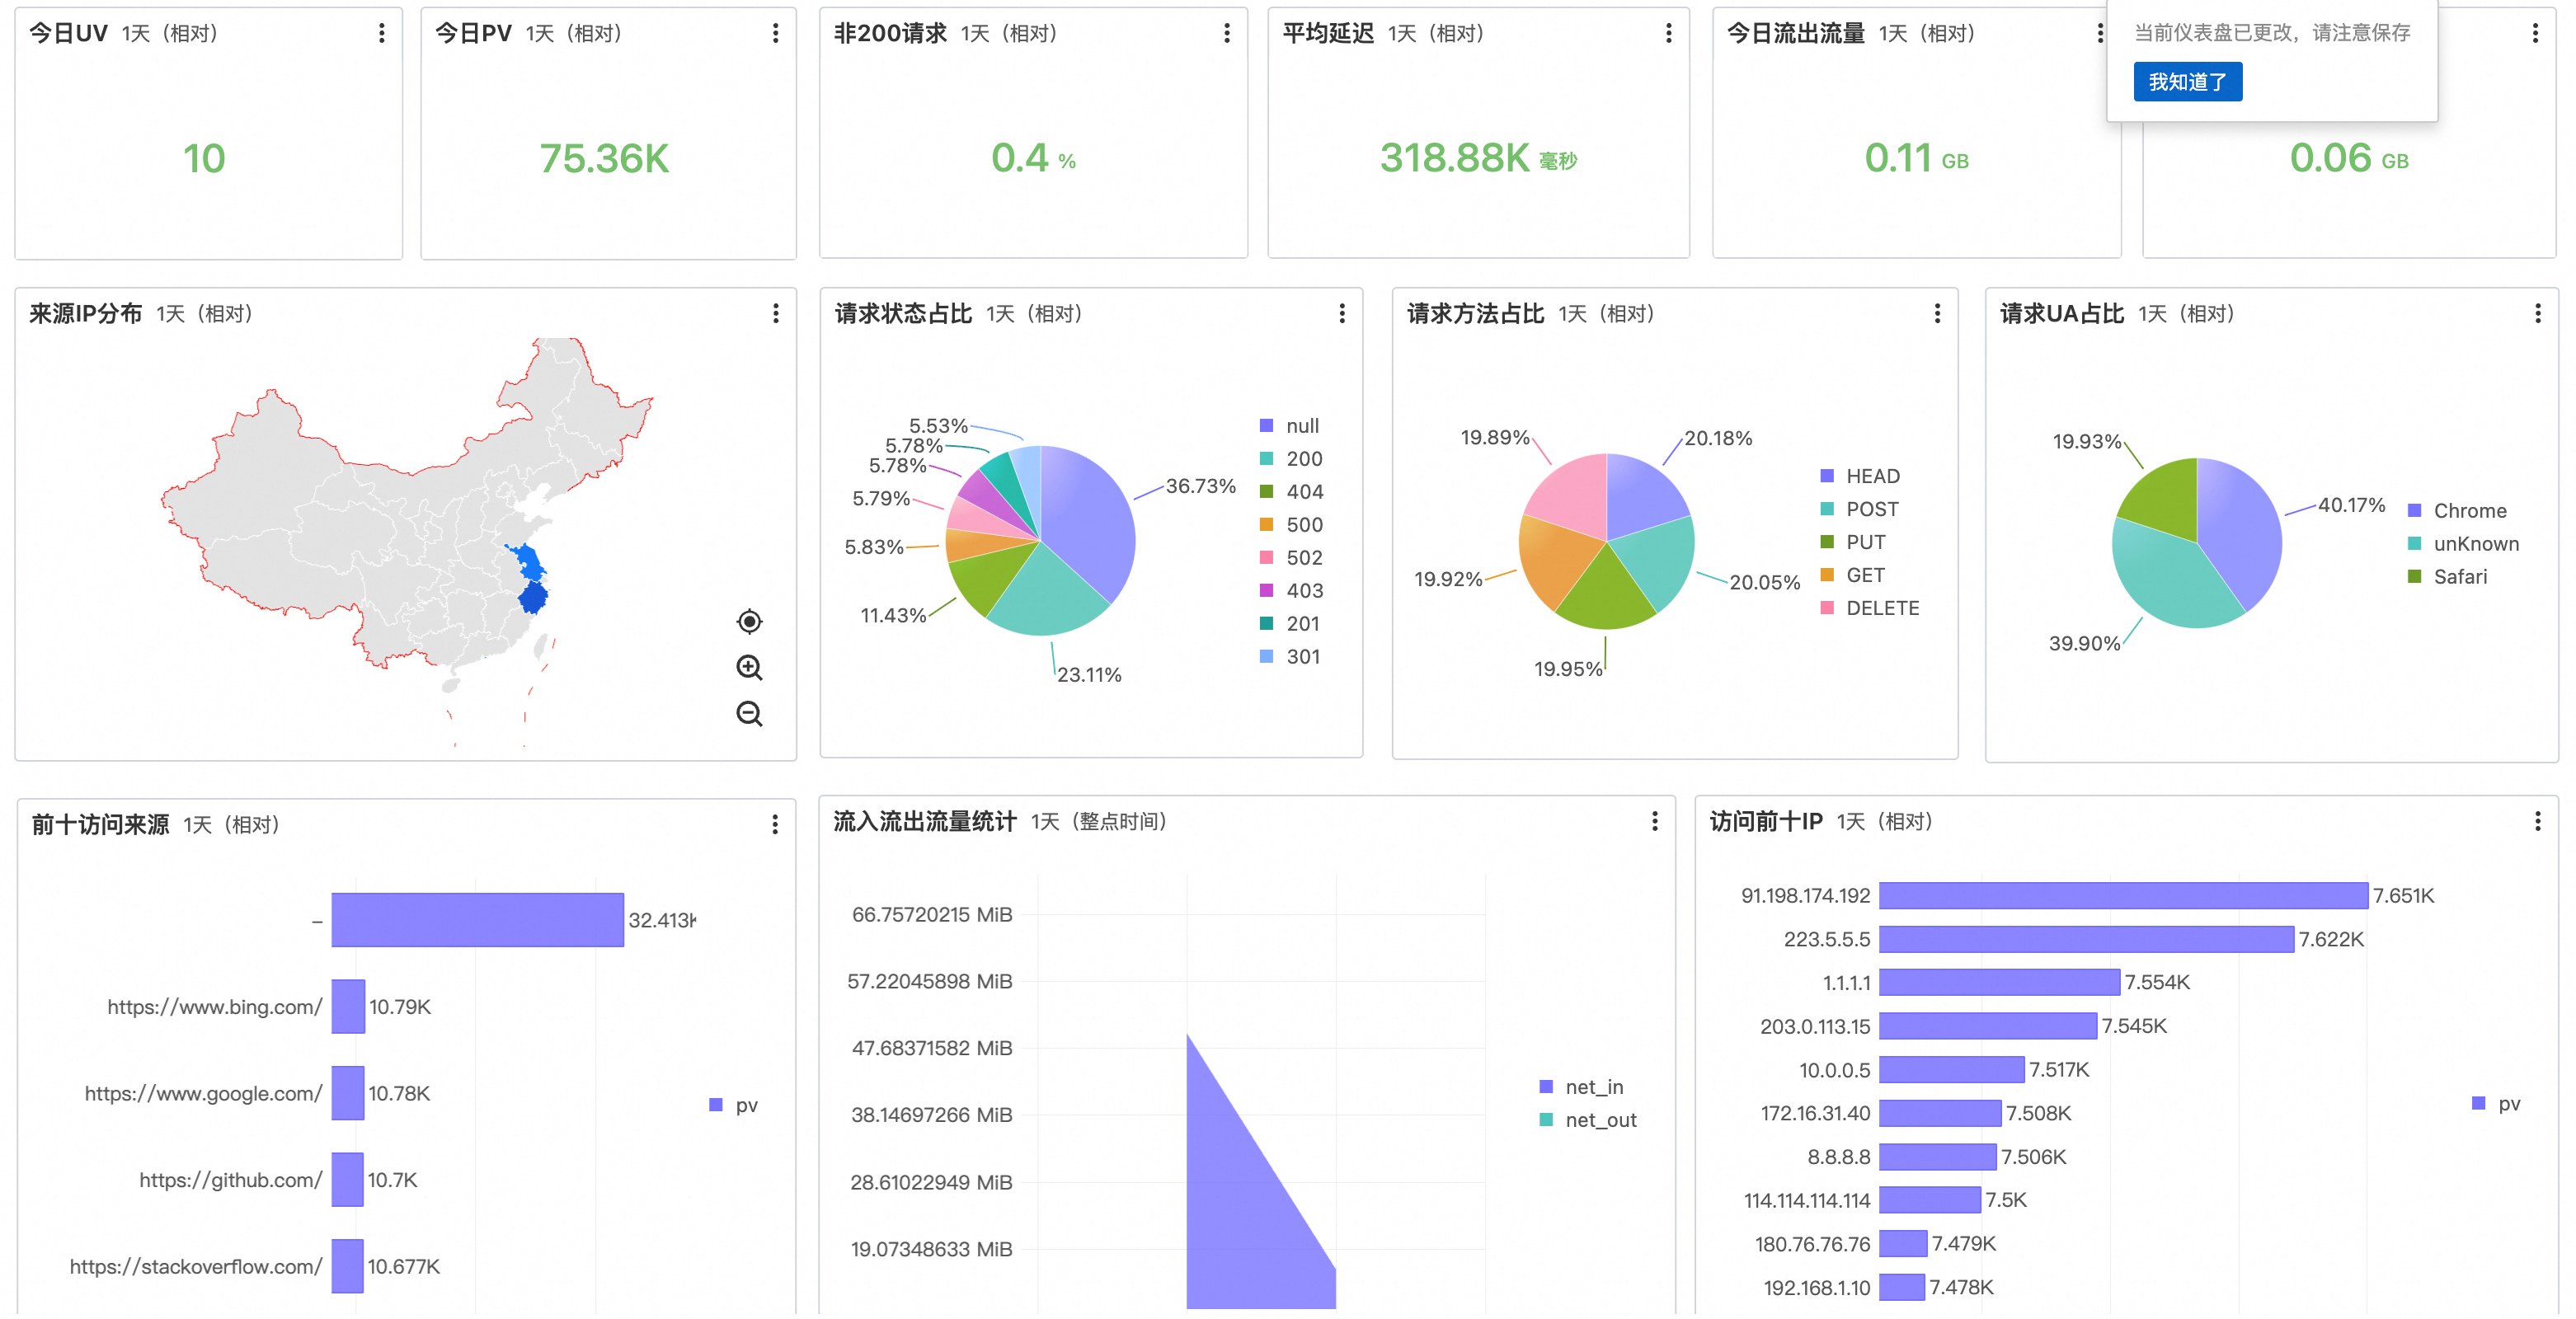
After you configure the Nginx parsing processor, SLS automatically creates a preset dashboard named nginx-access-log_Nginx Access Log.
In the left-side navigation pane, choose
 .
.Click the dashboard name to view charts for key metrics: PVs, UVs, error rate, and request method distribution.
Customize charts based on your business needs.
Configure monitoring and alerts
Create an alert rule to receive notifications when abnormal behavior occurs, such as a spike in errors.
In the left-side navigation pane, click
 Alerts.
Create an action policy:
On the tab, click Create.
Configure the ID and Name (for example,
send-notification-to-admin).In Primary Action Policy, click
 Action Group.
Select a Notification Method (for example, SMS), configure the Recipient, and select an Alert Template.
Click Confirm.
Create an alert rule:
Switch to the Alert Monitoring Rule tab and click Create Alert.
Rule name: Enter a descriptive name, such as
Too many server 5xx errors.Query Statistics: Click Add and configure the query conditions.
Logstore: Select
nginx-access-log.Query Time Range: 15 minutes (Relative).
: Enter
status >= 500 | SELECT *.Click Preview to confirm that you can query data, and then click OK.
Trigger Condition: Set the condition to trigger a Critical alert when Specific number of entries is >100.
This configuration triggers an alert if more than 100 5xx errors occur within 15 minutes.
: Select SLS Notification and Enable it.
Action Policy: Select the action policy you created in the previous step.
Repeat Interval: Set to 15 minutes to prevent repeated notifications.
Click OK to save the alert rule.
Verification: When the trigger condition is met, the configured notification channel receives an alert. You can view all triggered alerts on the Alert History page.
Resource cleanup
Clean up all resources created in this tutorial to avoid ongoing fees.
Stop the log generation script
Log on to the ECS instance and run the following command to stop the background script.
kill $(ps aux | grep '[g]enerate_nginx_logs.sh' | awk '{print $2}')Uninstall LoongCollector (optional)
Replace
${region_id}withcn-hangzhou, or for optimal performance, replace${region_id}with the region ID of your ECS instance.wget https://aliyun-observability-release-${region_id}.oss-${region_id}.aliyuncs.com/loongcollector/linux64/latest/loongcollector.sh -O loongcollector.sh;Run the uninstall command.
chmod +x loongcollector.sh; sudo ./loongcollector.sh uninstall;
Delete the project
On the project list page of the Simple Log Service console, find the project that you created, such as
nginx-quickstart-xxx.In the Actions column, click Delete.
In the panel that appears, enter the project name and select a reason for deletion.
Click OK. Deleting a project removes all associated resources, including logstores, collection configurations, dashboards, and alert rules.
WarningDeleting a project permanently removes all log data and configurations. This action cannot be undone.
Next steps
Now that you have collected, queried, visualized, and monitored logs, explore the following resources to learn more:
Data collection methods: choose the right method for your scenario.
Storage resource hierarchy: plan resource lifecycle and shard allocation.
FAQ
Inconsistent log time after collection
By default, the __time__ field uses the server arrival time. To use the timestamp from the original log, add a time parsing plug-in to the collection configuration.
Charges for creating a project and logstore
Creating a logstore reserves shard resources by default, which may incur active shard lease fees. Why am I charged for active shard lease fees?
Troubleshooting log collection failures
Log collection with Logtail may fail due to abnormal Logtail heartbeats, collection errors, or incorrect Logtail configurations. Troubleshooting Logtail log collection failures.
Failure to analyze logs
Log analysis requires field indexes with the statistics feature enabled. Verify the index configuration of your logstore.
Stopping billing
Simple Log Service cannot be disabled after it is activated. If you no longer want to use the service, you can stop billing by deleting all projects under your account.