A store is the basic unit for data storage and query in SLS. SLS provides three store types for different data: Logstore, Metricstore, and Eventstore.
Choose a store type
These store types differ in their underlying data models. Choose the type that matches your data structure: logs, metrics, or events. If you have no special requirements, use a Logstore by default.
|
Store type |
Description |
|
Logstore |
|
|
Metricstore |
Metric: A time series composed of a unique identifier and a sequence of data points. Use a metricstore to efficiently store and query time-series data. |
|
Eventstore |
Event: A record of a significant occurrence, such as a monitoring alert or the result of a periodic inspection. Use an eventstore to store discrete, event-based data. |
Logstore
A logstore is the basic unit for storing and querying log data. Each logstore belongs to a project. You can create multiple logstores within a project to isolate different types of logs from the same application. For example, to collect operation logs, application logs, and access logs for app A, create a project named app-a. Within this project, create logstores named operation_log, application_log, and access_log to store each log type separately.
Specify a logstore when writing, querying, analyzing, processing, consuming, or shipping logs:
-
Collect and write logs to a logstore.
-
Store logs in a logstore for processing, consumption, or delivery.
-
Create indexes in a logstore to query and analyze logs.
Metricstore
A metricstore is the basic unit for storing and querying time-series data (metrics). Each metricstore belongs to a project. Create multiple metricstores in a project to separate different types of time-series data. For example, to collect basic host monitoring data, cloud service monitoring data, and application monitoring data, create a project named demo-monitor. Then, within this project, create metricstores named host-metrics, cloud-service-metrics, and app-metrics to store these data types separately.
Specify a metricstore when you write, query, analyze, or consume time-series data:
-
Collect time-series data into a metricstore as the collection unit.
-
Use a metricstore to store time-series data for analysis and consumption.
-
Query and analyze time-series data using Prometheus Query Language (PromQL), SQL-92, or SQL+PromQL syntax.
Eventstore
An eventstore is the basic unit for storing and querying event data. Each eventstore belongs to a project. Create multiple eventstores in a project to separate different event types, such as infrastructure anomaly events, business application events, and custom events.
Specify an eventstore when you write, query, analyze, or consume event data:
-
Collect event data with the eventstore as the collection unit.
-
Store event data and perform consumption operations with the eventstore as the storage unit.
References
Log group
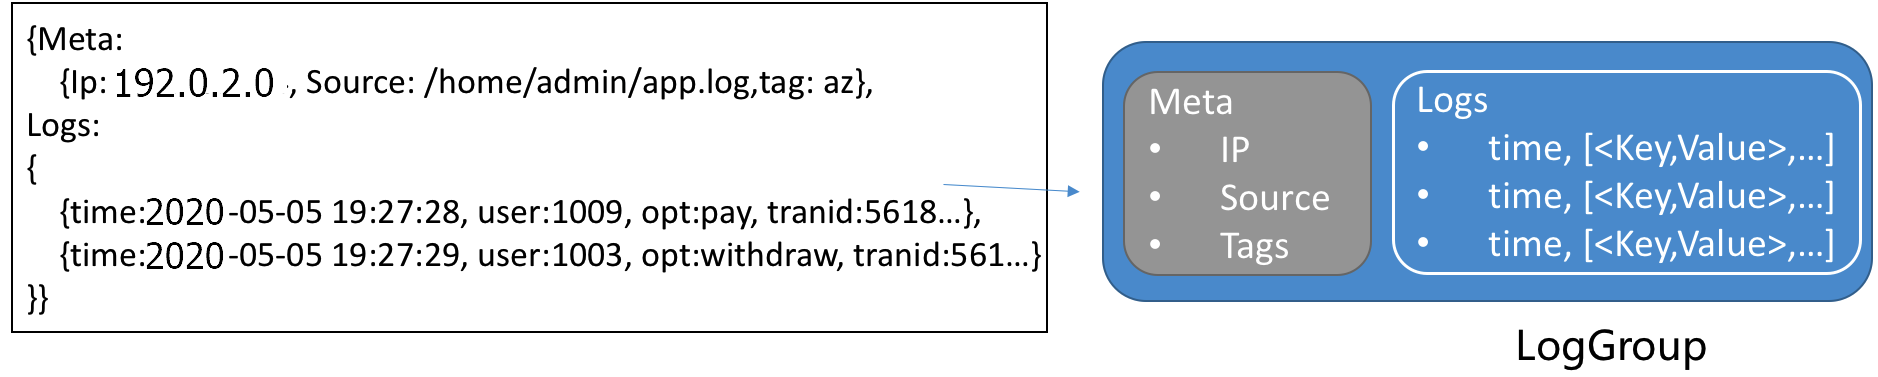
A log group bundles multiple logs as the basic read/write unit. Logs in the same group share metadata such as IP address and source. Bundling reduces I/O operations and improves efficiency. Maximum group size: 5 MB.
Log
A log records events or changes in a system over time. It can represent text files, system events, database BinLogs, or time-series data. In SLS, a log uses a semi-structured model with five fields: topic, time, content, source, and tags. The following table lists the format requirements.
|
Field |
Description |
Format |
|
Topic |
SLS uses the reserved field The relationship among a logstore, topics, and shards is as follows:  |
A string of 0 to 128 bytes, including an empty string. If you do not need to distinguish between logs in a logstore, you can set the topic to an empty string when you collect logs. An empty string is a valid topic. |
|
Time |
The reserved field ( |
UNIX timestamp. |
|
Content |
The content of the log, which consists of one or more When you use Logtail in simple mode (single-line or multi-line) to collect logs, Logtail does not parse the log content. The entire raw log is uploaded to the content field. |
The following describes the
|
|
Source |
The reserved field ( |
A string of 0 to 128 bytes. |
|
Tags |
Log tags, which include the following:
|
A dictionary of string key-value pairs. In a log, tags are displayed with the |
Example
The following example uses a website access log to show the mapping between a raw log and the data model in SLS.
-
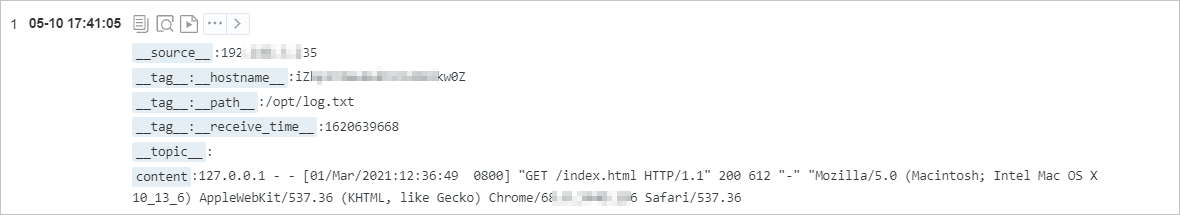
Raw log
127.0.0.1 - - [01/Mar/2021:12:36:49 0800] "GET /index.html HTTP/1.1" 200 612 "-" "Mozilla/5.0 (Macintosh; Intel Mac OS X 10_13_6) AppleWebKit/537.36 (KHTML, like Gecko) Chrome/68.0.3440.106 Safari/537.36 -
Log collected in simple mode. The entire raw log is saved in the content field.
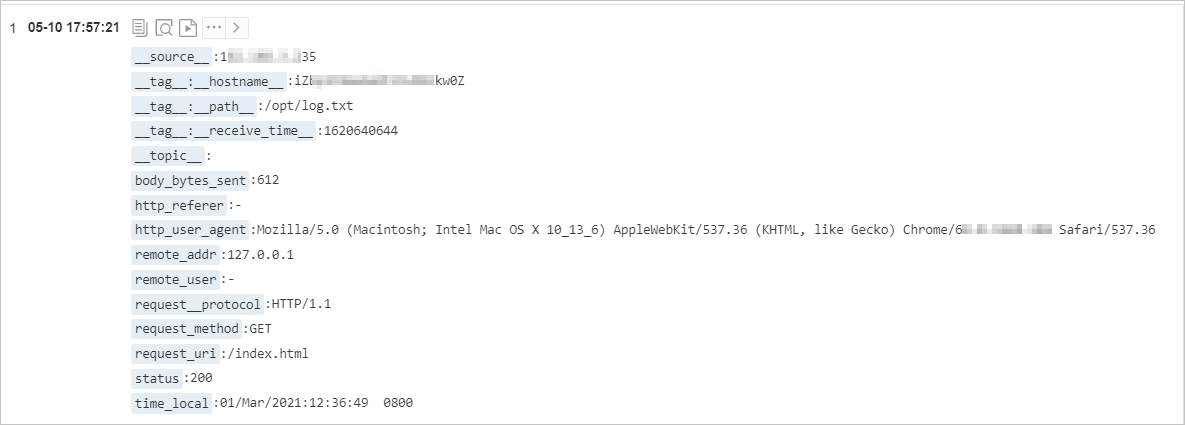
-
Log collected in regular expression mode. The log content is structured by extracting the content into multiple key-value pairs based on the configured regular expression.
Metric
Time-series data consists of a metric identifier and data points. Points with the same identifier form a time series. The SLS model is compatible with the Prometheus data model. All metricstore data is stored as time series.

Metric identifier
Each time series is uniquely identified by its metric name and a set of labels.
-
A metric name is a string that identifies the type of metric. The metric name must match the regular expression [a-zA-Z_:][a-zA-Z0-9_:]*. For example, http_request_total represents the total number of HTTP requests received.
-
Labels are a set of key-value pairs that identify the metric's attributes. The key must match the regular expression [a-zA-Z_][a-zA-Z0-9_]*. The value cannot contain a vertical bar (|). For example, method is POST, and URL is /api/v1/get.
Data point
A data point captures the value of a time series at a specific moment. Each point consists of a timestamp (nanosecond precision) and a double value.
Data structure
Time-series data uses the same Protobuf data encoding write protocol as logs. The identifier and data points are stored in the content field:
|
Field |
Description |
Example |
|
__name__ |
The metric name. |
nginx_ingress_controller_response_size |
|
__labels__ |
The label information. The format is Note
|
app#$#ingress-nginx|controller_class#$#nginx|controller_namespace#$#kube-system|controller_pod#$#nginx-ingress-controller-589877c6b7-hw9cj |
|
__time_nano__ |
Timestamps support multiple precisions (s, ms, us, ns) but are always normalized to microseconds (us) in query results for consistent calculations. |
1585727297293000 |
|
__value__ |
The value. |
36.0 |
Custom fields such as Topic, Source, or LogTags are not stored in the metricstore when written via the SDK. For more information, see Send metrics with SDKs.
Example
The following example shows a query for all raw time-series data for the `process_resident_memory_bytes` metric within a specified time range.
* | select * from "sls-mall-k8s-metrics.prom" where __name__ = 'process_resident_memory_bytes' limit all
Event
An event is a significant data record, such as a monitoring alert or the result of a periodic inspection job. Event data in SLS adheres to the CloudEvents specification, as described in the following table.
|
Field type |
Field name |
Required |
Data format |
Description |
|
Protocol |
|
Yes |
String |
The default value is |
|
|
Yes |
String |
The event ID. You can use |
|
|
|
Yes |
String |
The context in which an event occurred, such as the event source or the instance that published the event. |
|
|
|
Yes |
String |
The event type, such as |
|
|
|
No |
String |
The subject of the event. This field provides additional information to the |
|
|
|
No |
String |
The content type of the data value. The default is |
|
|
|
No |
URI |
The schema that the |
|
|
|
No |
JSON |
The specific event content. The format varies based on the source and type of the event. |
|
|
|
Yes |
Timestamp |
The timestamp of the event, formatted according to RFC 3339. Example: |
|
|
Extension |
|
Yes |
String |
The event title. |
|
|
Yes |
String |
The event description. |
|
|
|
Yes |
String |
The event status. Valid values:
|
Example
The following example shows the data for an alert event:
{
    "specversion": "1.0",
    "id": "af****6c",
    "source": "acs:sls",
    "type": "sls.alert",
    "subject": "https://sls.console.alibabacloud.com/lognext/project/demo-alert-chengdu/logsearch/nginx-access-log?encode=base64&endTime=1684312259&queryString=c3RhdHVzID49IDQwMCB8IHNlbGVjdCByZXF1ZXN0X21ldGhvZCwgY291bnQoKikgYXMgY250IGdyb3VwIGJ5IHJlcXVlc3RfbWV0aG9kIA%3D%3D&queryTimeType=99&startTime=1684311959",
    "datacontenttype": "application/cloudevents+json",
    "data": {
        "aliuid": "16****50",
        "region": "cn-chengdu",
        "project": "demo-alert-chengdu",
        "alert_id": "alert-16****96-247190",
        "alert_name": "Nginx Access Error",
        "alert_instance_id": "77****e4-1aad9f7",
        "alert_type": "sls_alert",
        "next_eval_interval": 300,
        "fire_time": 1684299959,
        "alert_time": 1684312259,
        "resolve_time": 0,
        "status": "firing",
        "severity": 10,
        "labels": {
            "request_method": "GET"
        },
        "annotations": {
            "__count__": "1",
            "cnt": "49",
            "desc": "Nginx has had 49 GET request errors in the last five minutes",
            "title": "Nginx Access Error Alert Triggered"
        },
        "results": [
            {
                "region": "cn-chengdu",
                "project": "demo-alert-chengdu",
                "store": "nginx-access-log",
                "store_type": "log",
                "role_arn": "",
                "query": "status >= 400 | select request_method, count(*) as cnt group by request_method ",
                "start_time": 1684311959,
                "end_time": 1684312259,
                "fire_result": {
                    "cnt": "49",
                    "request_method": "GET"
                },
                "raw_results": [
                    {
                        "cnt": "49",
                        "request_method": "GET"
                    },
                    {
                        "cnt": "3",
                        "request_method": "DELETE"
                    },
                    {
                        "cnt": "7",
                        "request_method": "POST"
                    },
                    {
                        "cnt": "6",
                        "request_method": "PUT"
                    }
                ],
                "raw_result_count": 4,
                "truncated": false,
                "dashboard_id": "",
                "chart_title": "",
                "is_complete": true,
                "power_sql_mode": "auto"
            }
        ],
        "fire_results": [
            {
                "cnt": "49",
                "request_method": "GET"
            }
        ],
        "fire_results_count": 1,
        "condition": "Count:[1] > 0; Condition:[49] > 20",
        "raw_condition": "Count:__count__ > 0; Condition:cnt > 20"
    },
    "time": "2023-05-17T08:30:59Z",
    "title": "Nginx Access Error Alert Triggered",
    "message": "Nginx has had 49 GET request errors in the last five minutes",
    "status": "error"
}
Trace
A trace records end-to-end processing of a single request, including all service calls and their durations. A trace represents the execution path of a transaction or process through a distributed system. Per the OpenTracing standard, a trace is a Directed Acyclic Graph (DAG) of spans, where each span represents a named, timed, and continuous execution segment. The full data structure is defined in Trace data format.