A dashboard is a data visualization tool in SLS. It uses charts to display key metrics, data, and analysis results. Charts automatically run query and analysis operations when you open or refresh a dashboard.
What is a dashboard
A dashboard displays log query and analysis results as column charts, line charts, pie charts, and other formats. Each dashboard contains multiple charts, and each chart runs one or more query and analysis statements. Charts execute automatically when you open or refresh the dashboard.
Use dashboards to monitor metrics in real time, identify anomalies, and locate root causes. Share dashboards through passwordless sharing to improve team collaboration.
Scenarios
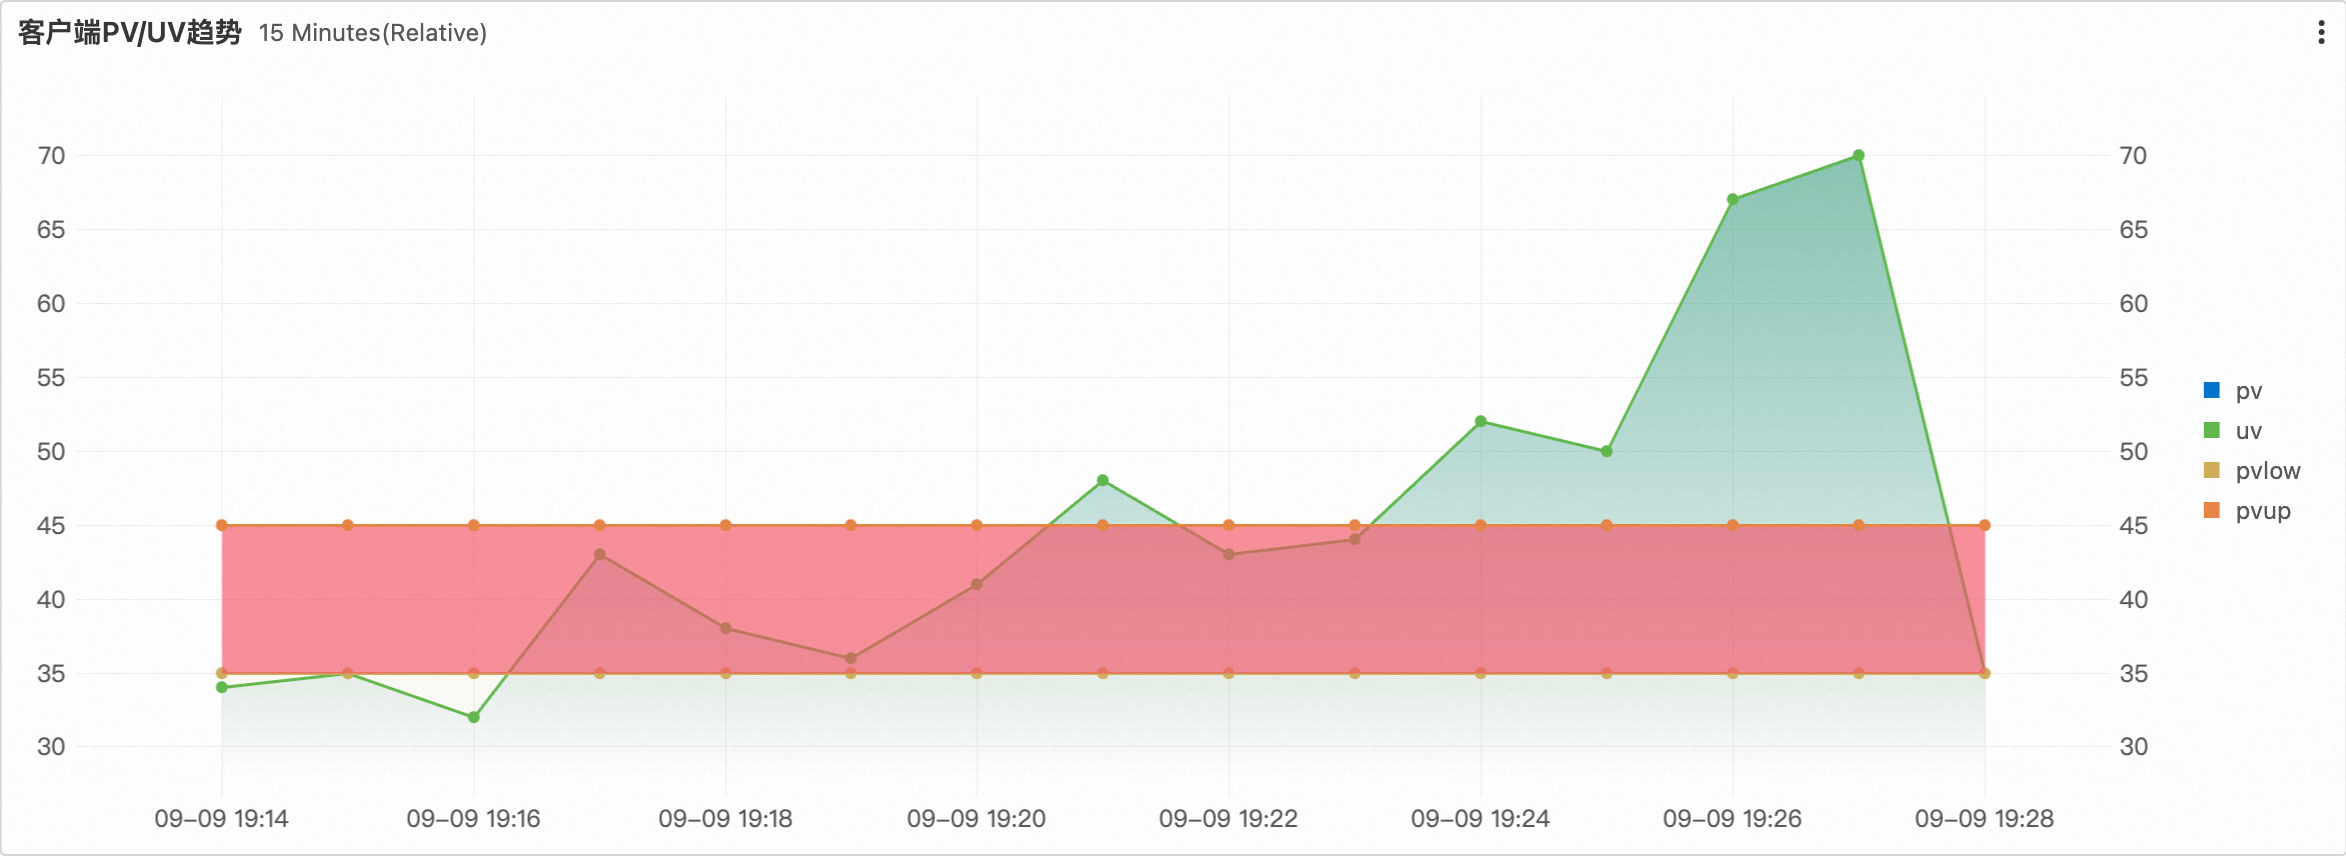
Anomaly detection
Set thresholds and alerts to detect anomalies in key metrics, such as success rate drops or resource shortages. Use historical comparisons and multi-dimensional analysis to quickly identify issues and improve the stability and response speed of your systems and business.
|
|


Root cause analysis
Use interaction events to associate charts with logs, metrics, and traces in SLS. This helps you drill down into anomalies and identify root causes.