The Container Asset Overview page gives you a unified visual view of your container environment's security state — including clusters, containers, images, and applications. The embedded network topology map shows how your containers communicate, highlights exposed Internet ports, and surfaces risks in real time.
With this page, you can:
Monitor the security score and risk counts across all clusters at a glance.
Switch between Internet Perspective and Cluster Perspective to identify which ports are exposed to the Internet.
Drill into a cluster to review security alerts, baseline risks, image vulnerabilities, and protection policies.
Enable per-cluster network topology to trace communication paths between containerized applications.
Export the full overview as a PNG for reporting or compliance evidence.
Security Center refreshes the Container Asset Overview — including network topology and security risk information — every minute.
Scenarios
Compliance with classified protection requirements: The network topology of your cloud assets helps you meet the standards of classified protection.
Visualization: This feature offers visualization of exposed ports on the Internet and enables you to perform security operations on your assets, such as clusters, containers, images, and applications.
Prerequisites
Before you begin, ensure that you have:
The Ultimate edition bound to the servers where the target clusters are deployed.
Subscription: When you purchase a subscription instance or upgrade the edition, select Ultimate for Edition.
Pay-as-you-go: When enabling pay-as-you-go, select Yes for Host and Container Security, then bind the Ultimate edition to the servers where the target cluster is located.
Container Image Scan enabled and images scanned. Image vulnerability data in the Container Asset Overview comes from this feature. Without it, you can still see server vulnerabilities and the current cluster's network topology, but container vulnerabilities will not appear. For instructions, see Enable container image scan and Scan images.
View container assets
Log on to the Security Center console. In the upper-left corner, select the region where your assets are located: China or Outside China.Log on to the Security Center console.
In the left-side navigation pane, choose Assets > Overview.
Click the Container Asset Overview tab.
Review the dashboard sections described below.
Dashboard sections
| Section | What it shows | What to do with it |
|---|---|---|
| ① Security score | The overall security score calculated by Security Center. A higher score means fewer risks. | Click Fix Now to open the Security Risk panel and handle outstanding risks. |
| ② Cluster and risk counts | The total number of clusters (black) and the number of assets with risks (red). | Click the Cluster area to go to Assets > Container > Cluster and view cluster details. |
| ③ Perspective toggle | Switches the topology display between Internet Perspective and Cluster Perspective. | Use Internet Perspective to identify which container ports are exposed to the Internet. |
| ④ Cluster details panel | Opens when you click a cluster in the topology. Shows four tabs: Cluster Information, Cluster Risk, Image Information, and Protection Policy. | See Cluster details below. |
| ⑤ Time range | The topology defaults to the past seven days. | Filter to a shorter time window within those seven days as needed. |
| ⑥ Container Network Topology toggle | Enables or disables the network topology display for a cluster. Disabled for all clusters by default. | See Enable Container Network Topology below. |
| ⑦ Export | Downloads the Container Asset Overview as a PNG file. | Click the download |
Cluster details
Click a cluster in the topology to open a side panel with four tabs.
Cluster Information
Displays the cluster Name and Cluster Type, plus counts of Namespace, Pod, Work(s), Application, and Image resources inside the cluster.
Cluster Risk
Displays Security Alerts, Baseline Risks, and Application Vul(s) for the cluster. Click Details next to Security Alerts to go to the cluster details page or the image security vulnerability list, where you can view and handle alerts, fix vulnerabilities, and handle image risks.
Image Information
Lists the images in the cluster. For any image repository not yet added to Security Center, click Add Now to go to the Container Image Scan page and add the repository.
Protection Policy
Shows Defense Details for the cluster, including Alerts in Previous 7 Days, Rules, and Defense Status. Click Create Rule to add protection policies.
Enable Container Network Topology
When enabled, Container Network Topology displays communication links between all containers, with applications shown as nodes. This lets you trace exactly how containerized workloads communicate and identify unexpected connections or Internet-exposed paths.
Container Network Topology is disabled for all clusters by default. Before enabling it, consider the following:
| Factor | Detail |
|---|---|
| CPU impact | Enabling uses a small amount of CPU resources and requires real-time traffic data collection. |
| Log volume | Enabling increases log volume. Even with Global Log Filtering enabled, traffic deduplication filtering does not apply to container visualization — additional log storage space is required. |
| Recommended scope | Enable only for clusters whose risk status you need to actively monitor. |
To enable or disable Container Network Topology:
All clusters: Click the
 or
or  toggle on the right side of Cluster Overview.
Single cluster: Click the target cluster icon in the topology. In the Cluster Information tab, click the
or toggle next to Container Network Topology.
View the container network topology
After enabling Container Network Topology for a cluster, follow these steps to explore its topology and the risk status of each node.
Click the
 icon below the target cluster's icon. Alternatively, click the cluster icon, then select View next to Container Network Topology in the Cluster Information tab.
For very large clusters, the topology is collapsed by default.
Use the controls on the left to adjust the topology display:
Toggle Show only connected applications to filter out unconnected nodes.
Toggle Display port information to show or hide port labels on connections.
Toggle Hide lines to show or hide connection lines.
On the left, all namespaces in the cluster are listed. Click the
 or
or  icon next to a namespace to hide or show it. Click the
  or
or  icon to expand or collapse the applications within a namespace.
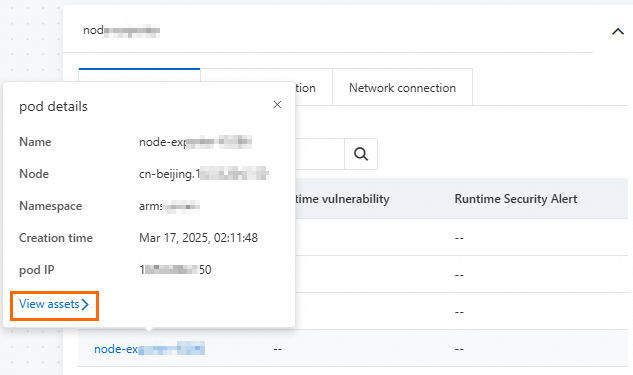
Click an application icon to view its Pod Information, Image Information, and Network Connection tabs. In the Pod Information tab, hover over a Pod name to open the Pod details dialog. Click View assets to go to Assets > Container and review that Pod's vulnerability risks and alerts.