Agentic SOC includes predefined detection rules to analyze ingested alerts and logs, reconstruct threat attack chains and timelines, and generate aggregated alerts and detailed security events. You can also create custom detection rules to build a threat detection system that is tailored to your business needs.
Overview
The rule management feature of Agentic SOC analyzes standardized logs and uses built-in playbooks to generate aggregation and analysis alerts and custom analysis alerts. It creates security events using methods such as graph computing, alert pass-through, and same-type aggregation to help you handle threat events. Rule management supports the following rule formats to generate alerts and events:
SQL syntax: Performs alert detection and event generation by filtering logs, matching features, performing window statistics, and running other association analysis on logs within the specified scope.
Playbook: Performs alert detection and event generation by calling Alibaba Cloud service APIs and making decisions based on the playbook flow. This is typically used for business status alerts.
Rule types
Rule type | Description |
Predefined | Predefined rules provide out-of-the-box threat detection by analyzing logs that are within their effective scope and have been ingested into Agentic SOC. Security alerts generated from rule hits are displayed on the Aggregate and Analyze Alerts tab of the page. These rules use graph association technology to aggregate alerts that share the same Asset or IOC into events, and associate and aggregate all alerts except for custom analysis alerts. |
Custom | Custom rules provide flexible rule extension capabilities and rule templates for complex threat detection scenarios. This helps you quickly customize threat detection rules based on templates. You can implement threat detection for custom rules based on SQL syntax or playbooks. Security alerts generated by custom rules are displayed on the Custom Alert Analysis tab of the page. Custom rules generate security incidents through alert pass-through or same type aggregation. |
Event generation methods
Graph computing: Uses graph association technology to associate and aggregate alerts that have the same assets or Indicators of Compromise (IOCs) into events. All alerts are associated and aggregated except for custom analysis alerts.
Alert pass-through: Generates one security event for each alert that is generated based on an analysis rule.
Same-type aggregation: Aggregates all alerts that are generated based on the same analysis rule into a single security event.
Scope
When you activate the Agentic SOC service, the billing model and billing items that you select determine the scope of available rule management features. For more information, see Purchase and activate Agentic SOC.
Subscription:
Purchase only Log Ingestion Traffic: Predefined rules, Custom rules (supports only logs where the normalization method is "Scan Query").
NoteIf you also purchase the pay-as-you-go feature for Log Management, you can use all custom rules.
Purchase Log Ingestion Traffic and Log Storage Capacity : Predefined rules and Custom rules.
Standalone purchase of Log Storage Capacity: Not supported.
Pay-as-you-go: Predefined rules, Custom rules (supports only logs that use the Scan Query standardization method).
NoteIf you also purchase the pay-as-you-go Log Management feature, you can use all custom rules.
Workflow

Enable or disable predefined rules
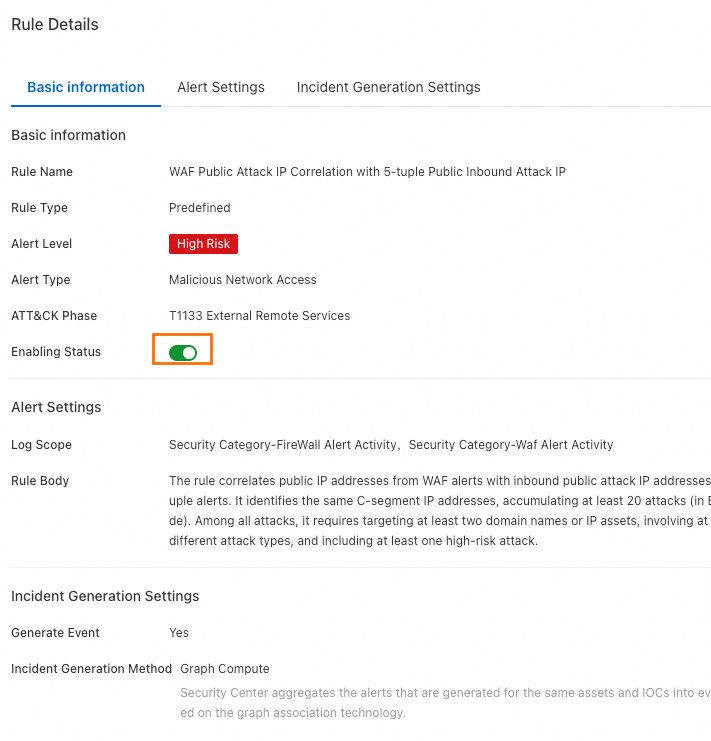
Predefined analysis rules are enabled by default. You can view the details of predefined rules and enable or disable the rules. You cannot edit or delete predefined rules.
Go to the Agentic SOC > Rule Management page in the Security Center console. In the upper-left corner, select the region where your assets are located: Chinese Mainland or Outside Chinese Mainland.
On the Predefined tab, you can view the list of predefined rules. In the Actions column of a specific rule, you can click Details to view its basic information, alert generation settings, and incident generation settings.
Click the Rule Status: switch to enable or disable the target predefined rule.
NoteAlternatively, in the list of predefined rules, click Enable or Disabled in the Enabling Status column for the target rule.
You can aggregate and analyze alerts that are generated when predefined rules are hit on the Aggregate and Analyze Alerts tab of the page.
Create and enable custom rules
Go to the Agentic SOC > Rule Management page in the Security Center console. In the upper-left corner, select the region where the assets that you want to protect are located: Chinese Mainland or Outside Chinese Mainland.
On the Rule Template tab, click Create Rule in the Actions column for the target template. Alternatively, click Create Custom Rule on the Custom tab.
ImportantWe recommend that you create rules from rule templates for simpler and more efficient configuration.
In the Create Custom Rule panel, on the Basic Information tab, enter the rule name and description, and click Next.
On the Alert Settings tab, configure the alert generation rule.
You can view generated alert information on the Custom Alert Analysis tab of the page. The available configuration items and their values vary depending on the configured rules. The following describes the configuration items and their values:
SQL syntax
This method uses SQL to perform alert detection and event generation by filtering logs, matching features, performing window statistics, and running other association analysis on logs within the specified scope.
Rule body
Configuration item
Description
Rule Body
The default is SQL.
Log Scope
Select the log scope for the rule to detect. You must select the standardized category and standardized structure of logs. You can select multiple standardized log structures.
Click the Standard Fields link to view the description of the log fields for the current log structure.
SQL Statement
Use an SQL statement to query the records of a specified event to identify potential malicious behavior. For more information about how to configure an SQL query statement, see the following topics:
For more information about SQL syntax, see SQL analysis syntax and features.
Scheduling settings
When a custom rule with a SQL body is enabled, Agentic SOC creates a corresponding scheduled SQL job in Simple Log Service (SLS) based on the Scheduling Settings. SLS then generates multiple execution instances based on the scheduling interval. For more information, see Manage a scheduled SQL job and Query the result data of a Scheduled SQL job.
Scheduling parameter description
Configuration item
Description
Scheduling Interval
Set the frequency at which SQL queries are run. You can use one of the following methods:
Fixed Interval: The allowed range is 5 minutes to 24 hours.
Cron: Minimum precision is minutes, format is 24-hour. Configuration examples:
0/5 * * * *: Execute every 5 minutes, starting from minute 0.0 0/1 * * *: Execute every 1 hour starting from 0:00.0 18 * * *: Execute once daily at 18:00.0 0 1 * *: Executes at 00:00 on the first day of every month.
SQL Time Window
Specify the time range of logs to query for a scheduled SQL instance. The value must be in the range of 5 minutes to 24 hours.
ImportantThe time window must be greater than or equal to the scheduling interval.
Start Time
The time when scheduled SQL instances start to run after the rule is enabled. You can use one of the following methods:
Rule Enabled At: The moment when the rule is enabled.
Specified Time: A specific time that you set, accurate to the minute.
Scheduled SQL task execution parameters
Task scheduling time: Determined by the Start Time and Scheduling Interval in the scheduling settings. The scheduled time is not affected by the execution timeout, delay, or supplementary runs of the previous instance.
For example, if the start time of the rule is 10:58:45 on May 16, 2025 and the scheduling interval is 5 minutes, the scheduled times are 10:58:45 on May 16, 2025, 11:03:45 on May 16, 2025, 11:08:45 on May 16, 2025, and so on.
Running time: The time when the scheduled SQL task is actually run. If a task is retried, this is the time when the last retry started.
NoteA scheduled SQL task may time out, be delayed, or be backfilled. As a result, the running time can be different from the scheduled time.
SQL query range: The time range for SQL analysis. This range is determined by the Task scheduling time and SQL Time Window, and is not related to the actual task running time. Calculation formula: [Scheduled time rounded to the minute - SQL Time Window, Scheduled time rounded to the minute).
For example, if the start time of the rule is 10:58:45 on May 16, 2025, the scheduling interval is 5 minutes, and the SQL time window is 5 minutes.
The SQL query range for the first scheduled task is as follows:
Scheduled time: 10:58:45 on May 16, 2025
Data timestamp: [10:53:00 on May 16, 2025, 10:58:00 on May 16, 2025)
The SQL query range for the second scheduled task is as follows:
Scheduled time: 11:03:45 on May 16, 2025
Data timestamp: [10:58:00 on May 16, 2025, 11:03:00 on May 16, 2025)
Alert log generation
Agentic SOC generates different alert logs based on the Alert Log Generation configuration item. You can view these logs in .
Alert attribute definition
Generation Structure: Select the log category for the alert, such as Endpoint Detection & Response and Firewall.
NoteClick View Standard Fields from the drop-down list to view the field details for the log type.
Alert Type: Specifies the type of alert that is detected by the current rule.
Alert Level:
Function: Defines the risk level of the alert.
Valid values: Information, Low, Medium, High, and Critical.
ATT&CK Phase
Function: Associates the attack behavior detected by the rule with the corresponding attack stages and techniques.
Configuration:
You can click
+ Add Attack Stageto map multiple attack stages.You can select multiple attack techniques within each attack stage.
Limit: The total number of attack techniques must not exceed 5 across all stages.
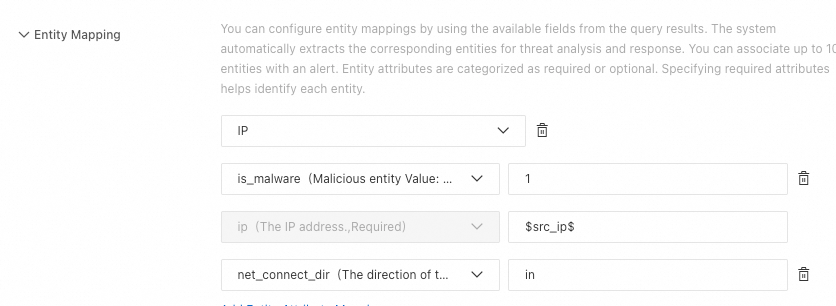
Entity Mapping
Maps unstructured fields from query results, such as IP addresses or filenames, to structured entity objects. This allows the system to aggregate all related activities for an entity, build a threat profile, and improve analysis efficiency.
Procedure
Select an entity type
From the drop-down list, select the type of entity to map, such as host, file, IP address, or process.
You can click Add Entity Mapping to configure different types of entities.
Map entity properties
Configure the properties for each entity. Properties are divided into two categories:
Required properties: The unique identifier of the entity. For example, the required property for an "IP address" entity is the address itself.
Optional properties: Provide supplementary information for the entity. For example, you can associate a "hostname" with an "IP address" entity as an optional property.
You can click Add Entity Attribute Mapping to configure multiple properties for an entity.
Set property values
Assign a value to each selected property.
Format: Two formats are supported:
Variable reference:
$field_name$(References a field from the query results).Constant: A fixed string value.
Example:
Alert Enrichment
You can dynamically generate alert names and descriptions by referencing query fields as variables.
Alert Name:
Length and format: The maximum length is 50 characters.
Reference format:
$SQL query returned field$.Default (if left blank): The Rule Name is used.
Example: High-frequency multi-type network attack from $src_ip$ detected.
Alert Description:
Length: The maximum length is 1,000 characters.
Variable reference format:
$sql_query_return_field$.Default (leave empty): The default value is the Rule Description.
Example: Alert from: $product_code$. Network attack from $src_ips$ detected. Affected assets include the following: $dst_ips$.
ImportantIf the final content generated after referencing variables exceeds the length limit, the excess part is automatically truncated.
Alert suppression
You can configure rules in Alert Suppression to control the number of generated security alerts, but the generation and delivery of alert logs are not affected.
Agentic SOC groups alerts based on the Cartesian product of the values of the fields specified in the suppression conditions. A maximum of 100 security alerts can be generated for each group within a suppression window. When the number of alert records exceeds this limit, subsequent records that meet the same conditions do not generate security alerts.
Configuration item
Description
Suppression Window
The Suppression Window determines the statistical period for alert records.
The suppression window starts at the time when the rule generates the first alert log.
The value must be in the range of 5 minutes to 24 hours.
NoteAssume that the rule generates the first alert log at 10:58:45 on May 16, 2025 and the suppression window is set to 10 minutes. The first suppression window is from 10:58:45 to 11:08:45. The second suppression window is from 11:08:45 to 11:18:45, and so on.
Suppression Condition
Enter the column name, field name, or alias defined after the `select` keyword in the SQL statement. If you do not configure this parameter, the system uses the `rule_id` field of the custom analysis rule as the suppression condition by default.
Agentic SOC groups alerts based on the Cartesian product of the values of the fields specified in the suppression conditions.
For example, if you specify two fields a and b as suppression conditions, where the value set of a is {1,2} and the value set of b is {3,4}, a total of four combinations are generated: {1,3}, {1,4}, {2,3}, and {2,4}. Each combination is a group.
A maximum of 100 security alerts can be generated for each group within the window.
ImportantThe suppression condition is optional. If you do not specify a suppression condition, a maximum of 100 security alerts can be generated based on the rule within the entire window.
Playbook
Performs alert detection and event generation by calling Alibaba Cloud service APIs and making decisions based on the playbook flow. This is typically used for business status alerts.
NoteIf a rule is created from a Rule template (playbook), a corresponding custom playbook is automatically created. You can view it on the Custom Playbook tab in .
Rule body
Configuration item
Description
Rule Body
Select Script.
Playbook Name
If you create a rule from a rule template (playbook), you can change the playbook name. The playbook name must be unique.
If you create a rule by clicking Create Custom Rule on the Custom tab, you can select an appropriate playbook from the drop-down list.
ImportantOnly the playbooks that meet the following conditions appear in this dropdown list:
The playbook is a custom playbook.
The playbook is published.
The input parameter type of the start node of the playbook must be Custom.
The playbook is not associated with other analysis and detection rules.
Playbook Description
A rule created from a rule template (playbook class) can be modified.
If you create a rule by clicking Create Custom Rule on the Custom tab, the description of the target playbook in response orchestration is automatically pulled and cannot be modified.
Parameter settings
You need to set parameters only when you create a rule from a rule template (playbook). Different playbooks require different parameters. You can click the
 icon next to a parameter to view its description and configuration instructions.
Authorization configuration
You need to configure authorization only when you create a rule from a rule template (playbook).
Execution Role: If you have not created a role, click Go to RAM Console to Create Role. On the RAM quick authorization page, click Confirm Authorization. A role named AliyunSiemSoarExecutionDefaultRole is then automatically created.
NoteIf you do not have the permissions to create a role, you can contact the RAM administrator (a RAM user with Resource Management permissions or an Alibaba Cloud account) to create a role and attach a trust policy in the RAM console. For more information, see Create a RAM role for a trusted Alibaba Cloud service. The configuration is described as follows:
Trusted Entity: Alibaba Cloud Service.
Trusted entity name: cloudsiem.sas.aliyuncs.com.
Role name: AliyunSiemSoarExecutionDefaultRole
Access Policy: This section lists the permission policies required to execute the selected playbook template. If the required policies are not attached, click Modify Policy, select the policies that require authorization, and then click Authorize in RAM Console. You will be redirected to the RAM quick authorization page to complete the authorization.
ImportantIf you do not have authorization permissions, you can contact a RAM administrator (a RAM user who has Resource Management permissions or an Alibaba Cloud account) to attach the access policies that are required to execute playbooks to the AliyunSiemSoarExecutionDefaultRole role. For more information, see Manage permissions for a RAM role.
Scheduling settings
For custom rules that use a playbook, after the rule is enabled, Agentic SOC uses the Scheduling Settings to create a scheduled task to call the playbook.
NoteIf a scheduled task fails to run the playbook within a single cycle, the system automatically retries the task after 30 seconds. If the task still fails after the retry, the current task flow is stopped and enters the waiting state. The task is restarted in the next scheduled cycle.
You can view the playbook execution records on the details page of the custom playbook in the SOAR module.
Configuration item
Description
Scheduling Interval
Set the time interval at which the playbook is run. You can use one of the following methods:
Fixed Interval: The allowed range is 5 minutes to 24 hours.
Cron: Minimum precision is minutes, format is 24-hour. Configuration examples:
0/5 * * * *: Execute every 5 minutes, starting from minute 0.0 0/1 * * *: Execute every 1 hour starting from 0:00.0 18 * * *: Execute once daily at 18:00.0 0 1 * *: Executes at 00:00 on the first day of every month.
Start Time
The time when the playbook starts to run after the rule is enabled. You can use one of the following methods:
Rule Enabled At: The moment when the rule is enabled.
Specified Time: A specific time that you set, accurate to the minute.
Alert log generation
Agentic SOC generates alert logs based on the Alert Log Generation configuration item. You can view the generated alert logs under .
For Generation Structure, you can only select Other Alert Logs.
NoteYou can click View Standard Fields in the drop-down list to view the field details for this log type.
Alert Type: Specifies the type of alert that is detected by the current rule.
Alert Level:
Function: Defines the risk level of the alert.
Valid values: Information, Low, Medium, High, and Critical.
ATT&CK Phase
Function: Associates the attack behavior detected by the rule with the corresponding attack stages and techniques.
Configuration:
You can click
+ Add Attack Stageto map multiple attack stages.You can select multiple attack techniques within each attack stage.
Limit: The total number of attack techniques must not exceed 5 across all stages.
Alert suppression
Using the rules that you configure for Alert Suppression, you can control the number of security alerts that are generated, but this does not affect the generation and delivery of alert logs.
Agentic SOC groups alerts based on the Cartesian product of the values of the fields specified in the suppression conditions. A maximum of 100 security alerts can be generated for each group within a suppression window. When the number of alert records exceeds this limit, subsequent records that meet the same conditions do not generate security alerts.
Configuration item
Description
Suppression Window
The Suppression Window determines the statistical period for counting alert records.
The suppression window starts at the time when the rule generates the first alert log.
The value must be in the range of 5 minutes to 24 hours.
NoteAssume that the rule generates the first alert log at 10:58:45 on May 16, 2025 and the suppression window is set to 10 minutes. The first suppression window is from 10:58:45 to 11:08:45. The second suppression window is from 11:08:45 to 11:18:45, and so on.
Suppression Condition
The data in the drop-down list is sourced from the standardized log fields that correspond to the alert log selected from the Alert Log Generation settings in the Generation Structure section.
NoteOn the page, on the Standardized Rule tab, click View Standard Fields to view the basic information and field details of the target log.
Agentic SOC groups alerts based on the Cartesian product of the values of the fields specified in the suppression conditions.
For example, if you specify two fields a and b as suppression conditions, where the value set of a is {1,2} and the value set of b is {3,4}, a total of four combinations are generated: {1,3}, {1,4}, {2,3}, and {2,4}. Each combination is a group.
A maximum of 100 security alerts can be generated for each group within the window.
ImportantThe suppression condition is optional. If you do not specify a suppression condition, a maximum of 100 security alerts can be generated based on the rule within the entire window.
On the Incident Generation Settings tab, you can configure the security event generation rules.
You can view and handle the generated incidents on the page.
Configuration item
Description
Generate Event
Select whether to generate an event when an alert hits the rule.
Incident Generation Method
Alert pass-through: Generates one security event for each alert that is generated based on the current rule.
Same-type aggregation: Aggregates all alerts that are generated based on the current rule into a single security event.
Aggregation Window
You need to configure the window size only for the Incident Aggregation by Type scenario. The valid range is 5 minutes to 24 hours.
For example, if you set the aggregation window to 5 minutes, all security alerts that are generated within this 5-minute period are aggregated into a single security event.
Enable custom rules: Newly created rules have a status of Disabled by default. You can change the status of a rule in the Enabled Status column or the Actions column.
NoteWe recommend that you test the custom rule before you enable it.
Test custom rules (optional)
Before you enable a custom rule, you can change the Enabling Status of the rule to Testing and view the test alerts to confirm that the output meets your expectations. The system calibrates alert fields, alert field values, and standardized fields based on built-in calibration logic. You can review the calibration results in the console and adjust the SQL syntax of the rule or the playbook as needed to ensure that the generated alert logs meet the calibration requirements.
The testing phase is optional. The calibration results do not affect the enabling of the rule.
The alerts that are generated during testing are not displayed on the Security Alerts page.
Procedure:
On the Custom tab, you can set the Enabling Status of the target rule to Testing.
In the Actions column for the target rule, click View Alert Test Result.
On the test results details page, you can view the alert trend graph and the alert list, or click Details in the Actions column for an alert to view its calibration results.
View and handle security alerts and events
After a threat detection rule is enabled, security alerts and events are generated if ingested logs trigger the rule. You can handle the alerts and events as described in the following topics:
On the page, you can view the generated alert information on the Custom Alert Analysis and Aggregate and Analyze Alerts tabs. For more information, see Security alerts.
View and handle the generated incidents on the page. For more information, see Security Incident Response.