Query the results of a Scheduled SQL job in a destination Logstore or Metricstore.
Prerequisites
You have created a Scheduled SQL job.
-
If you use Scheduled SQL to process data in a source Logstore and store the results in a destination Logstore, see Create a Scheduled SQL job to import data from a Logstore to another Logstore.
-
If you use Scheduled SQL to process data in a source Logstore and store the results in a destination Metricstore, see Create a Scheduled SQL job to import data from a Logstore to a Metricstore.
-
If you use Scheduled SQL to process data in a source Metricstore and store the results in a destination Metricstore, see Create a Scheduled SQL job to import data from a Metricstore to another Metricstore.
Query results in a destination Logstore
After a Scheduled SQL job saves its results to a Logstore, you can query them by using the job name.
Log on to the Simple Log Service console.
-
Obtain the Scheduled SQL job name.
In the Projects section, click the project you want.
-
In the left-side navigation pane, choose . On the Scheduled SQL page, click the target job.
-
In the Basic Information section, obtain the Scheduled SQL job name.
-
Query the results of the Scheduled SQL job.
-
Navigate to the destination Logstore. For more information, see Quick start for search and analysis.
-
In the search box, enter
__tag__:__job__: job-name.Replace job-name with the Scheduled SQL job name obtained in Step 2.
-
Click 15 Minutes (Relative) to set a time range.
NoteIf no data is returned, you can expand the time range.
-
Click Search & Analyze.
For example, the query
__tag__:__job__: sql-1679626854-438974returns six log entries. Each log entry includes tags such as__tag__:__job__,__tag__:__schedule_time__, and__tag__:__trigger_time__, along with the execution result, such as_col0:41.
-
Query results in a destination Metricstore
After a Scheduled SQL job saves its results to a Metricstore, you can query them by using the specified metrics.
Log on to the Simple Log Service console.
In the Projects section, click the one you want.

On the tab, click the metricstore you want.
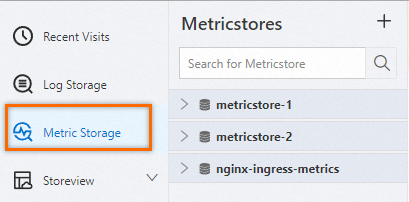
-
Click 15 Minutes (Relative) to set a time range.
NoteIf no data is returned, you can expand the time range.
-
Enter a query statement for the target metrics, and then click Execute Now.
Use the metric you specified in the Scheduled SQL job.
On the Metrics Exploration page, select Metricstore (PromQL) as the data source, enter the query statement
* | select promql_query_range('cpu_count{}') from metrics limit 1000, and then click Execute Now to view the query results for the metric.