The Application Analysis tab gives you a unified view of your application security posture: how many processes are protected, how many attacks were caught, which servers are most targeted, where attacks originate, and how well vulnerabilities are blocked. Use this data to identify coverage gaps and prioritize security hardening actions.
Prerequisites
Before you begin, ensure that you have:
Purchased an application protection quota in Security Center
Added at least one Java or PHP application process to application protection
View protected application processes
Because application processes start and stop dynamically, run an on-demand scan to get an accurate count before reviewing statistics.
Log on to the Security Center console. In the upper-left corner, select the region of your assets: China or Outside China.
In the left-side navigation pane, choose Protection Configuration > Application Protection.
On the Application Analysis tab, in the Application Access Statistics section, click Resource Statistics to the right of Remaining Quota.
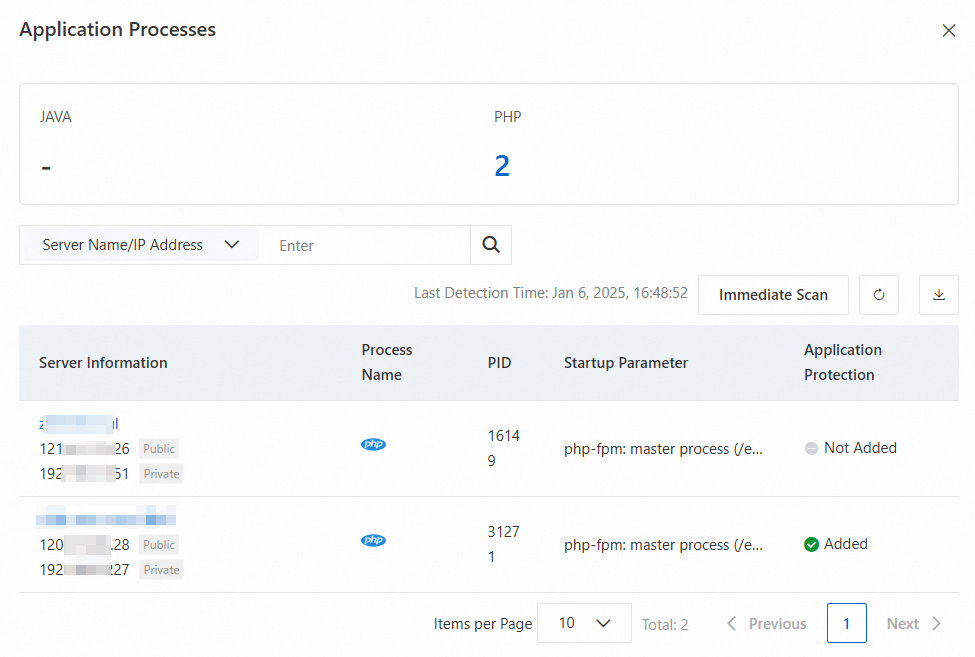
In the Application Processes panel, click Immediate Scan. Wait until the last detection time updates.
Click the number under Java or PHP to see the processes available for protection. In the Application Protection column, each process shows one of the following statuses: To export the process list, click
 .
.Status Description Added The process is protected and quota has been deducted Not Added The process is running but not yet protected Failed Protection could not be applied to this process
Only processes running at scan time are counted. The number of processes changes dynamically, so use the scan result to estimate the quota you need. Scan data is retained for 7 days; new scans overwrite existing data.
In the Basic, Value-added Plan, Anti-virus, or Advanced edition of Security Center, the agent collects process data only once per day. Each process added to application protection consumes one quota unit.
View attack protection effects
The Application Analysis tab shows attack data for the previous 30 days across three sections: Application Behavior Analysis, Distribution by Attack Type, and Attack Prevention Trend.
Log on to the Security Center console. In the top navigation bar, select the region of the asset you want to manage: China or Outside China.
In the left-side navigation pane, choose Protection Configuration > Application Protection.
On the Application Analysis tab, review the following metrics:
Total Checked: the total number of security checks run on protected applications. If this number is recorded, application protection is working correctly — even if no alerts appear on the Attack Alerts page.
Successful Attack Captures = Blocked + Monitored
No attack data means your applications are running as expected. Application protection captures only actual attacks.
What to do with the data:
To investigate attacks outside the 30-day window or filter by a specific time range, go to the Attack Alerts tab.
View most attacked servers
Log on to the Security Center console. In the top navigation bar, select the region of the asset you want to manage: China or Outside China.
In the left-side navigation pane, choose Protection Configuration > Application Protection.
On the Application Analysis tab, scroll to the Attacked Server IP Address section to see which servers receive the most attacks.
Harden targeted servers:
Fix known vulnerabilities to reduce the attack surface. See View and handle vulnerabilities.
Enable Malicious Host Behavior Prevention, Webshell Prevention, Malicious Network Behavior Prevention, and Webshell Detection and Removal on targeted servers. See Enable features on the Host Protection Settings tab.
To see which IP addresses are attacking a targeted server, refer to the Attacker IP Address section.
View major attack sources
Log on to the Security Center console. In the top navigation bar, select the region of the asset you want to manage: China or Outside China.
In the left-side navigation pane, choose Protection Configuration > Application Protection.
On the Application Analysis tab, scroll to the Attacker IP Address section to see the IP addresses that initiate the most attacks.
Block identified attack sources:
Add security group rules to deny access from known attack source IPs on your Elastic Compute Service (ECS) instances. See Add a security group rule.
If you use Web Application Firewall (WAF), add the attack source IPs to the IP blacklist. See Configure IP address blacklist rules to block specific requests.
View vulnerability prevention effects
Log on to the Security Center console. In the upper-left corner, select the region of your assets: China or Outside China.
In the left-side navigation pane, choose Protection Configuration > Application Protection.
On the Application Analysis tab, scroll to the Vulnerability Prevention section.
The section displays the following metrics:
| Metric | Description |
|---|---|
| Protected applications | Number of application processes added to application protection for vulnerability prevention |
| Defended application vulnerabilities/Pending vulnerabilities | Number of vulnerabilities blocked by application protection. Each occurrence across different assets is counted separately. |
| All supported vulnerabilities | Click the number to view all vulnerabilities for which application protection is available. |
| Total times of successful defense against all vulnerabilities | Number of attacks through vulnerabilities that were monitored or intercepted |
| Top 5 vulnerabilities | The five vulnerabilities with the highest number of protection sessions, including both monitoring and interception |
| Vulnerability trend | Frequency of attacks through vulnerabilities monitored or intercepted over time. Only alerts that include a vulnerability name in their details are counted. |
What to do with the data:
If the Vulnerability trend shows a sustained increase, review the Top 5 vulnerabilities and prioritize patching those vulnerabilities in your application code.
Click the number next to All supported vulnerabilities to see the full list of vulnerabilities that application protection can shield — use this to identify gaps in your patch coverage.