TopN (quick filtering) filters database results by numerical value, letting you quickly identify the largest or smallest entries. You can apply TopN to dimensions or measures at different granularities to support data-driven decisions.
Prerequisites
-
You have created a dashboard. For more information, see Create a Dashboard.
-
A dataset is selected and chart fields are configured. For more information, see Configure Chart Fields.
Usage Notes
-
TopN calculates on the returned result set, which has a limit of 10,000 rows in the public cloud. If the returned data exceeds 10,000 rows, calculation results may be inaccurate.
-
The following table lists charts that support TopN.
TopN calculation method
Description
Supported chart types
Overall TopN
Performs TopN filtering on the overall data.
-
Line/Area charts: Line chart, Area chart, Stacked area chart, 100% stacked area chart, Combination chart.
-
Column/Bar charts: Column chart, Stacked column chart, 100% stacked column chart, Circular column chart, Ranking board, Bar chart, Stacked bar chart, 100% stacked bar chart, Waterfall chart, Bullet chart, Box plot, Histogram.
-
Bubble/Scatter charts: Bubble chart, Scatter chart, Facet scatter chart.
-
Table charts: Cross table, Heat map.
-
Pie/Ring charts: Pie chart, Rose chart, Radar chart, Treemap chart.
-
Geographic charts: Color map, Bubble map, Heat map, Flow map, Symbol map.
-
Metric charts: Metric card, Metric trend chart.
-
Funnel/Conversion charts: Funnel chart, Comparison funnel chart.
-
Other charts: Word cloud.
Group-based TopN
Groups data by a specific dimension and performs TopN filtering within each group.
-
Line/Area charts: Line chart, Area chart, Stacked area chart, 100% stacked area chart, Combination chart.
-
Column/Bar charts: Column chart, Stacked column chart, 100% stacked column chart, Bar chart, Stacked bar chart, 100% stacked bar chart, Bullet chart, Box plot, Histogram.
-
Bubble/Scatter charts (X-axis cannot be a measure): Bubble chart, Scatter chart, Facet scatter chart.
-
Table charts: Cross table, Heat map.
-
Configuration Entry
In the Fields panel of the chart, find the measure field that requires TopN calculation, click the  icon on its right, and select Advanced Calculation > TopN from the dropdown list. Then set the TopN calculation method according to your business scenario.
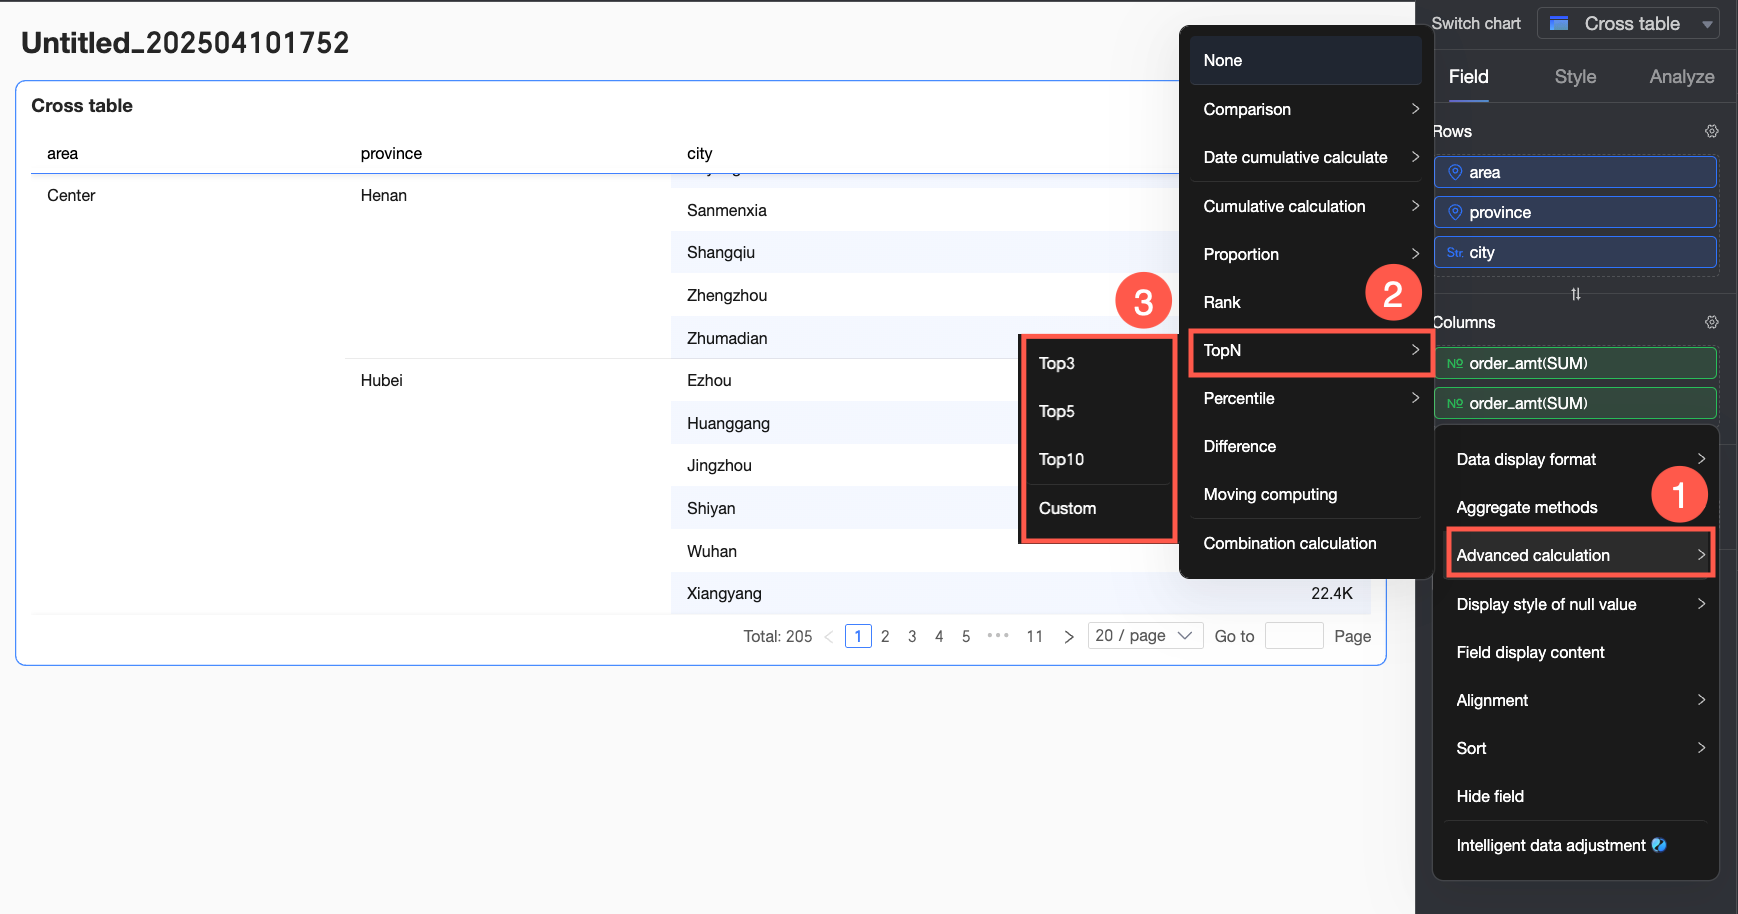
For cross tables with Custom calculation type, the available calculation types differ from other charts.
|
Chart type |
Calculation type |
Limitation |
Calculation logic |
|
Cross table |
Column TopN |
Dimension fields in the Row area |
Treats each column as an independent analysis unit and filters out TopN data in an entire column. |
|
Column group-based TopN |
Two or more dimension fields in the Row area |
Groups single column data according to the selected dimension and performs TopN filtering within the groups. The grouping logic is: starting from the first dimension in the Row area up to the selected grouping dimension, all dimensions in between are treated as a whole for grouping operations. For example, in the image below, the Region and Province fields will be used for grouping operations. |
|
|
Row TopN |
Dimension fields in the Column area |
Treats each row as an independent analysis unit and filters out TopN data in an entire row. |
|
|
Row group-based TopN |
Two or more dimension fields in the Column area |
Groups single row data according to the selected dimension and performs TopN filtering within the groups. The grouping logic is: starting from the first dimension in the Column area up to the selected grouping dimension, all dimensions in between are treated as a whole for grouping operations. For example, in the image below, the Region and Province fields will be used for grouping operations. |
|
|
Other charts |
Overall TopN |
/ |
Performs TopN filtering on the overall data. |
|
Group-based TopN |
|
Groups by dimension fields and performs TopN filtering within groups. The grouping logic is:
|

Examples
You can apply TopN to both measures and dimensions.
-
Setting TopN for measures
To view the top three entries by order amount, configure TopN on the measure (Order amount) as follows.
-
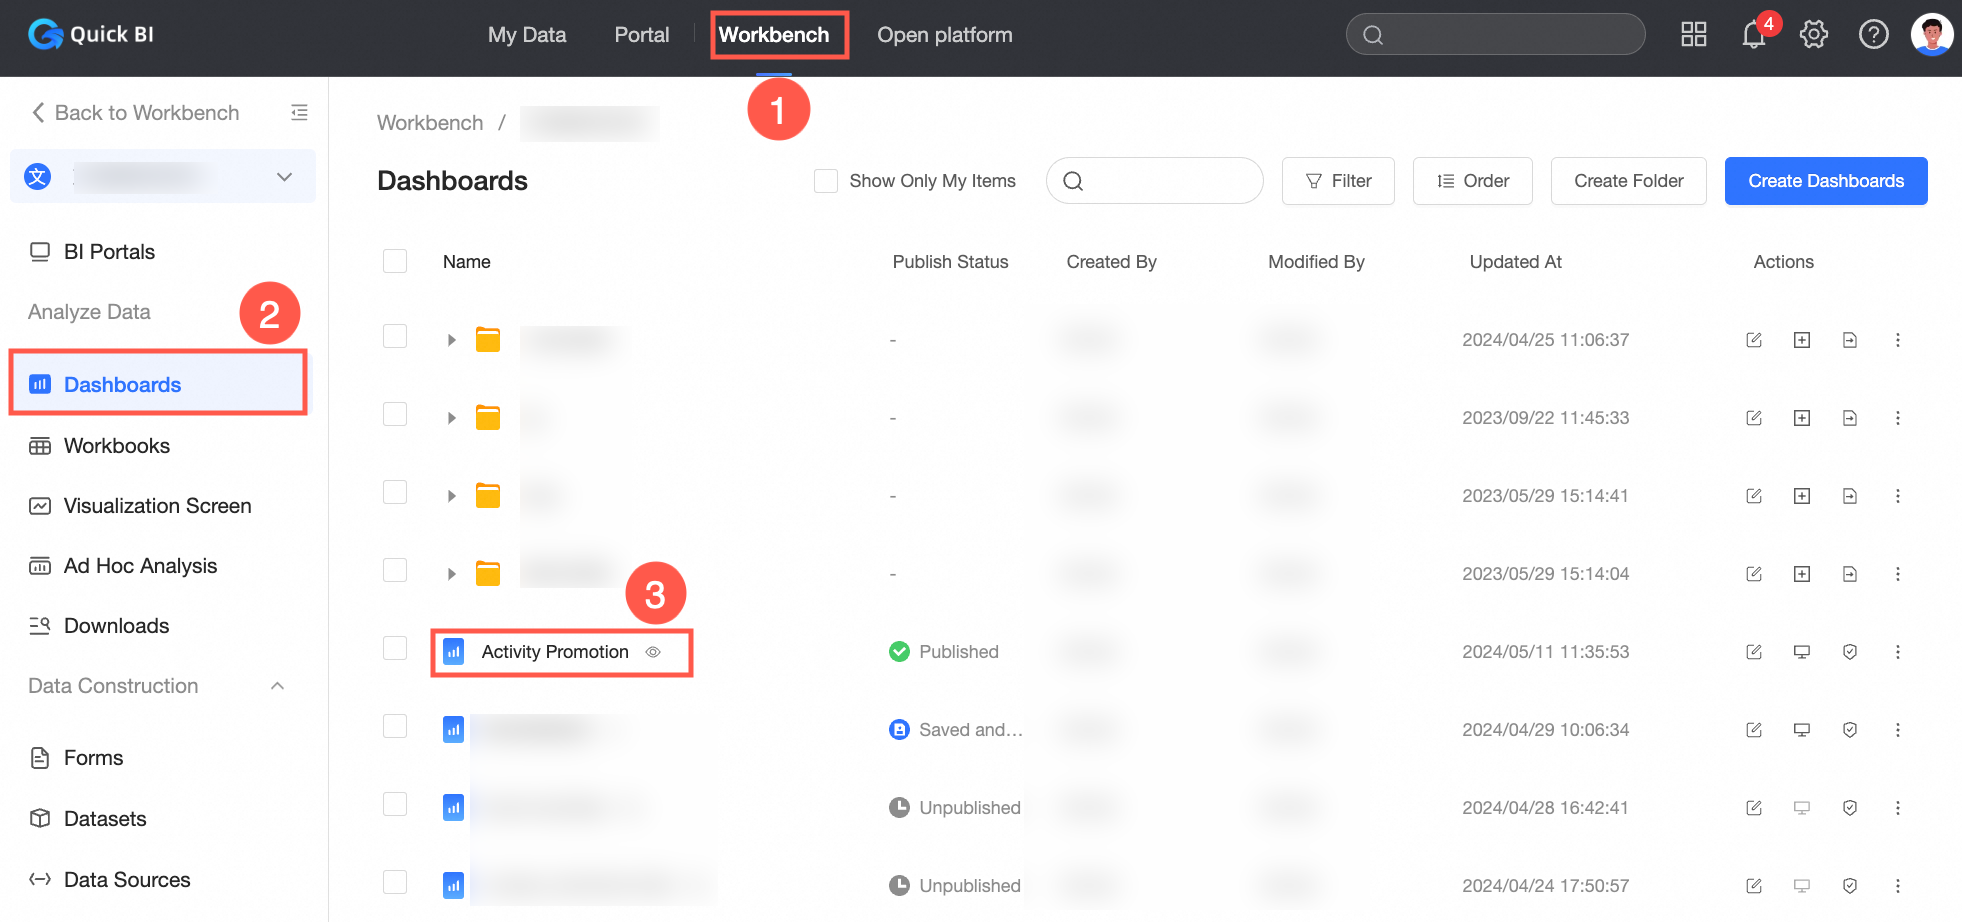
Log on to the Quick BI console.
-
Follow the steps shown in the image below to enter the dashboard editing page.
-
In the top menu bar, click Add Chart, find the
 icon, and create a Cross Table.
 -
In the Fields tab of the chart design, configure the cross table data.
-
Click the
 icon on the right and select Advanced Calculation > TopN > Top3.
-
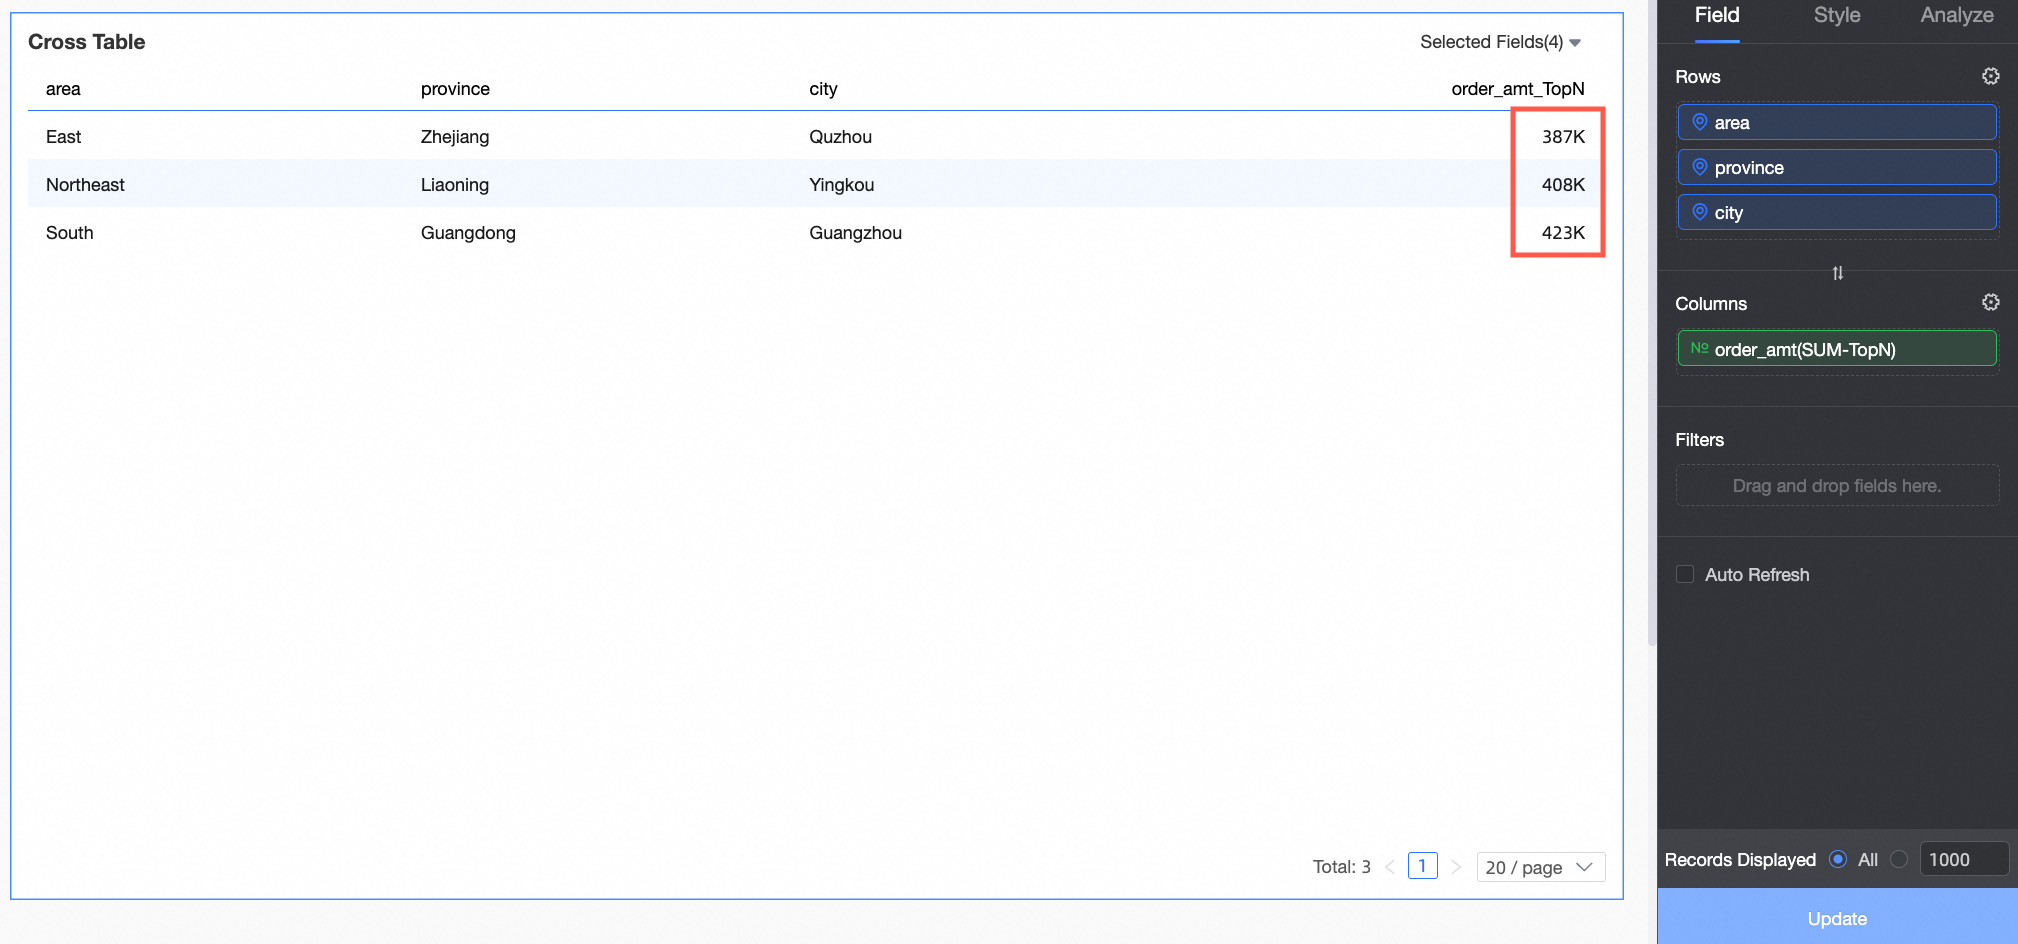
Click Update.
The cross table will now sort by order amount and display the top 3 data entries.
-
-
Setting TopN for dimensions
To view the top three entries by order amount for each region, set Advanced Calculation > Single Dimension TopN > Top3 on the dimension (Region). This filters out the top three entries for each region such as Northeast, North China, and South China.
-
Custom TopN
TopN retains the top N entries. For example, Top5 retains the top 5 entries. You can also customize the Calculation Type, Order, and N Value. The calculation types available for cross tables differ from other charts. For details, see the comparison table in Configuration Entry.
The following table shows examples of different calculation types in cross tables.
Calculation method
Configuration description
Example effect
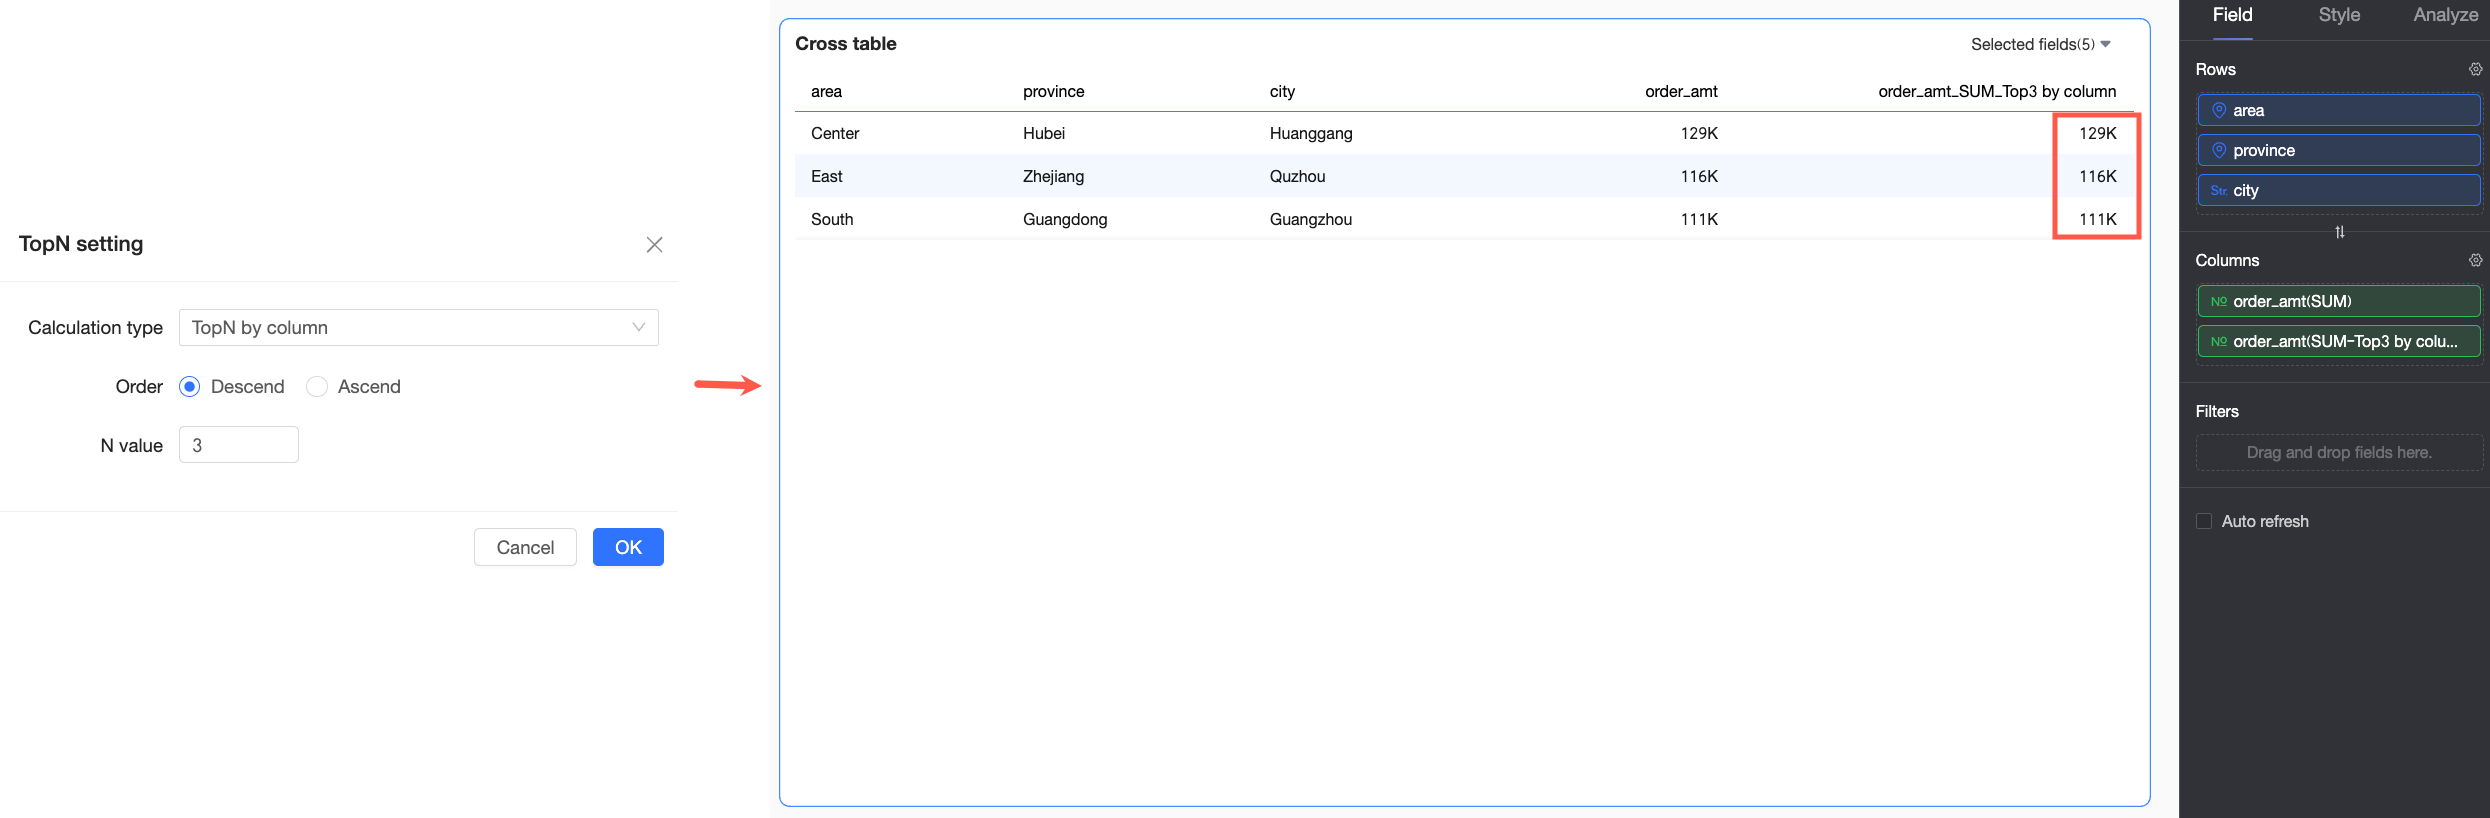
Column TopN
Treats each column as an independent analysis unit and filters out the top 3 data entries by order amount in an entire column.
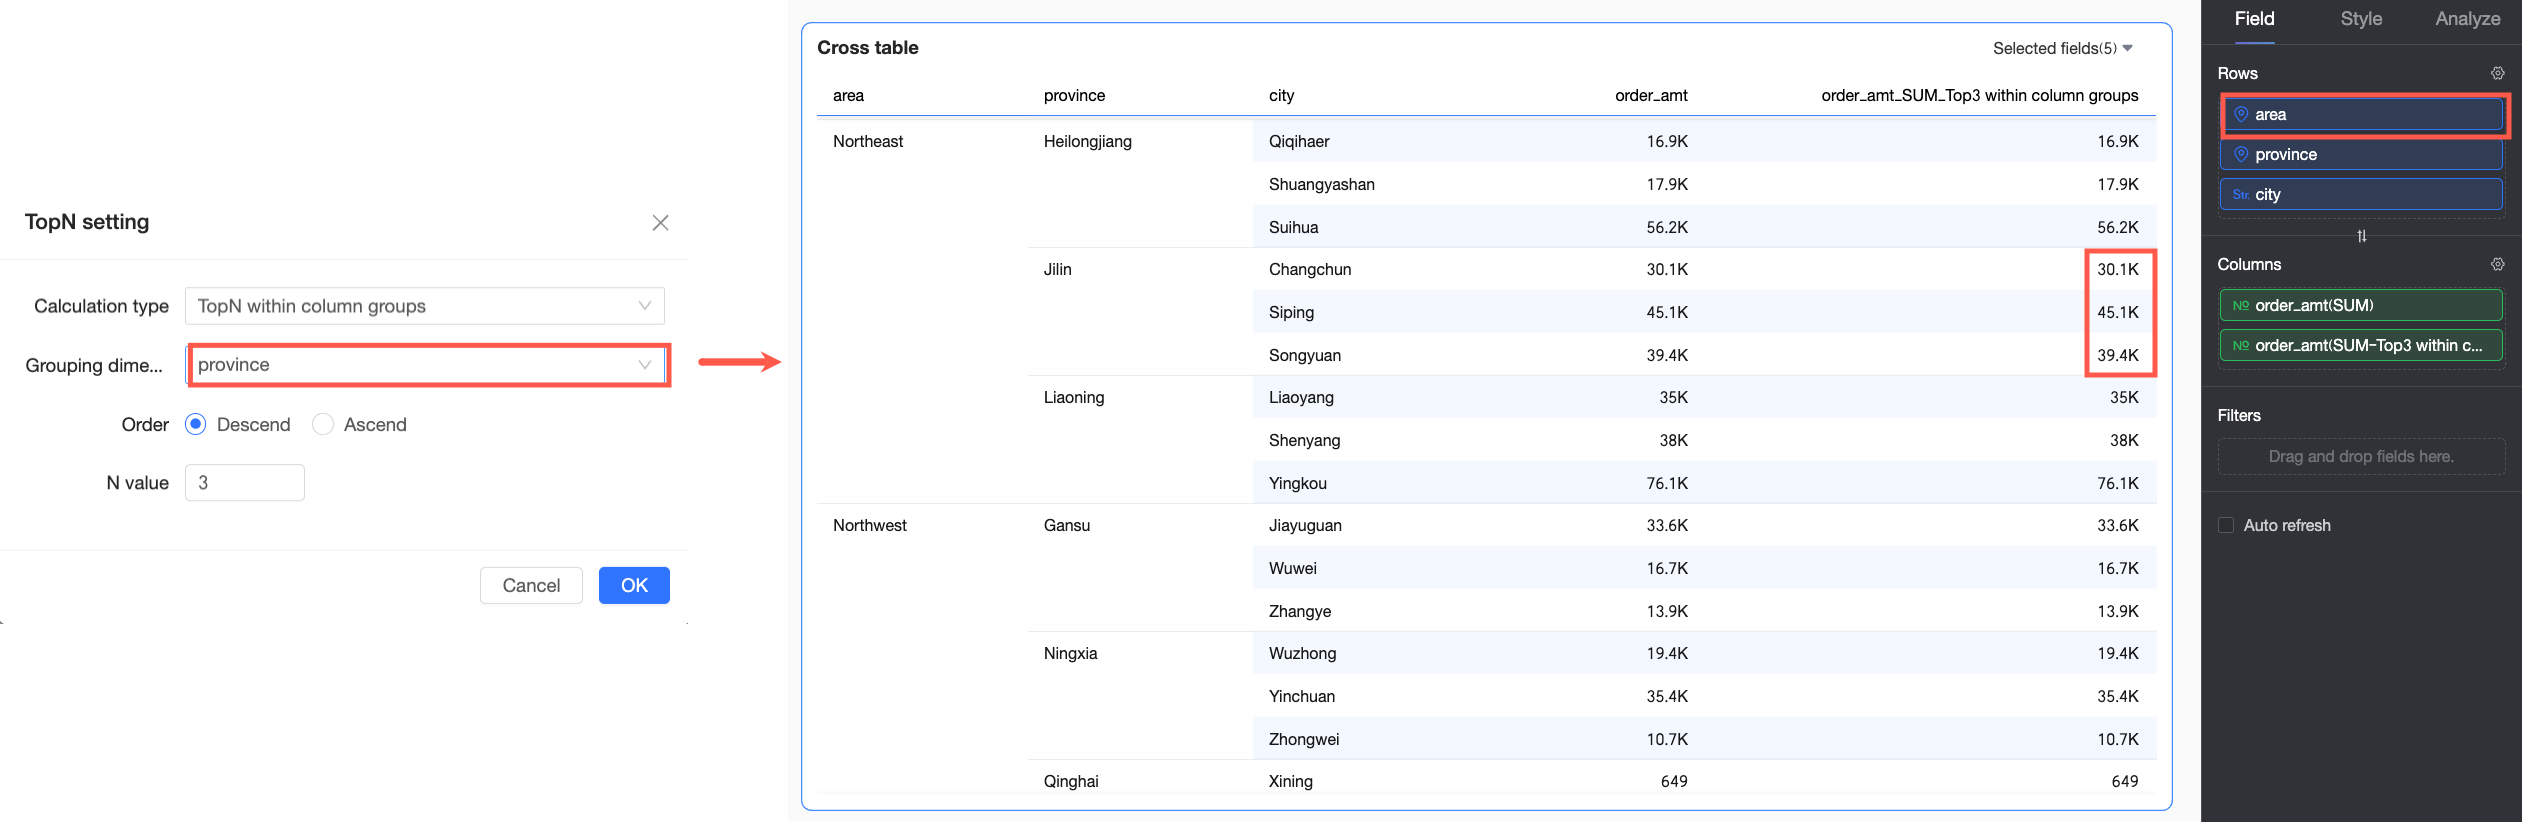
Column group-based TopN
In this example, the first dimension field in the Row is Region, and the grouping dimension is Province. Therefore, City is grouped by its Province and Region, and the top 3 cities by order amount are displayed for each province along with their order amounts.
Row TopN
Treats each row as an independent analysis unit and filters out the top 5 data entries by order amount in an entire row.

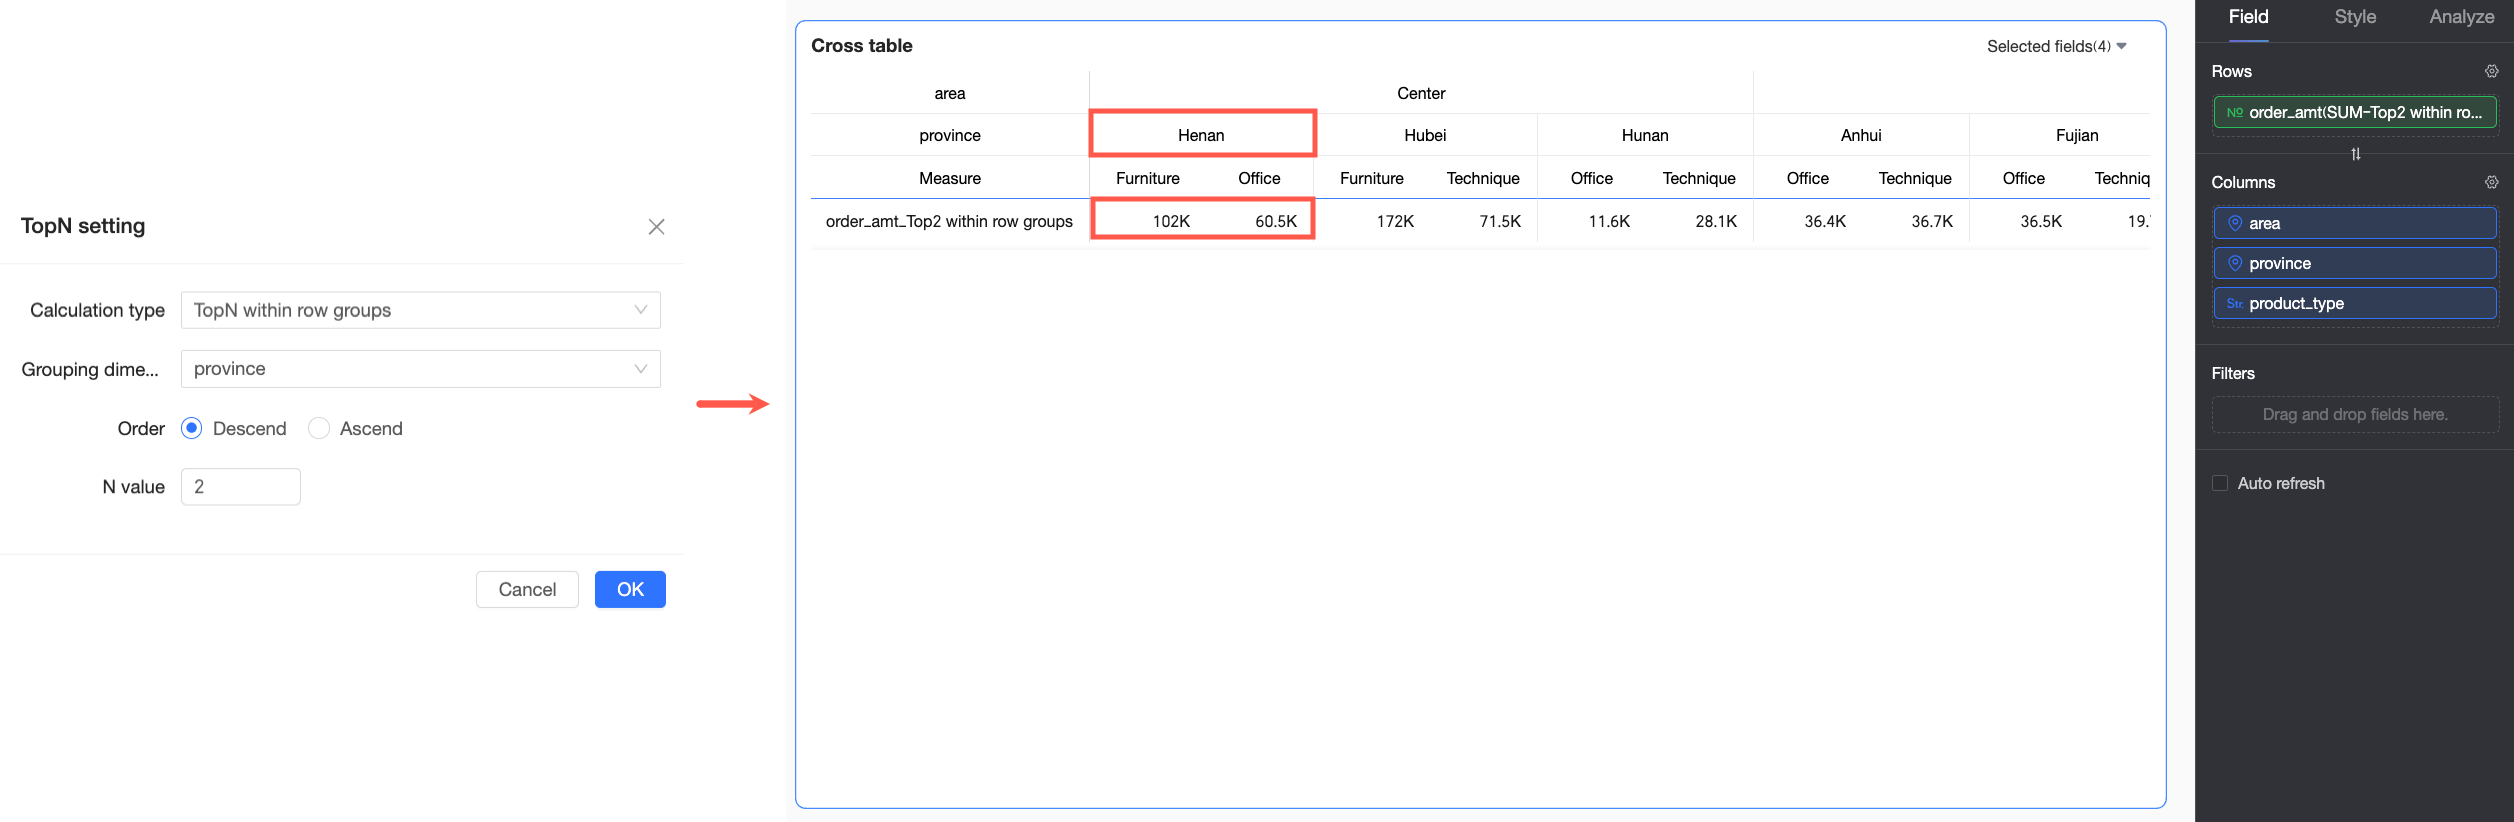
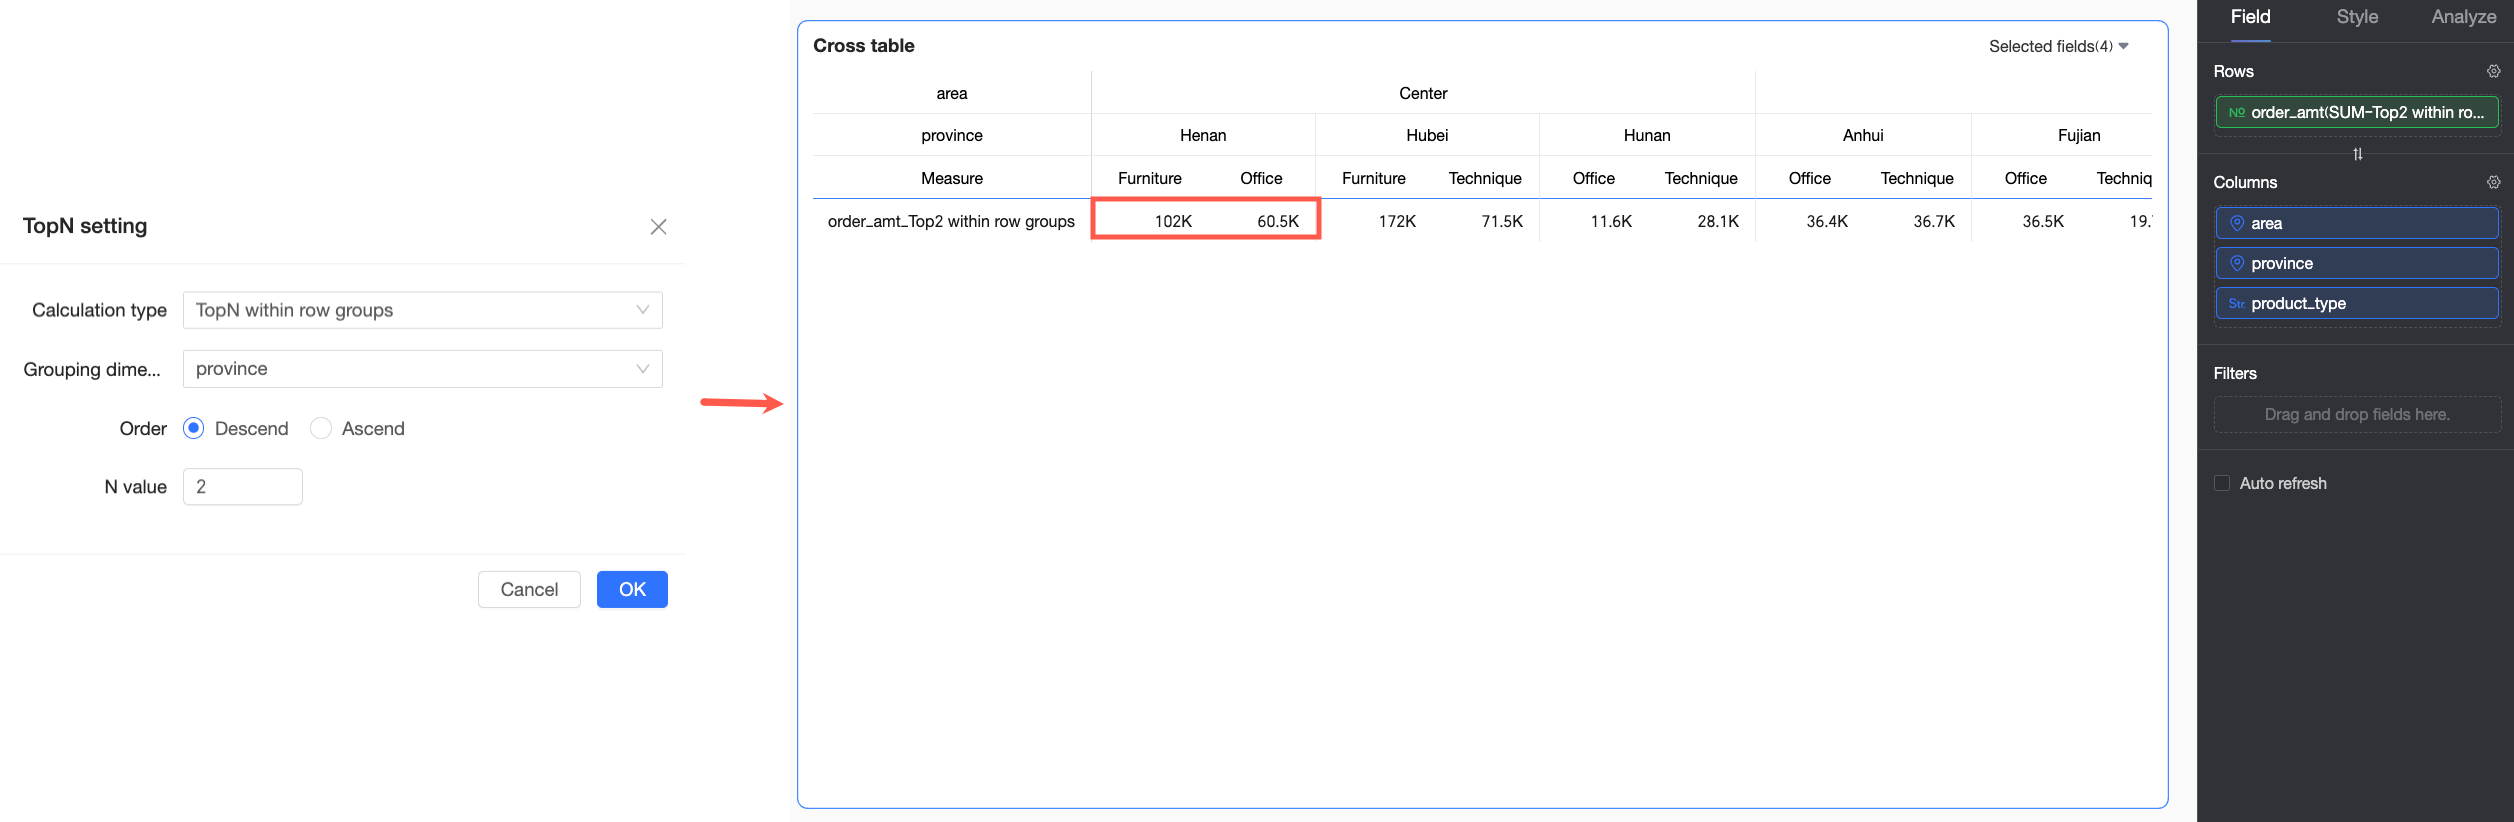
Row group-based TopN
In this example, the first dimension field in the Column is Region, and the grouping dimension is Province. Therefore, Product Type is grouped by its Region and Province, and the top 2 product types by order amount are displayed for each province along with their order amounts.
-
Special TopN calculations and processing methods
-
Processing of totals and subtotals
Totals and subtotals do not participate in quick filtering and cannot coexist with TopN. If TopN is enabled, totals and subtotals are automatically disabled.

-
Processing of row and column mixed layouts
In row and column mixed layouts, filtering uses dimension values in the first column by default. For example, the following illustration filters by order amount in the Northeast region.

-
Processing of null values
Null values are treated as the smallest values in TopN. For example, if there are 10 entries and you set Top5 (descending order), null values are filtered out. If you set Bottom5 (ascending order), null values are retained.
-
Processing of multiple TopN settings
Multiple TopN settings cannot take effect simultaneously. A later setting replaces the previous TopN setting.

-
Processing of multiple advanced calculations
A measure supports only one advanced calculation at a time. For example, setting TopN replaces any previously configured ranking.
-