Create a Data Visualization Screen
Select a theme template and perform basic operations on a data visualization screen.
Prerequisites
You have logged on to the Quick BI console and entered the data dashboard.
Adjust page styles
-
Adjust screen size
-
Set zoom mode
-
Set Global Style
-
Set Global filter
-
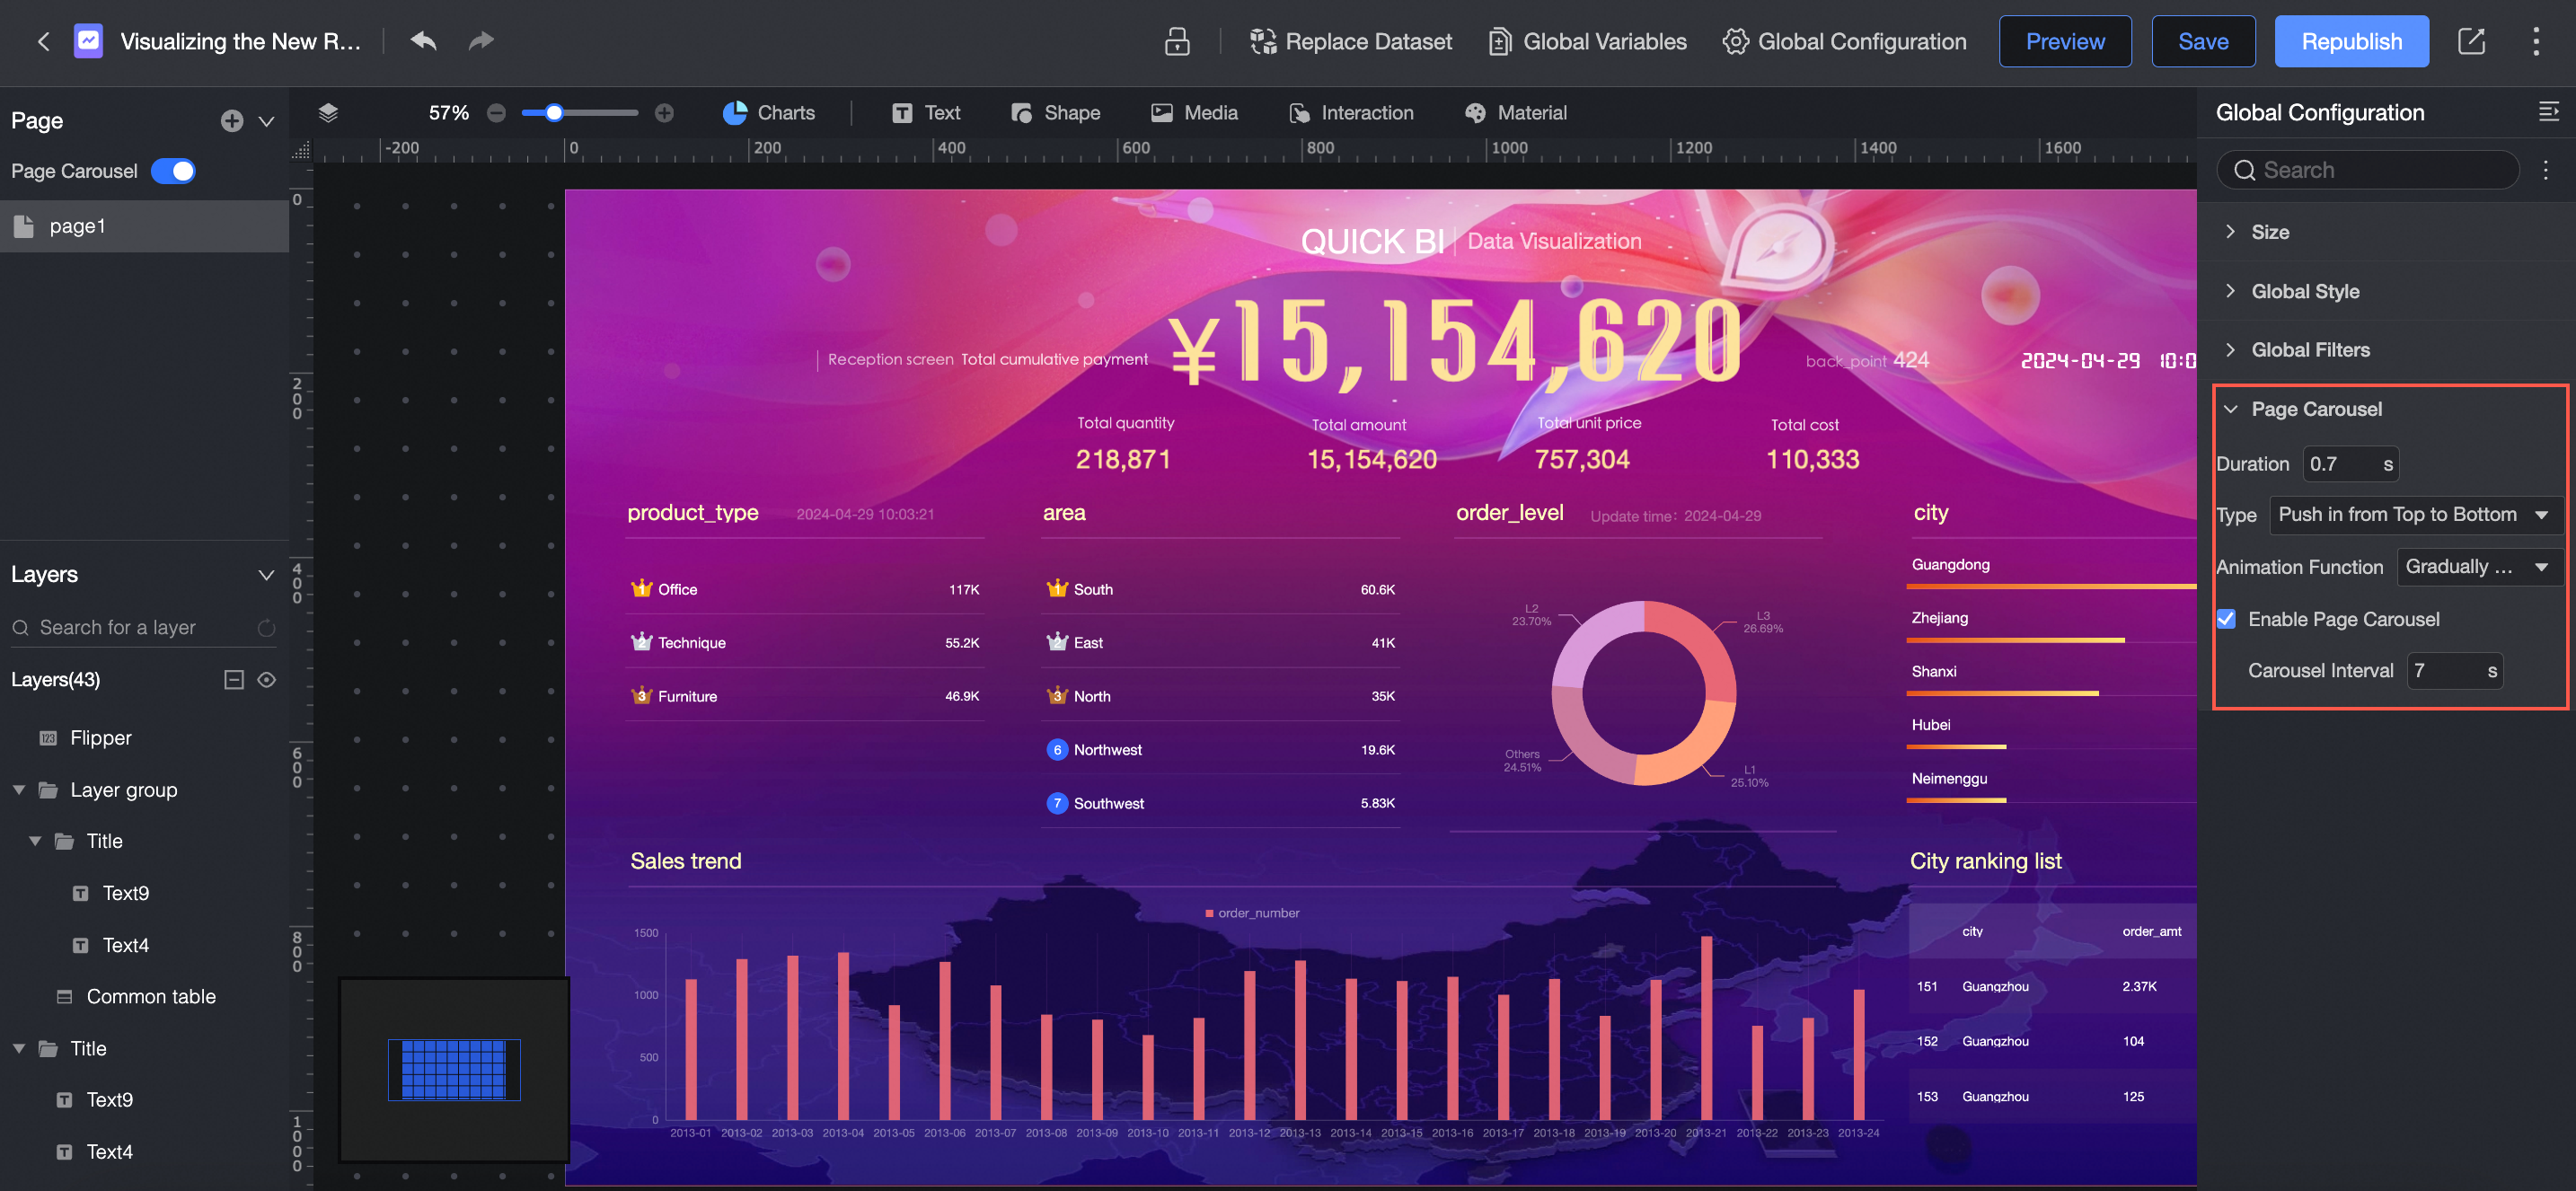
Set up page carousel
Configure layer groups
Each element in the canvas is a layer. You can group layers and enable layer carousel.
-
In the head navigation bar, drag a widget to the canvas.

-
Overlay the two layers, select them and right-click to combine them to form a layer group.
-
In the layer group on the right, select Enable Layer Overlay and adjust the transition duration, transition type, and animation function.
-
Select Enable Automatic Carousel and set the carousel interval.
 For more information, see Configure chart data and Configure chart styles.