Overview
Visualization Screen uses free-form canvas, infographic components, and dynamic effects to build data displays for CXO dashboards, business monitoring, project presentations, and PR events. Available only in group spaces of the Pro and Professional editions.
Scenarios
Visualization Screen supports CXO cockpits, activity data monitoring, project presentations, and external PR displays. As one of Quick BI's four major data analysis scenarios, it addresses use cases that require high visual impact.
Key features
Quick BI Visualization Screen provides an easy-to-use toolkit for building high-impact data displays.
-
Provides industry templates and materials for one-click deployment of visually rich screens.
-
Supports multi-scene, multi-page storytelling dashboards that combine data and narrative.
-
Offers refined chart configurations and animation effects for immersive presentations.
-
Enables one-click reuse of data indicators and analysis results for faster delivery.
The following figure shows the Visualization Screen interface. 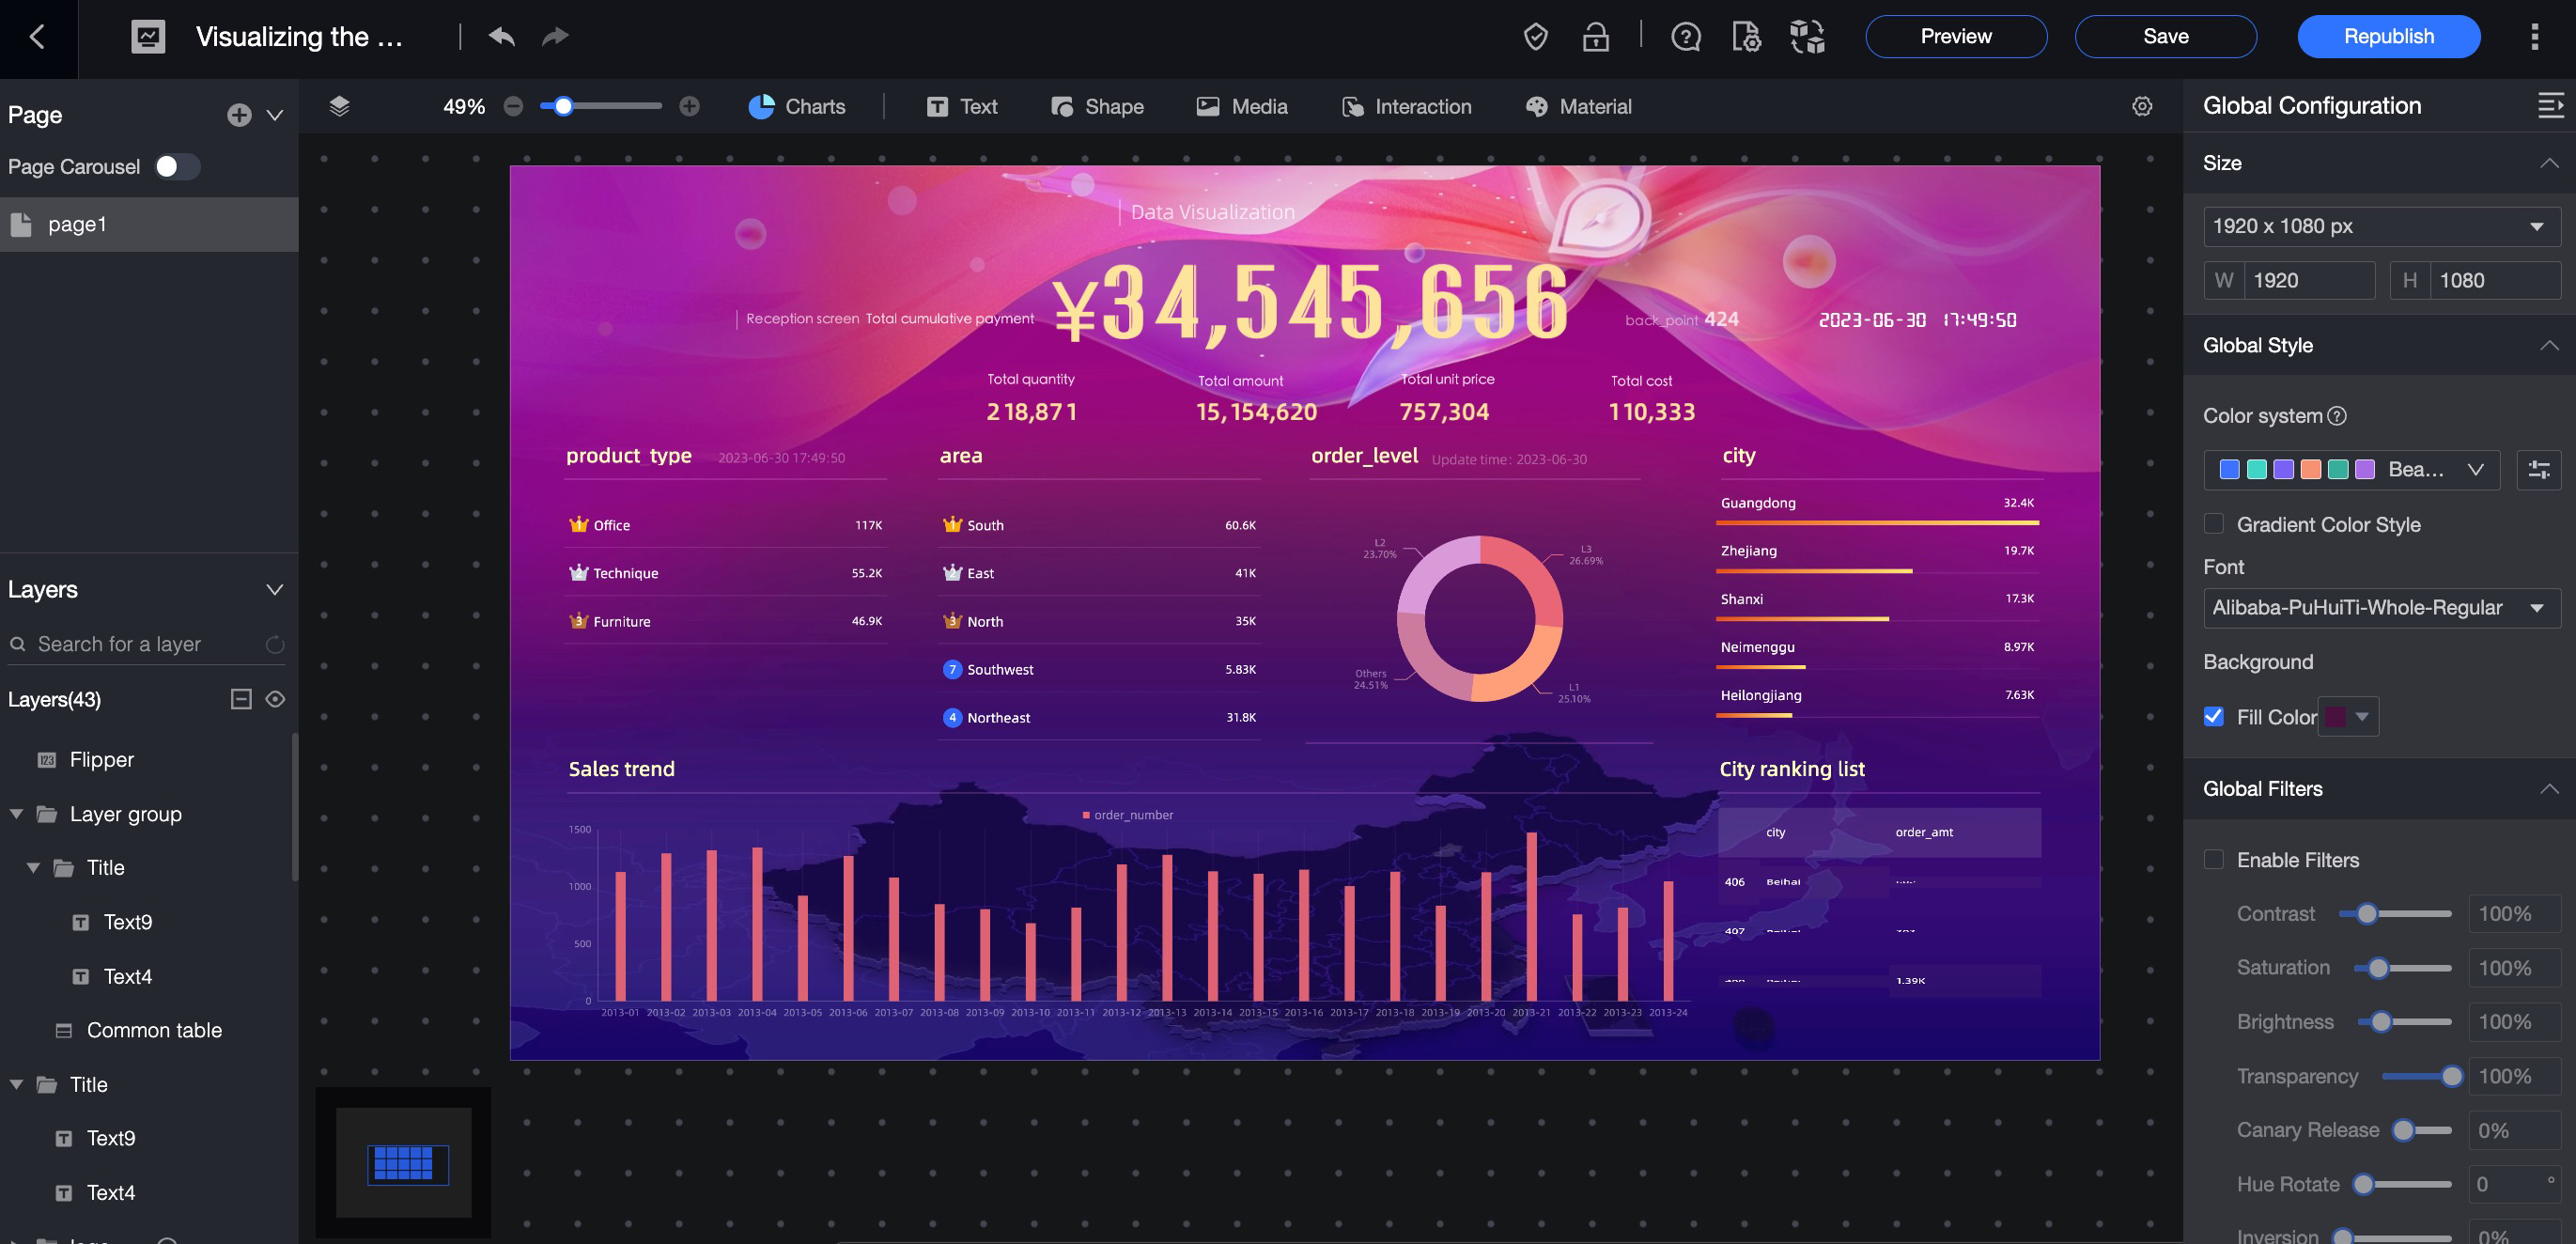
Visual effect display