Quick BI separates data configuration from style settings for flexible visual analysis. You can filter data, set display formats, create calculated fields, and perform other common chart data operations on the data dashboard editing page.
Chart Data Area
Batch Configure Field Styles
Edit multiple fields at once for efficient batch styling.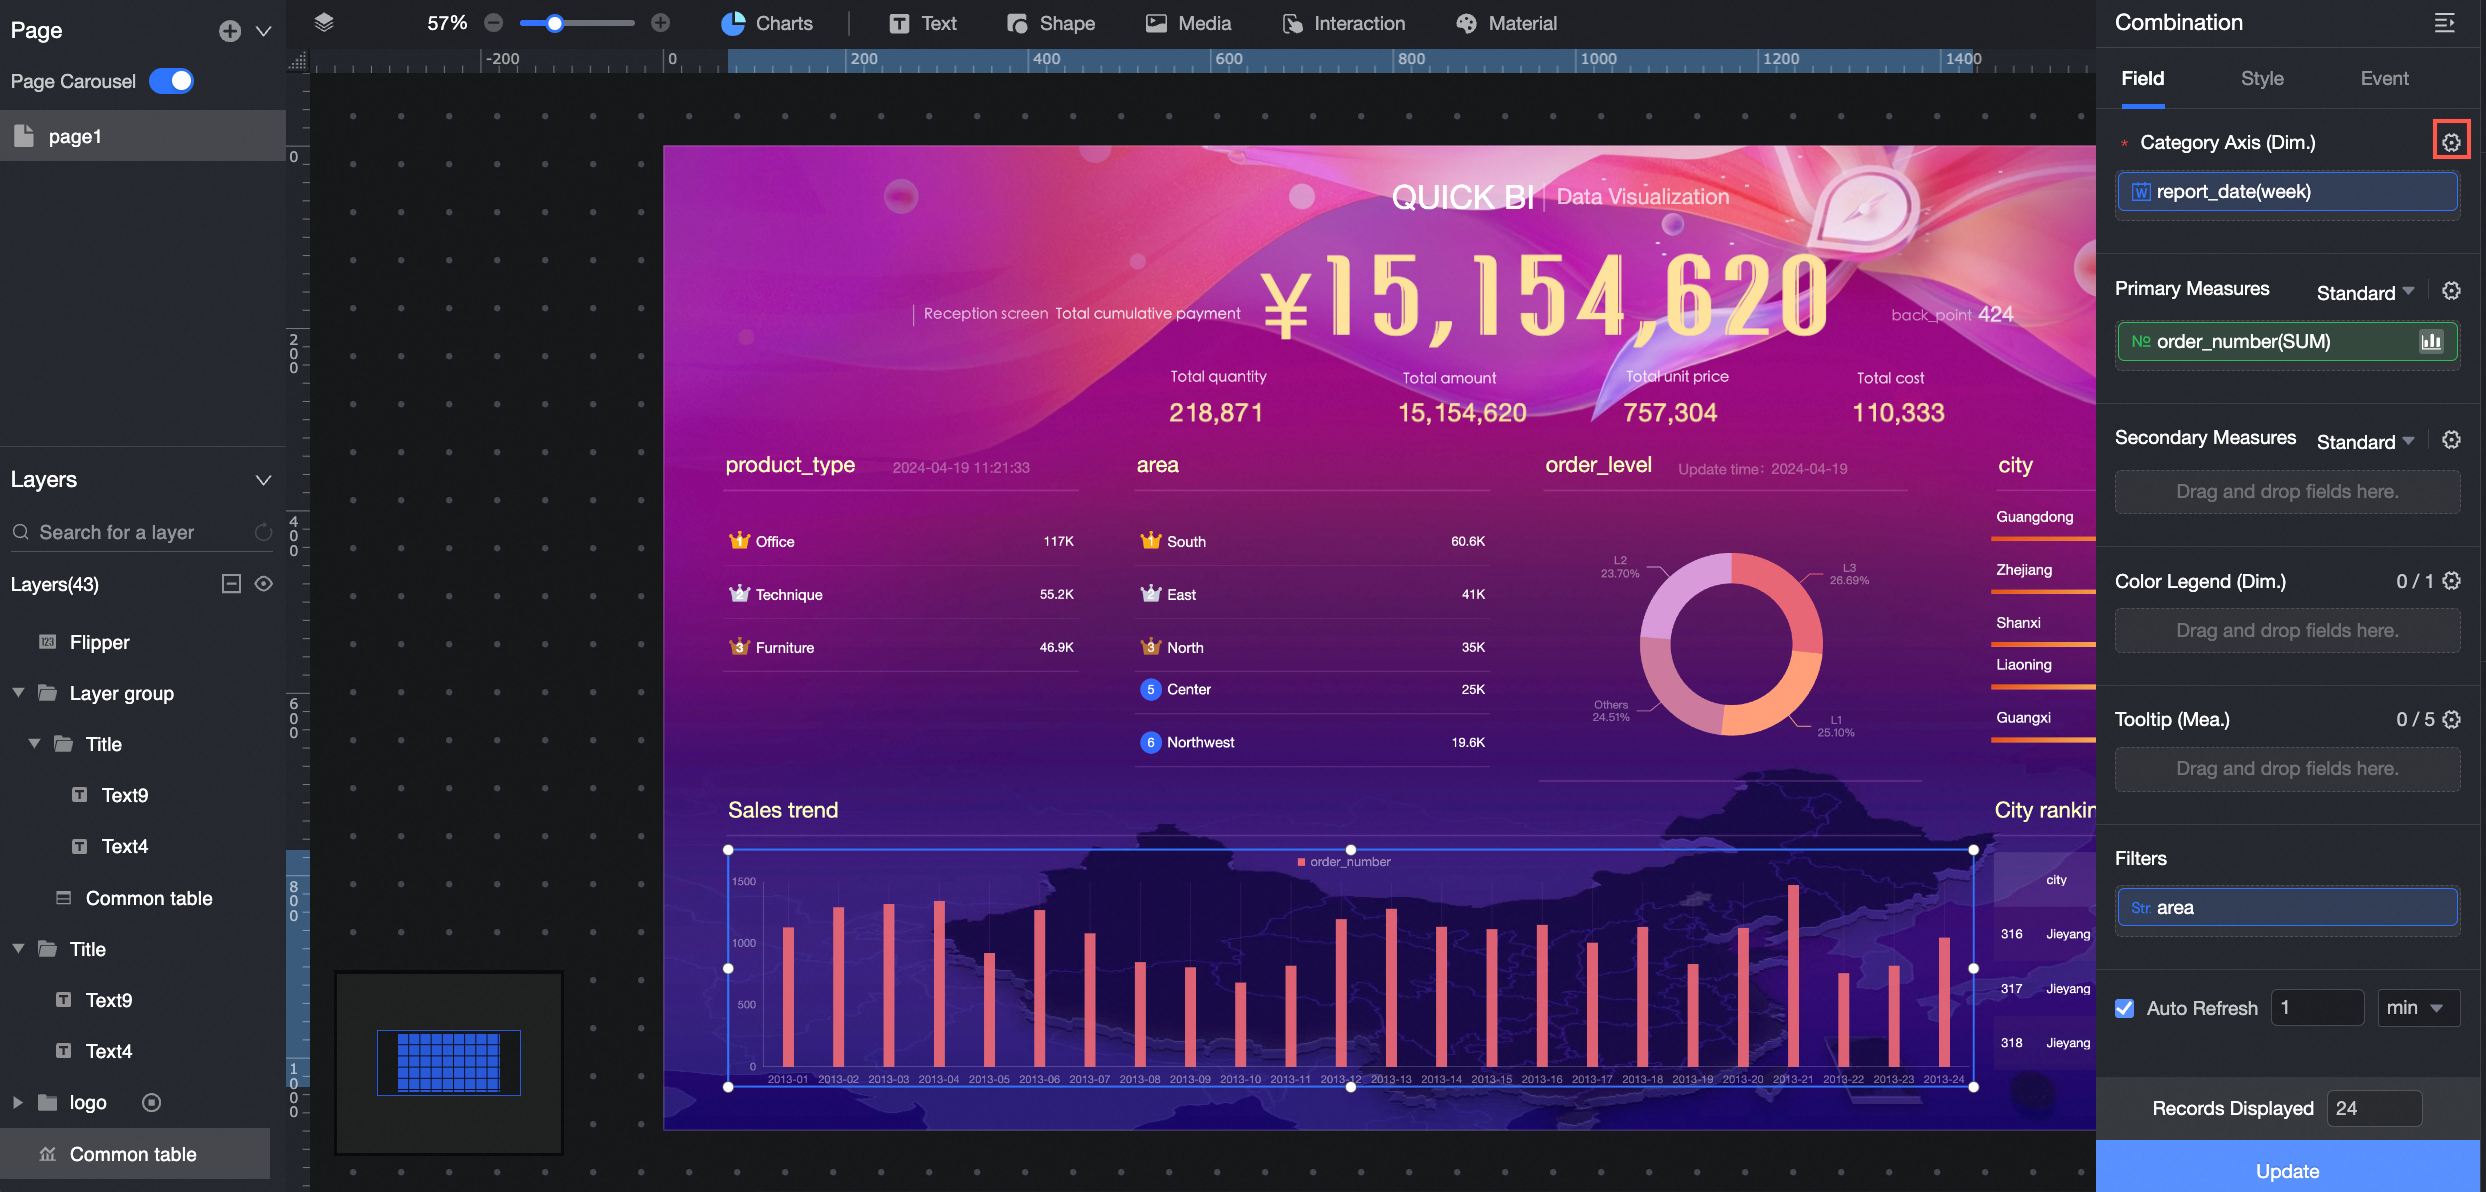
Data Display Format
Set the display format for measure fields. Supported formats include Auto, None (which displays the original value), Integer, 1 decimal place, 2 decimal places, Percentage, Percentage with 1 decimal place, Percentage with 2 decimal places, and Custom.
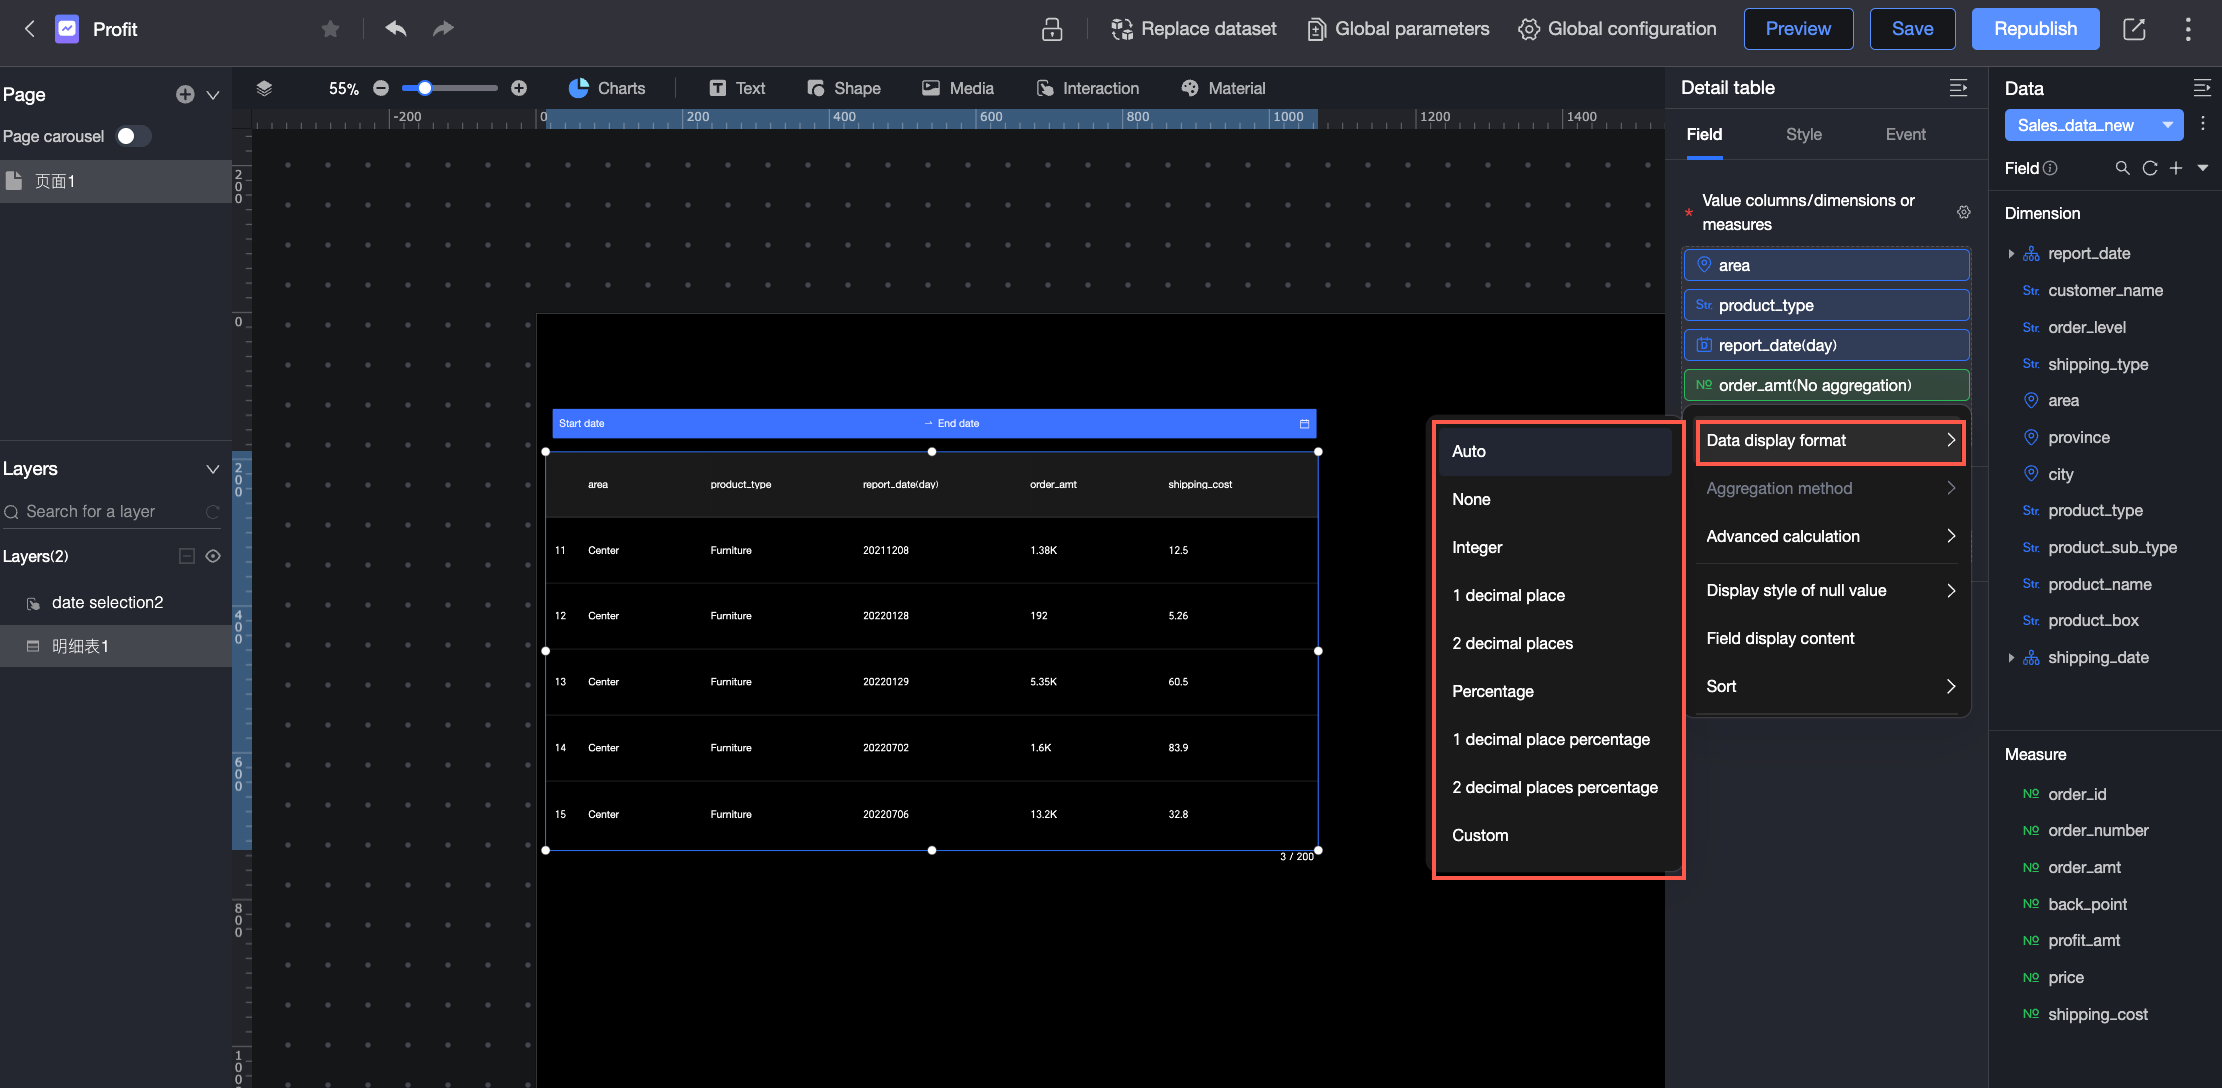
For more information about how to configure display formats in Custom mode, see Custom data display format.
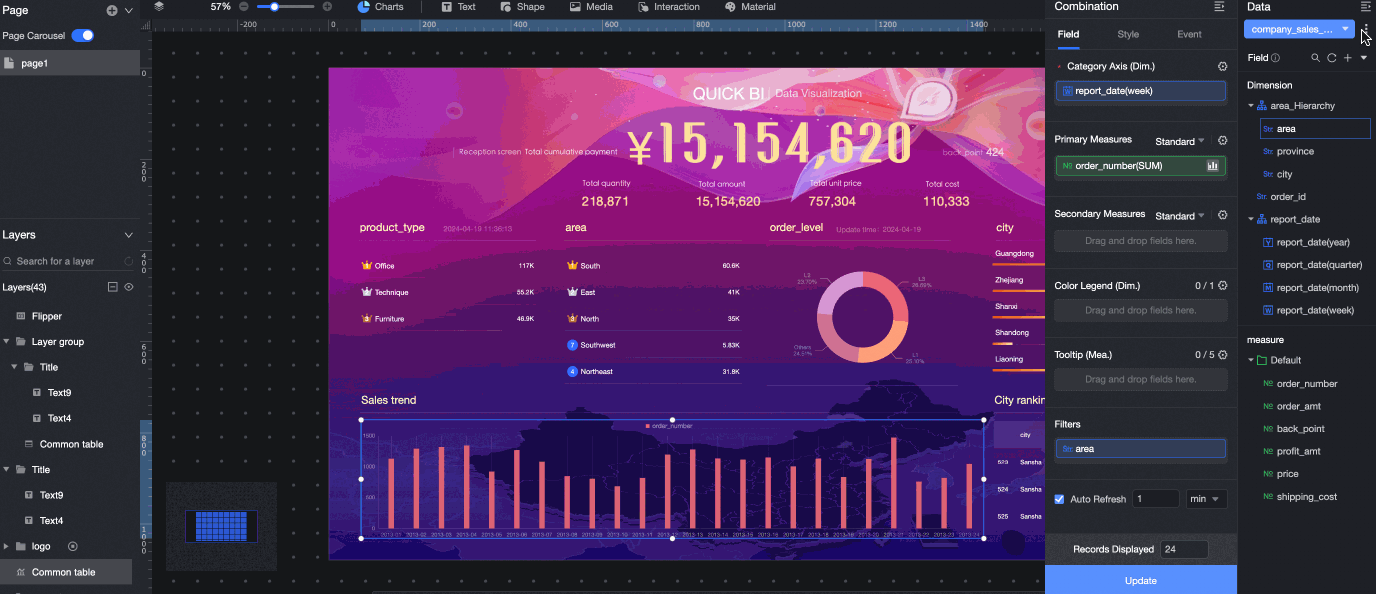
Filter Data
Filters narrow your data to specific information, which is especially useful for large datasets. You can filter data by text, numeric, and date types.
Text Type
For example, you can filter a province field to display only municipalities.
Example: Filter by province
-
In the Filter area, click the
 icon next to the Province field to configure the filter.
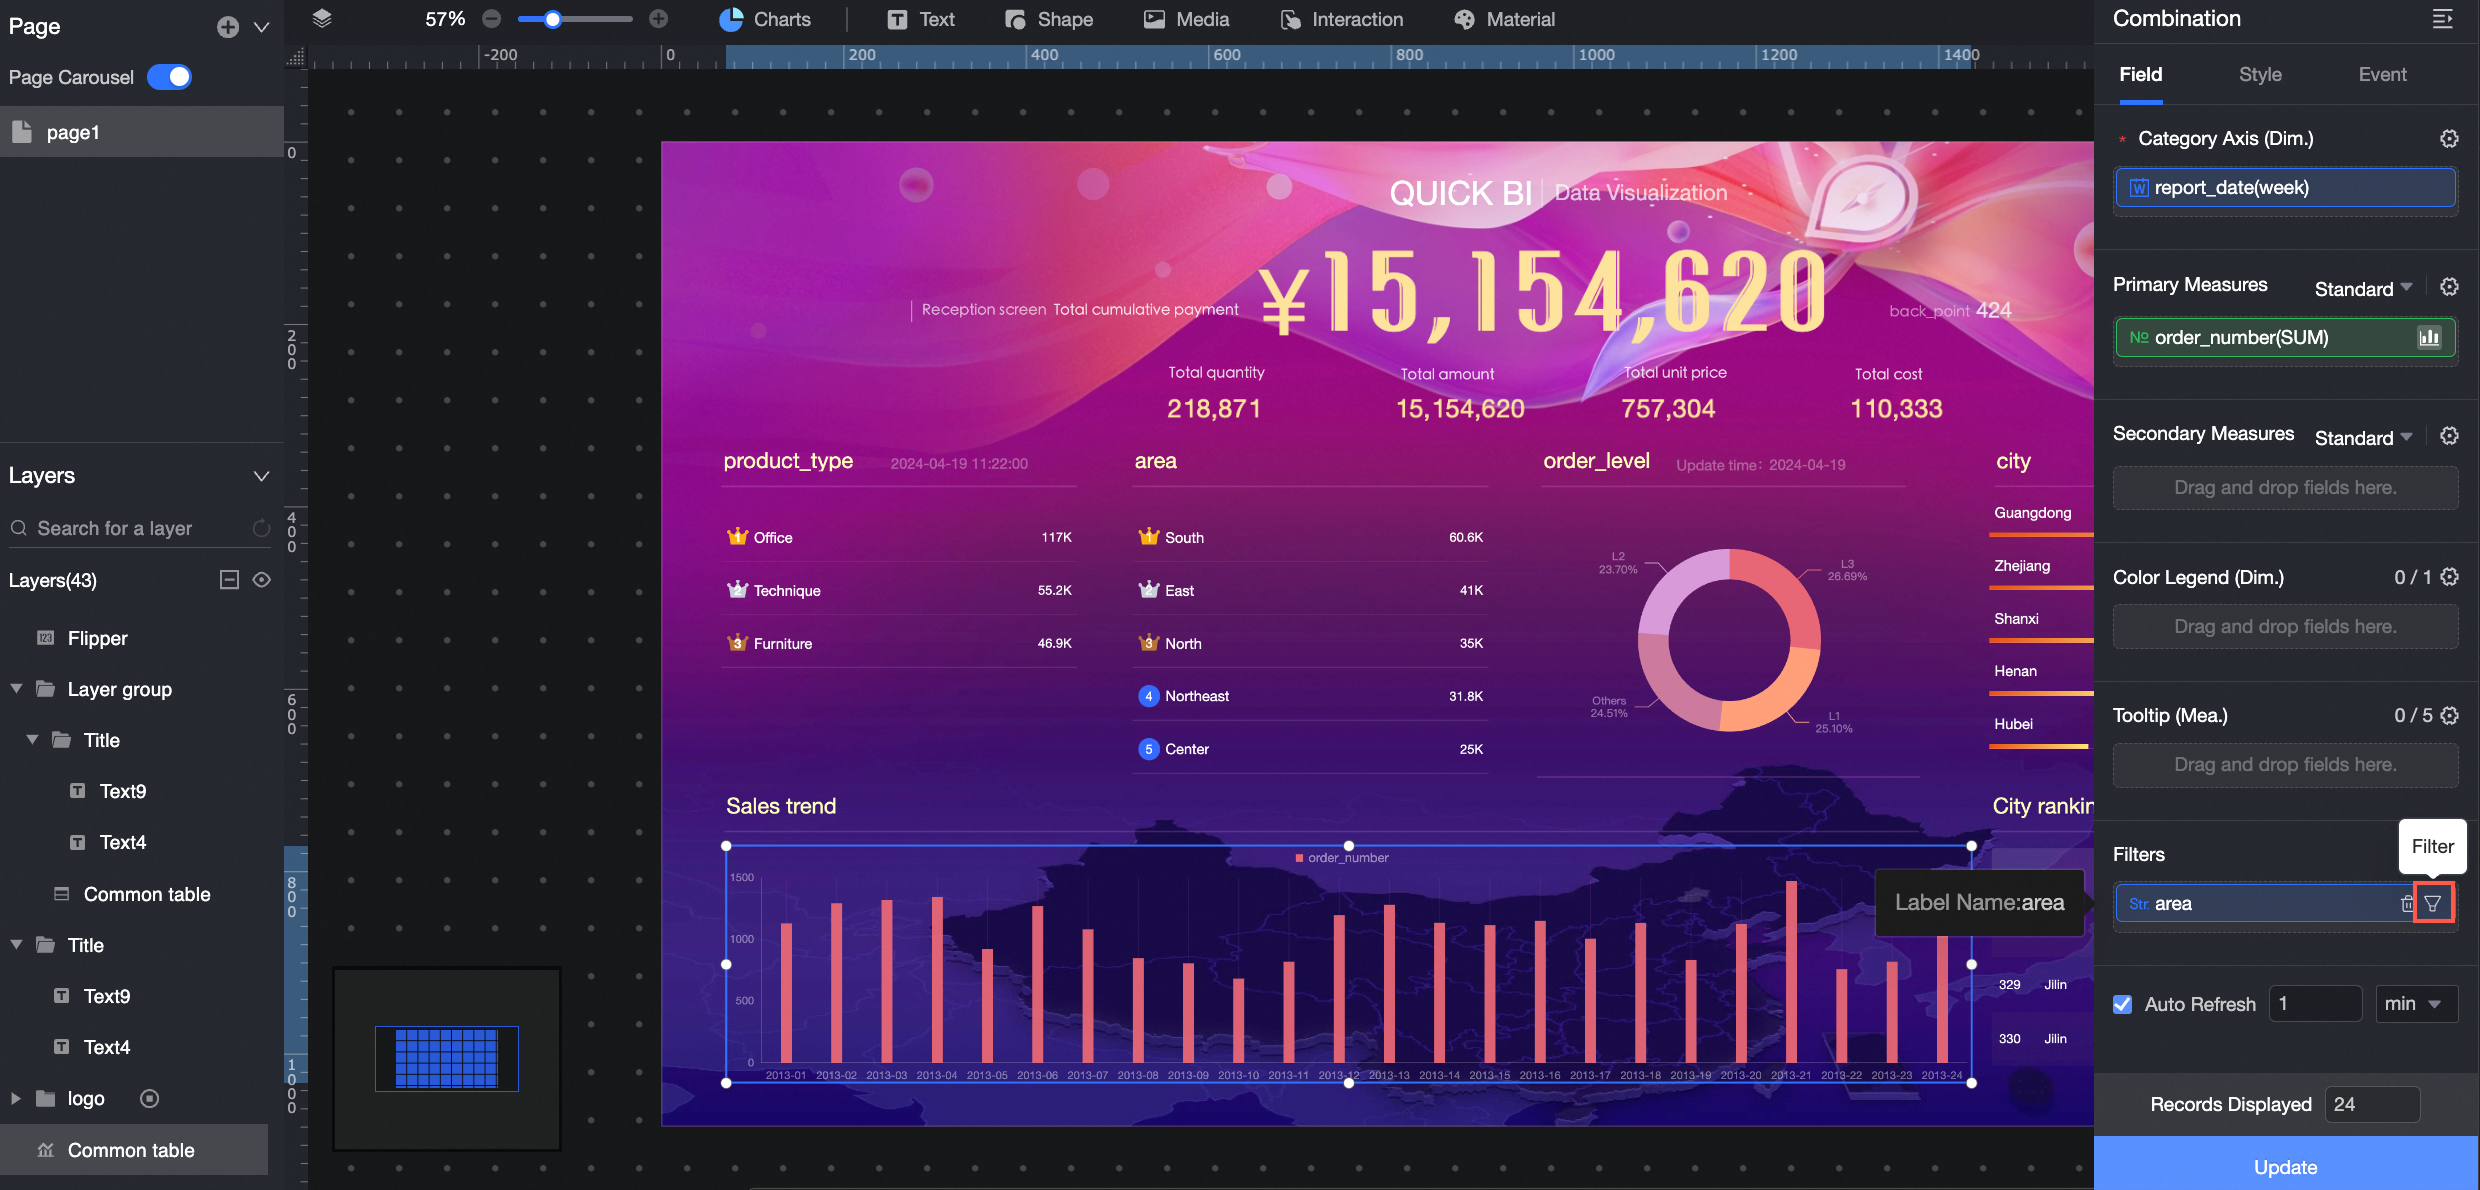
-
Configure the filter.
Parameter
Description
Example
Filter method
Supports filter by condition and filter by enumeration.
filter by enumeration
Condition type
Supports Single Condition, OR Condition, AND Condition.
NoteThis parameter is available only when you set Filter method to filter by condition.
Not applicable
Query method
Supports Single-select and Multi-select.
NoteThis parameter is available only when you set Filter method to filter by enumeration.
Not applicable
Filter condition
Set the filter conditions as needed.
Shanghai, Tianjin, Beijing, Chongqing
-
You can click Quick Entry to enter field values manually.
Alternatively, you can select the required field values from the list:
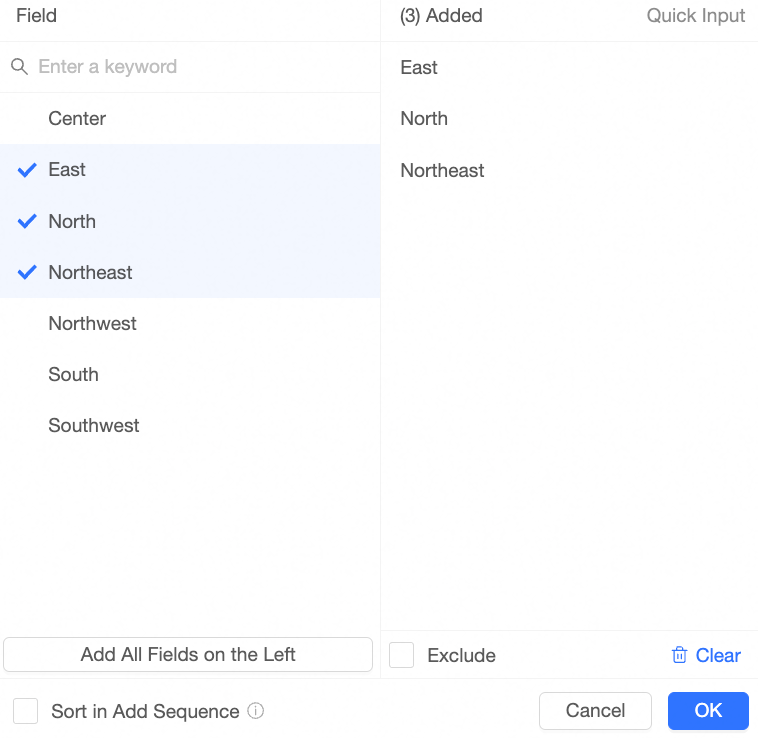
In the Fields dialog box, you can perform the following operations:
-
Enter a keyword in the search box and click the keyword below to add the matching field value from the left to the Added list on the right.
-
Click Add All Values on the Left to add all field values from the left to the Added list.
-
Select the checkboxes for the field values on the left to add them to the Added list.
-
Click Exclude to exclude the field values that are in the Added list.
-
Click Clear to remove all field values from the Added list.
-
-
After you complete the settings, click OK.
-
Click Update. The chart then redraws based on the filter settings.
Numeric Type
You can filter data by a specific numeric range. For example, you can set the Order Quantity to be between 50,000 and 100,000.
Example: Filter by order quantity
-
In the Filter area, click the
icon next to the Order Quantity field to configure the filter.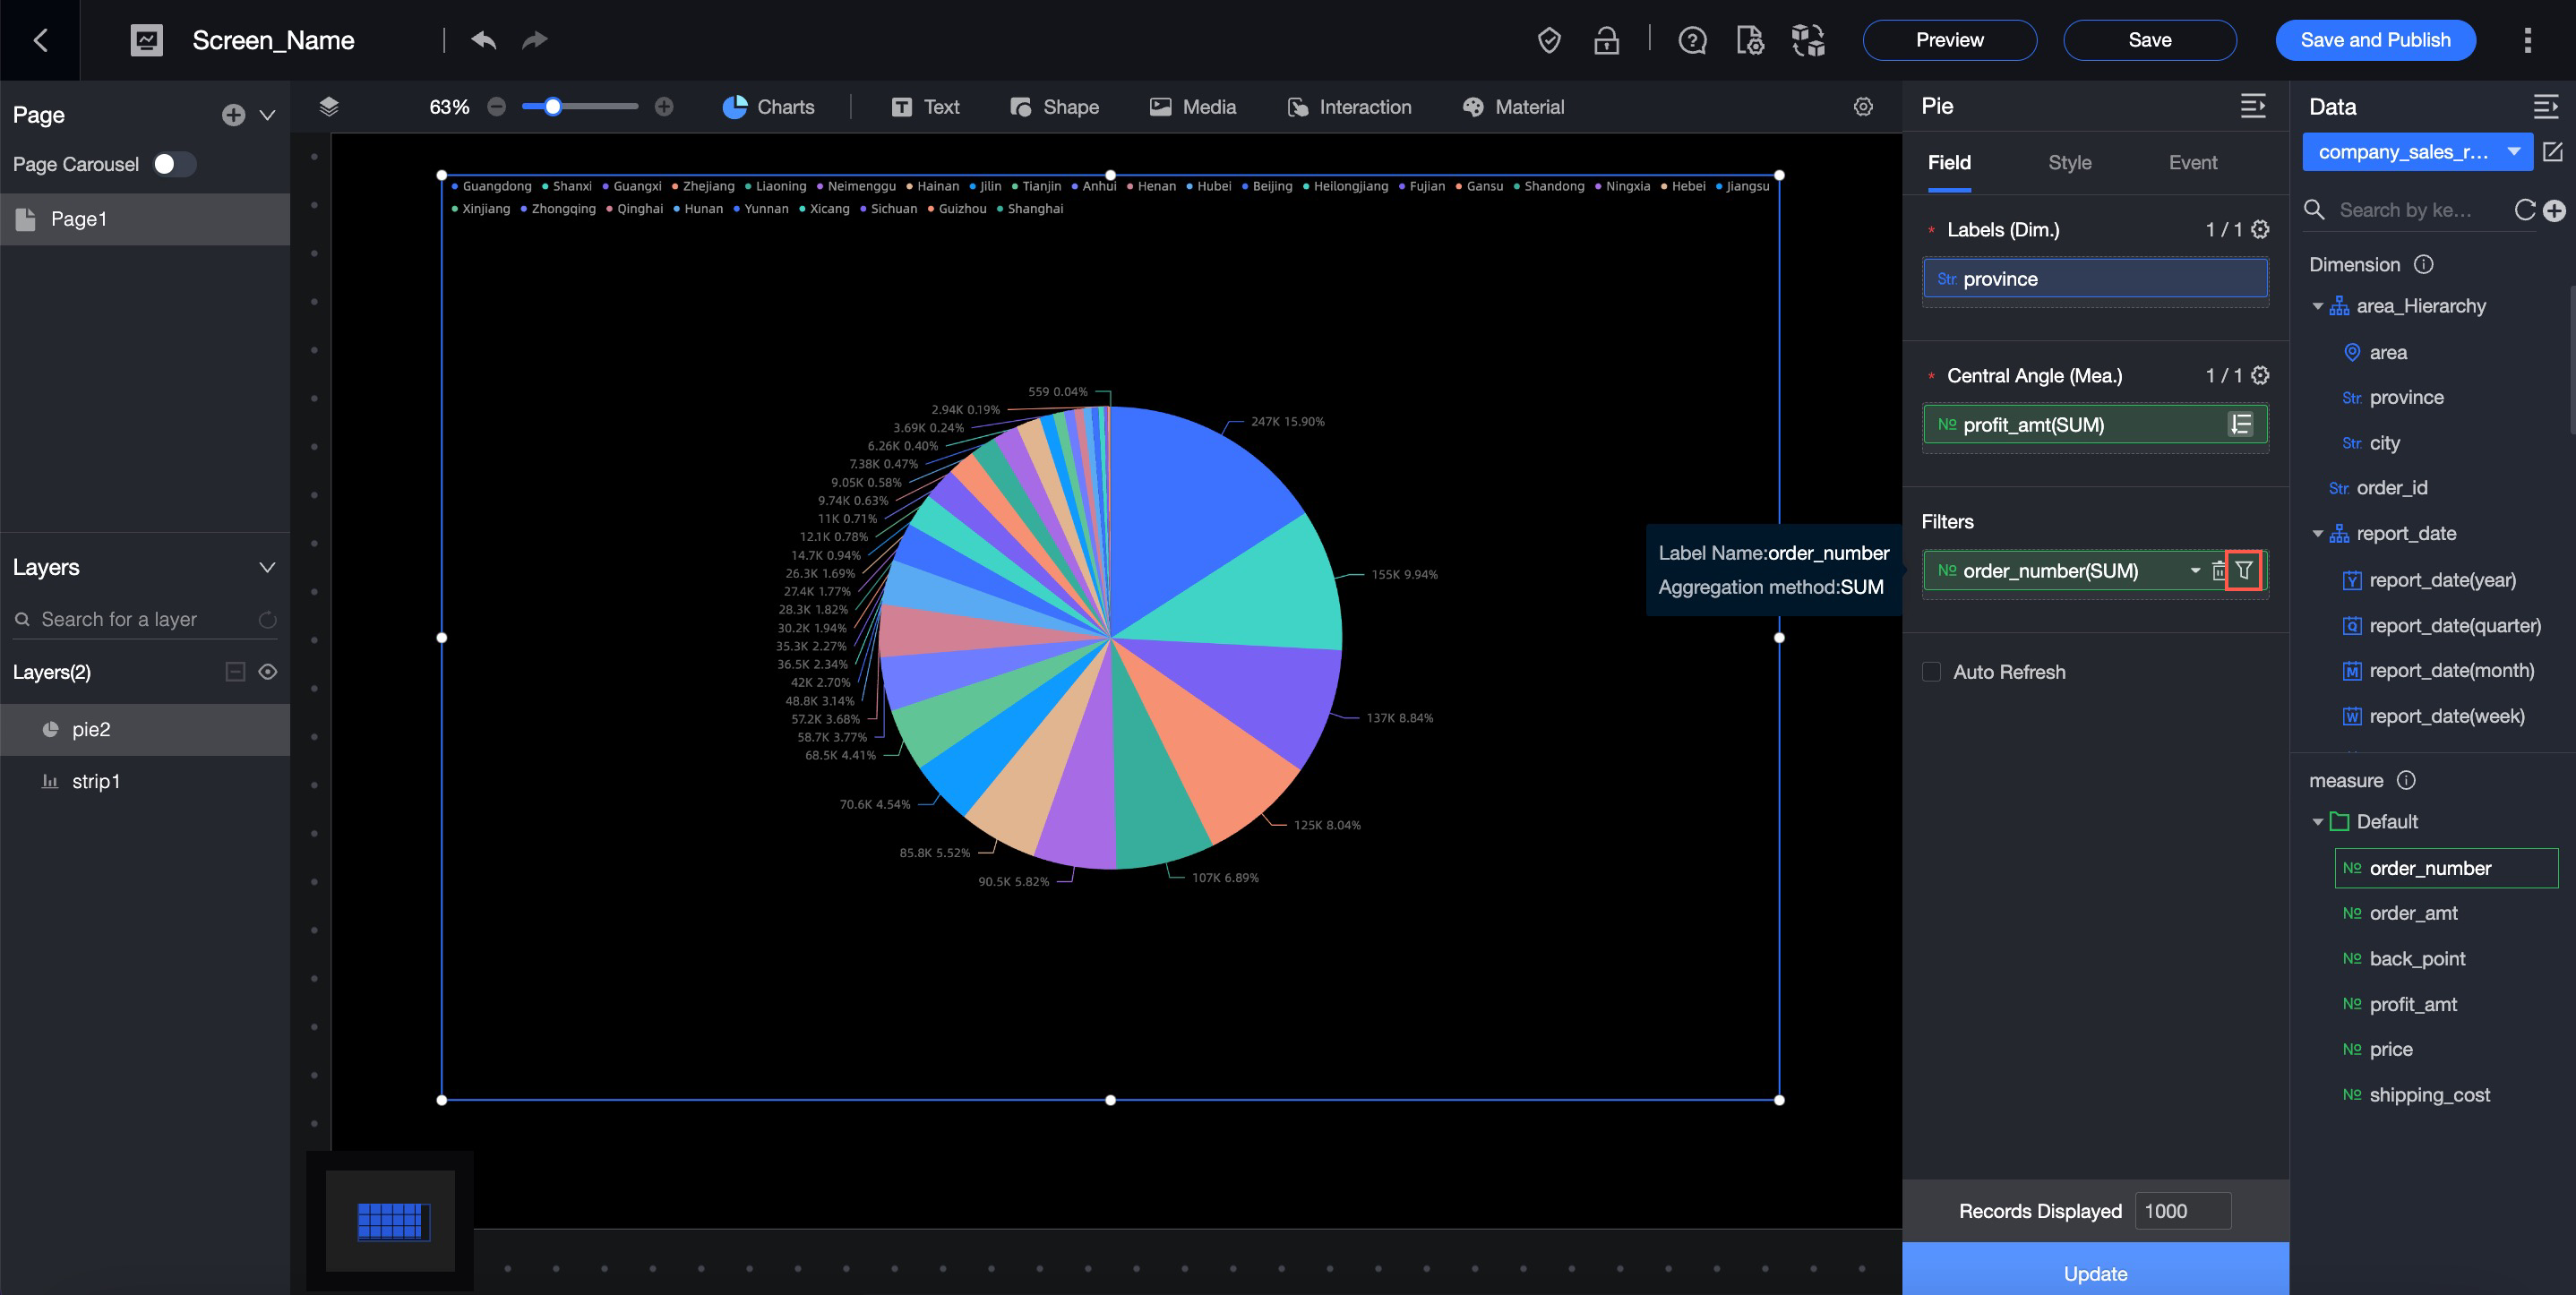
-
Select a filter condition, such as greater than, less than, or equal to.
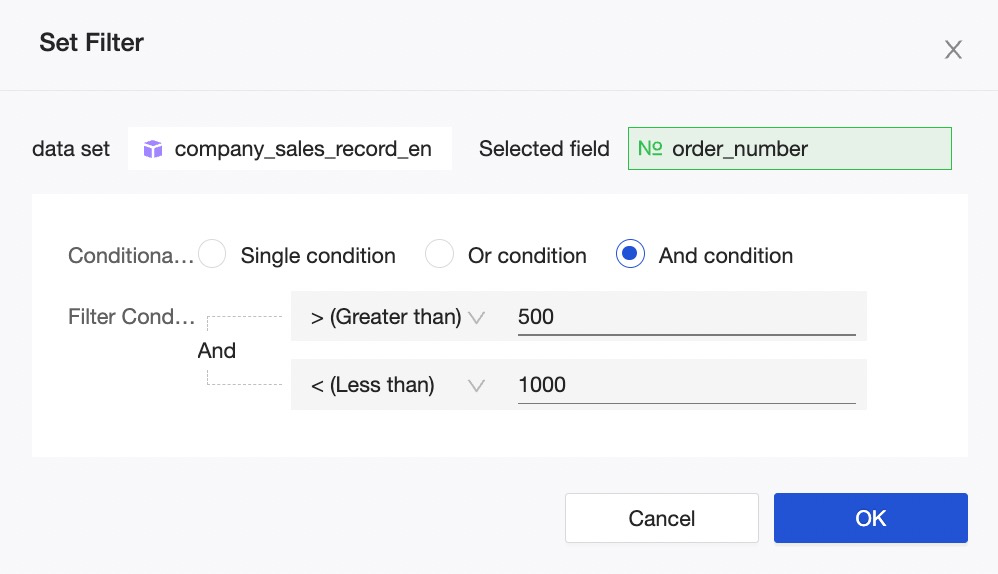
-
After you complete the settings, click OK.
-
Click Update. The chart then redraws based on the filter settings.
Date Type
You can set a filter to display data from a specific time period. For example, you can display data for order quantities and profit amounts only from February 2010.
Date and time data can be specified to the second.
Example: Filter by order date (month)
-
In the Filter area, click the
icon next to the Order Date (month) field to configure the filter.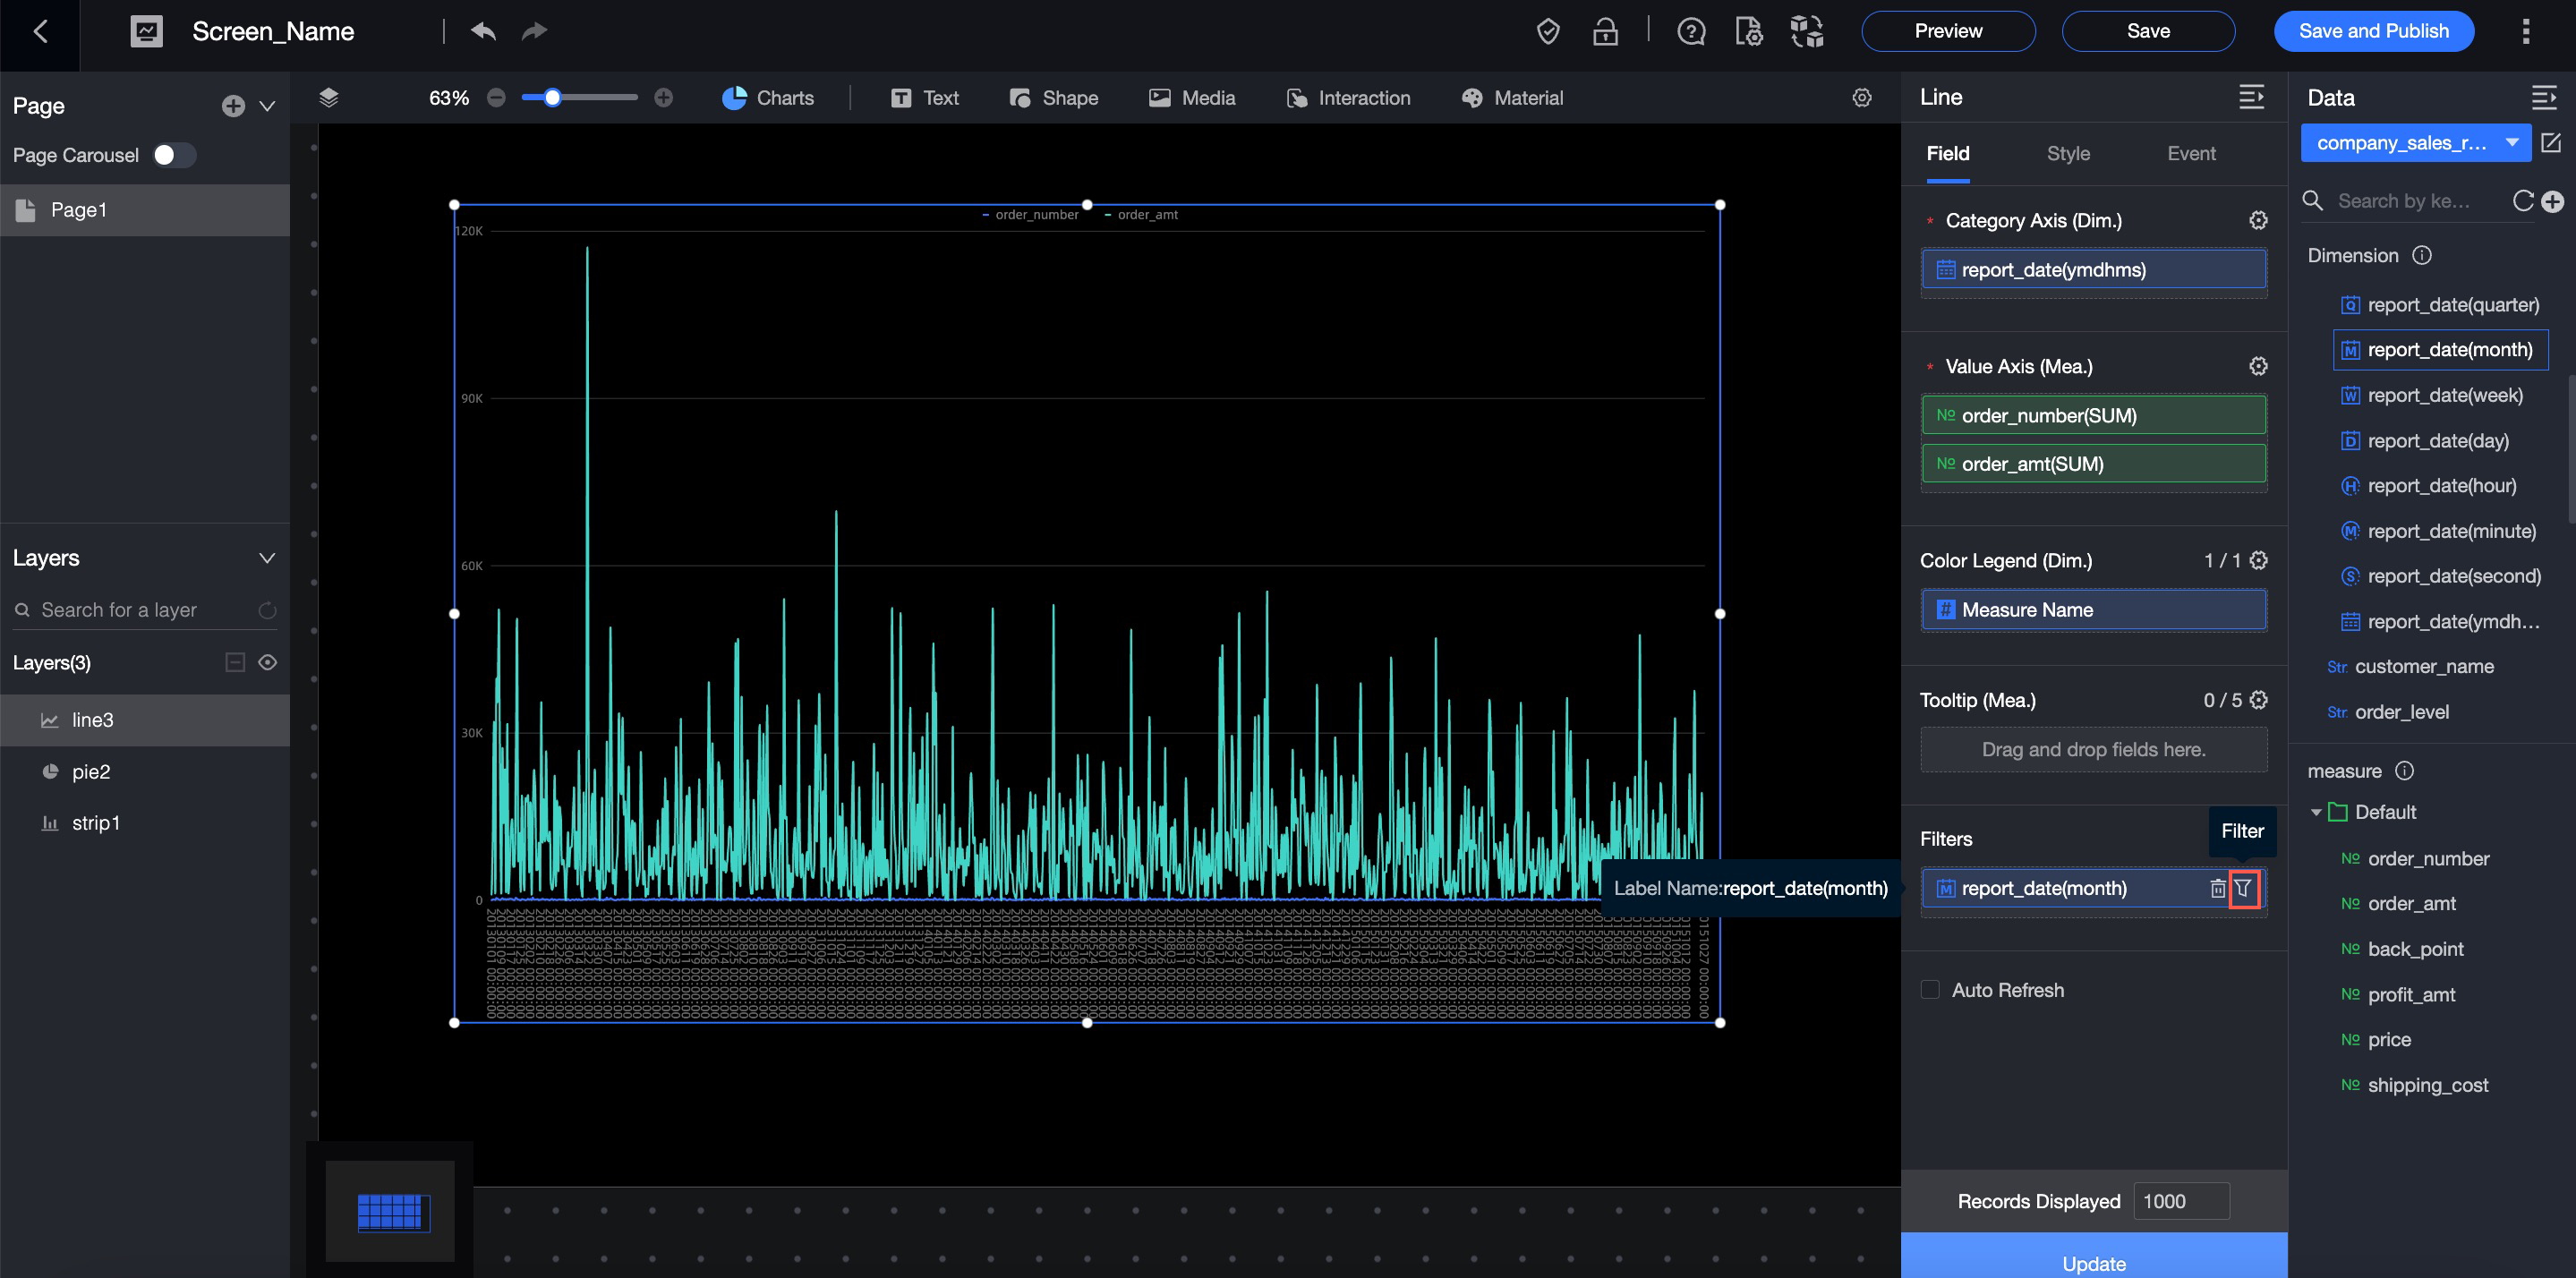
-
Configure the filter.
Parameter
Description
Example
Filter method
Supports Single Month and Month Range.
Single Month
Range type
Supports Starts from, Ends at, and Time Range.
NoteThis parameter is available only when you set Filter method to Month Range.
Not applicable
Filter condition
You can set a Relative Time or an Exact Time.
Exact Time
-
After you complete the settings, click OK.
-
Click Update. The chart then redraws based on the filter settings.
Configure Auto-refresh
Enable auto-refresh to have chart data refresh automatically at a set interval. For example, if you set the interval to 5 minutes, the data refreshes every 5 minutes.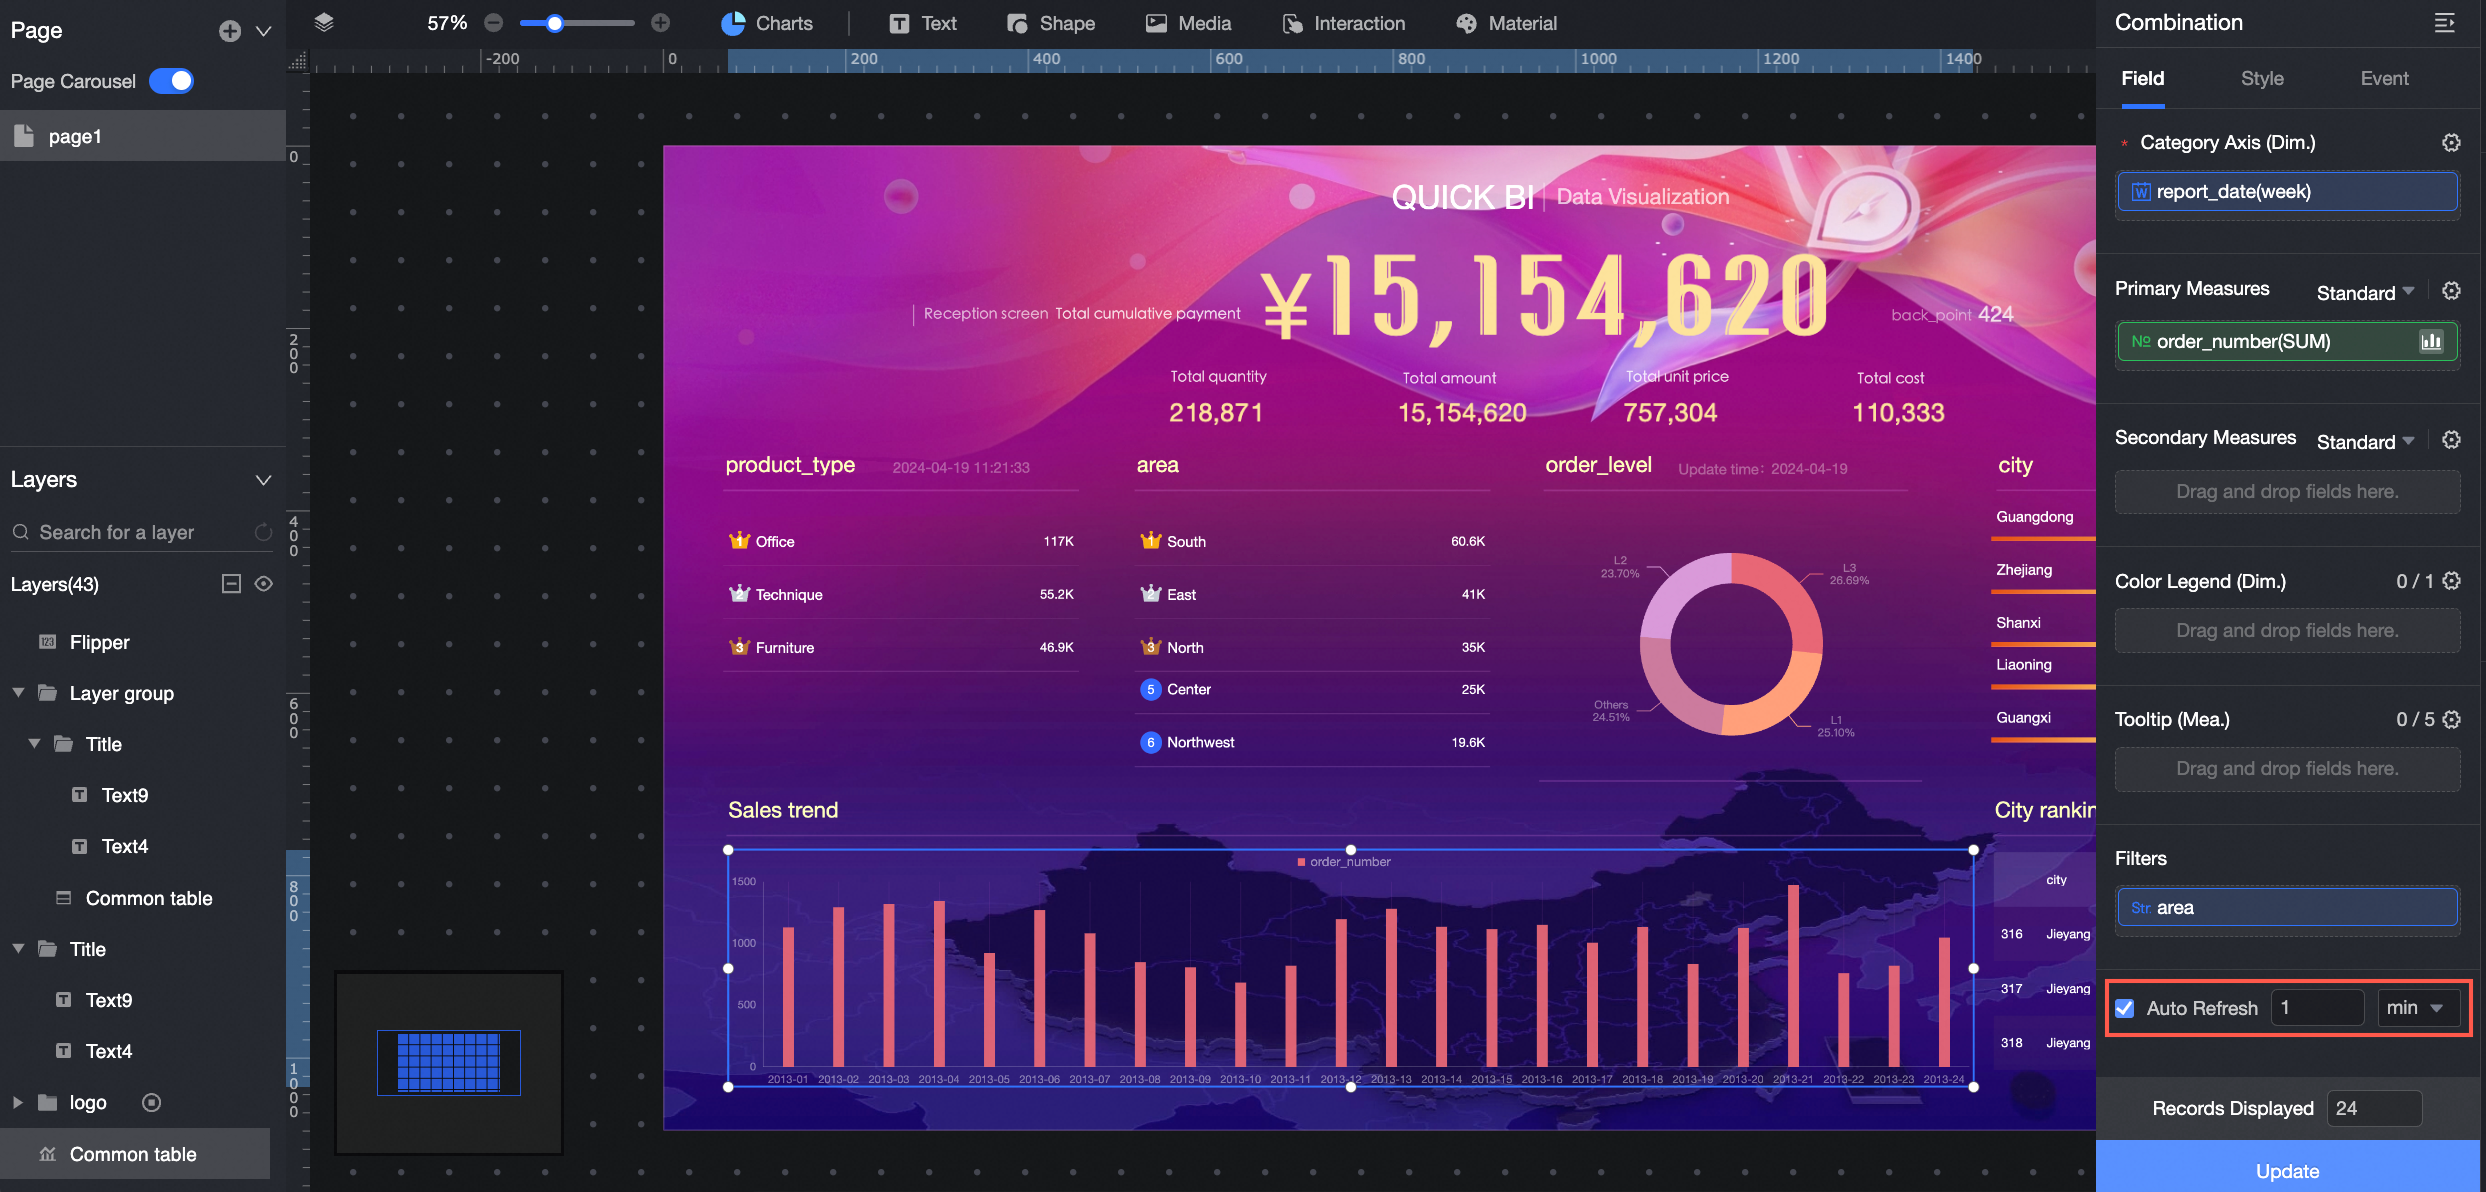
Set Display Row Limit
Set the number of rows to display in the data preview.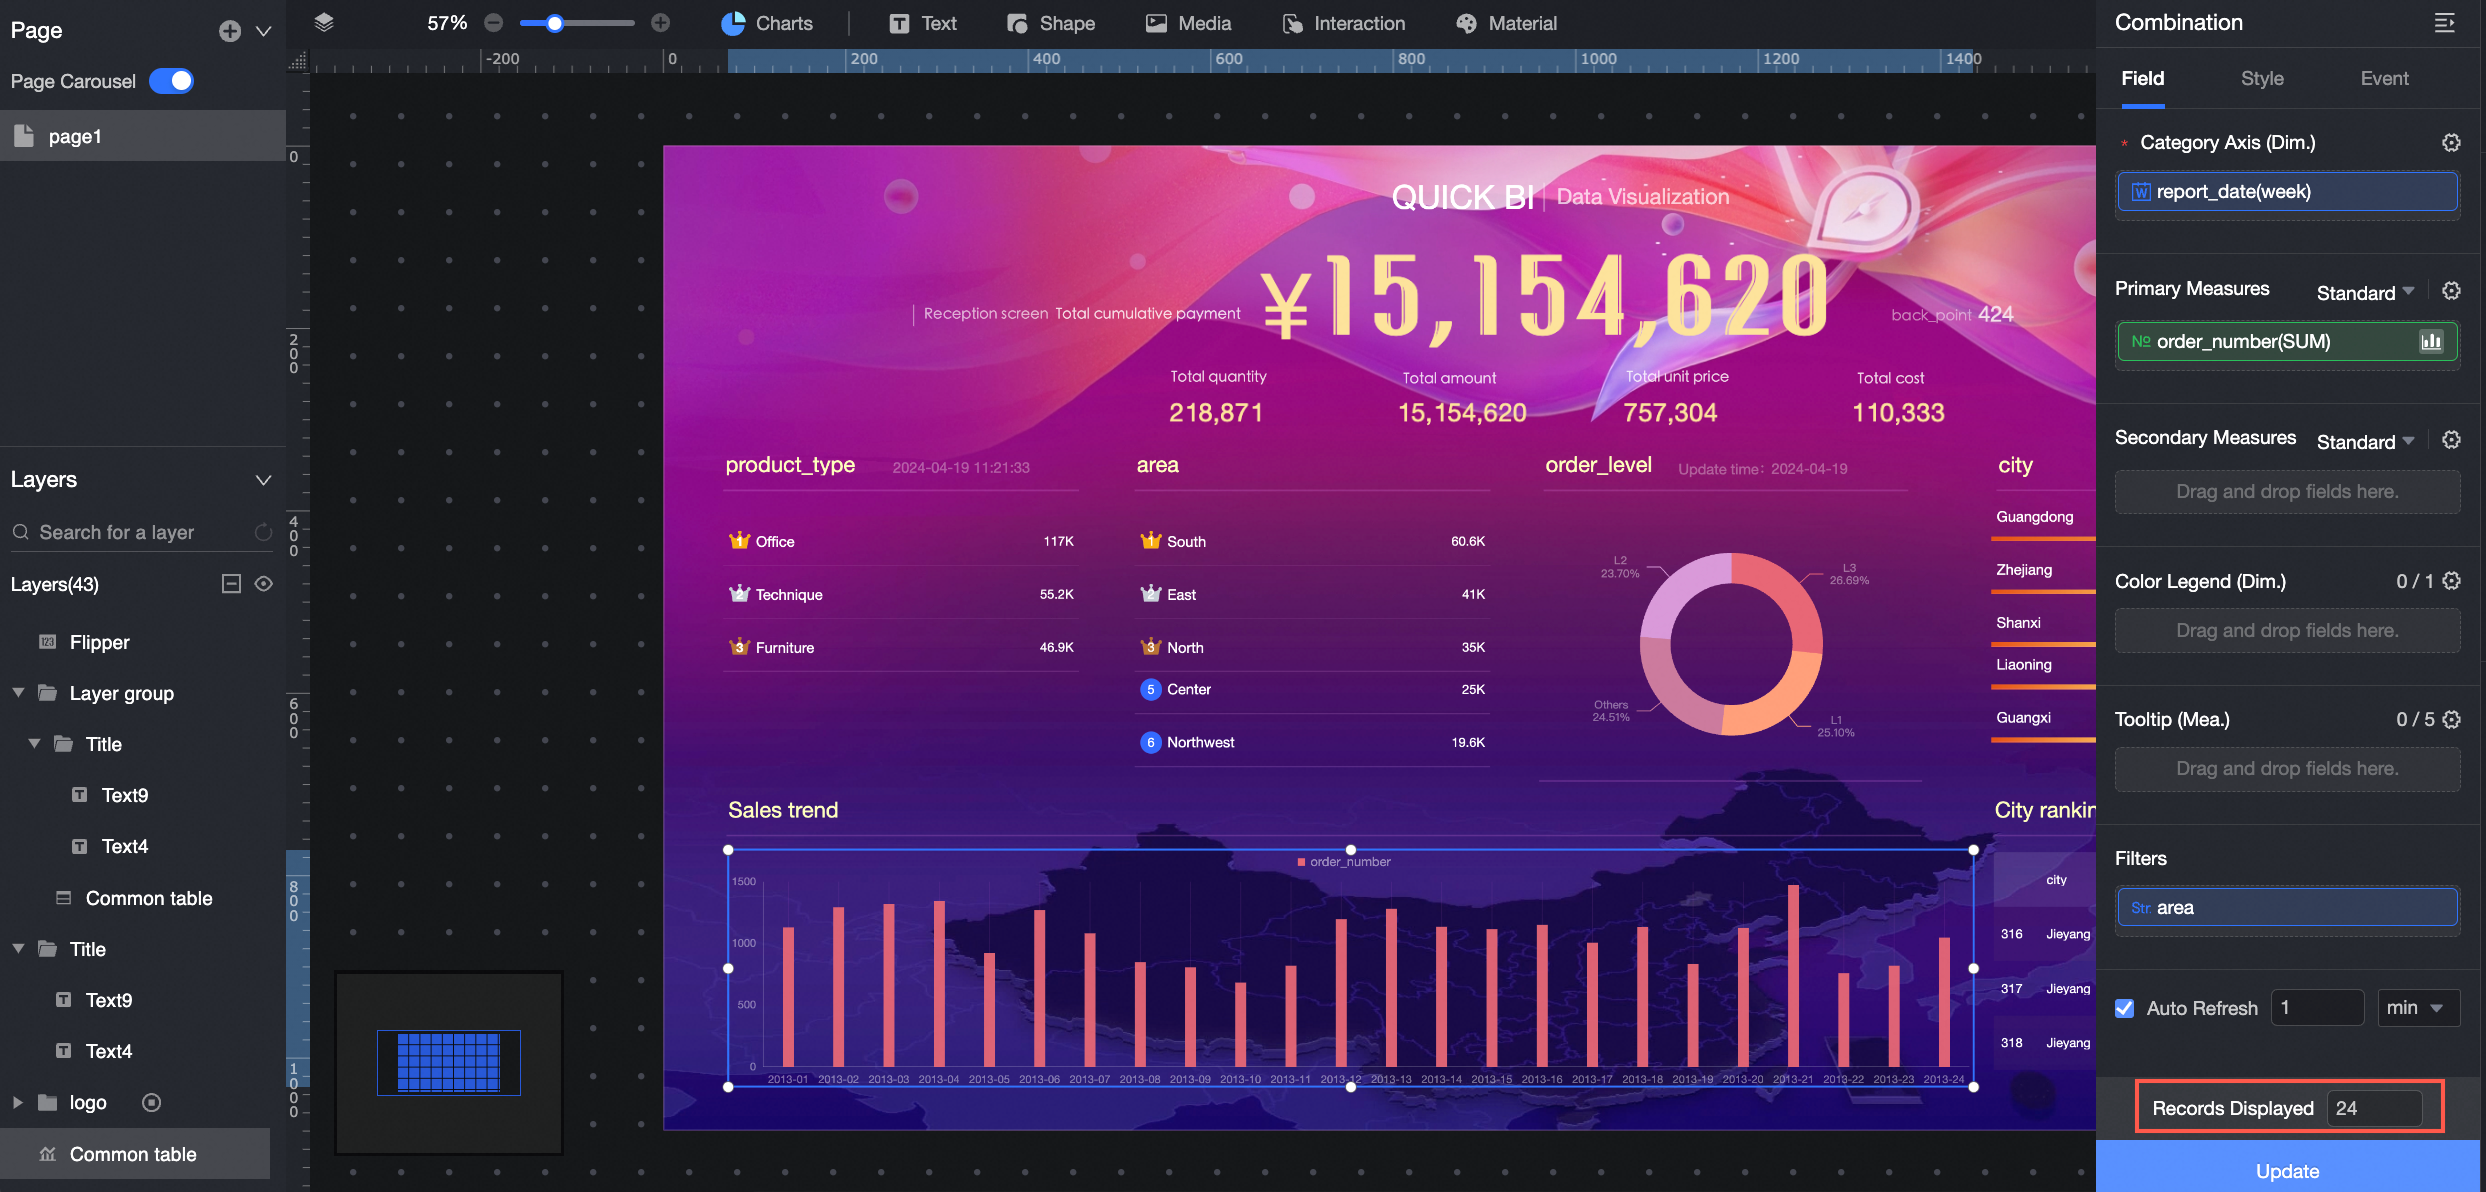
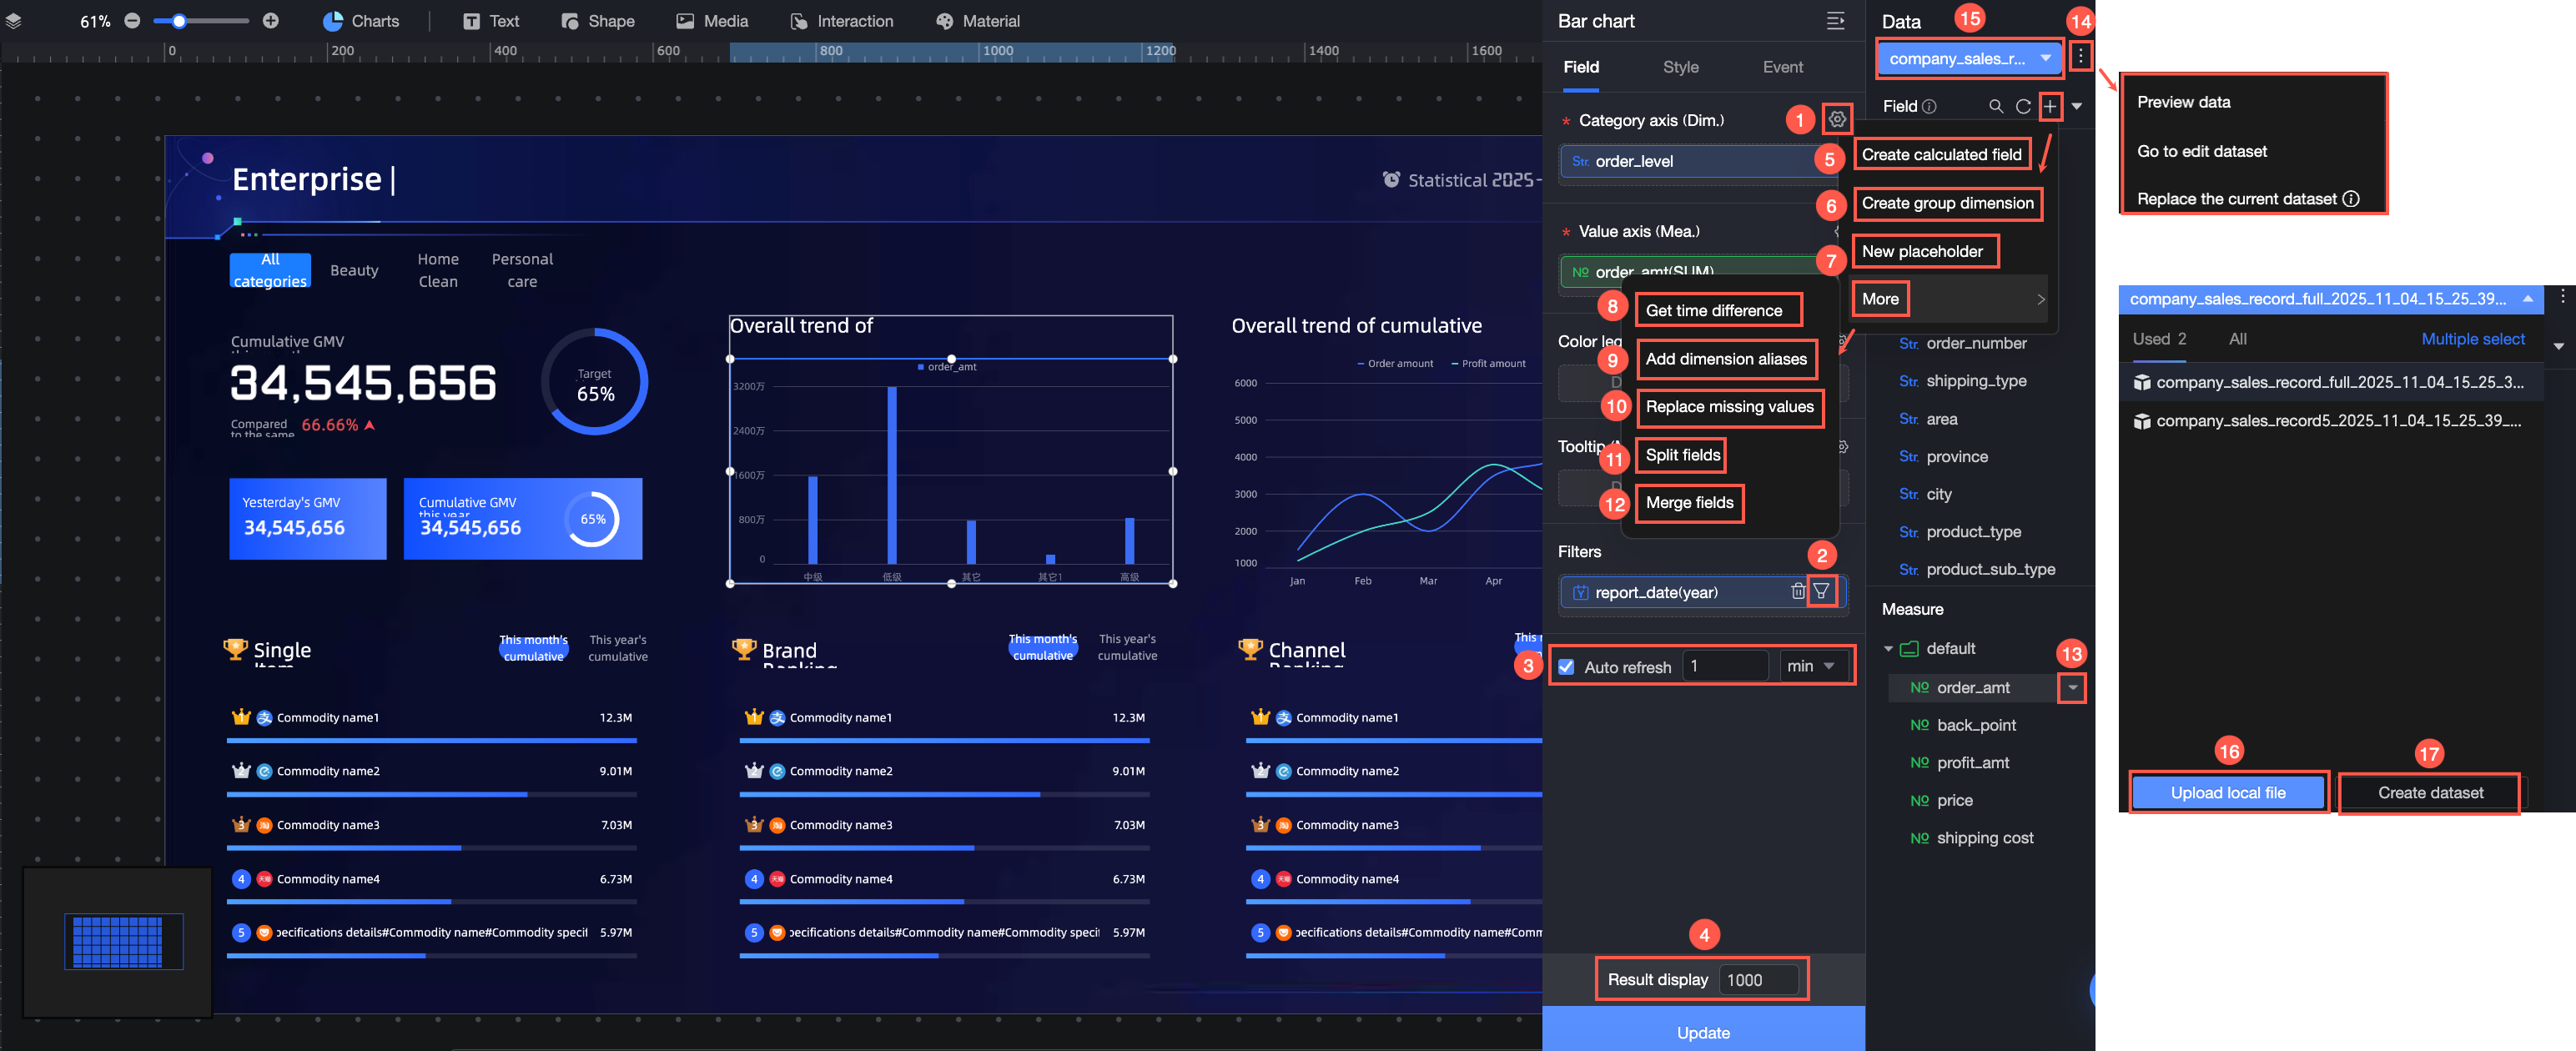
Create Calculated Field
-
A new calculated field applies only to the current chart and is not saved to the dataset. It will not be available if you create another chart, even with the same dataset.
-
However, if you copy a chart, its calculated fields are also copied and will be available in the new chart.
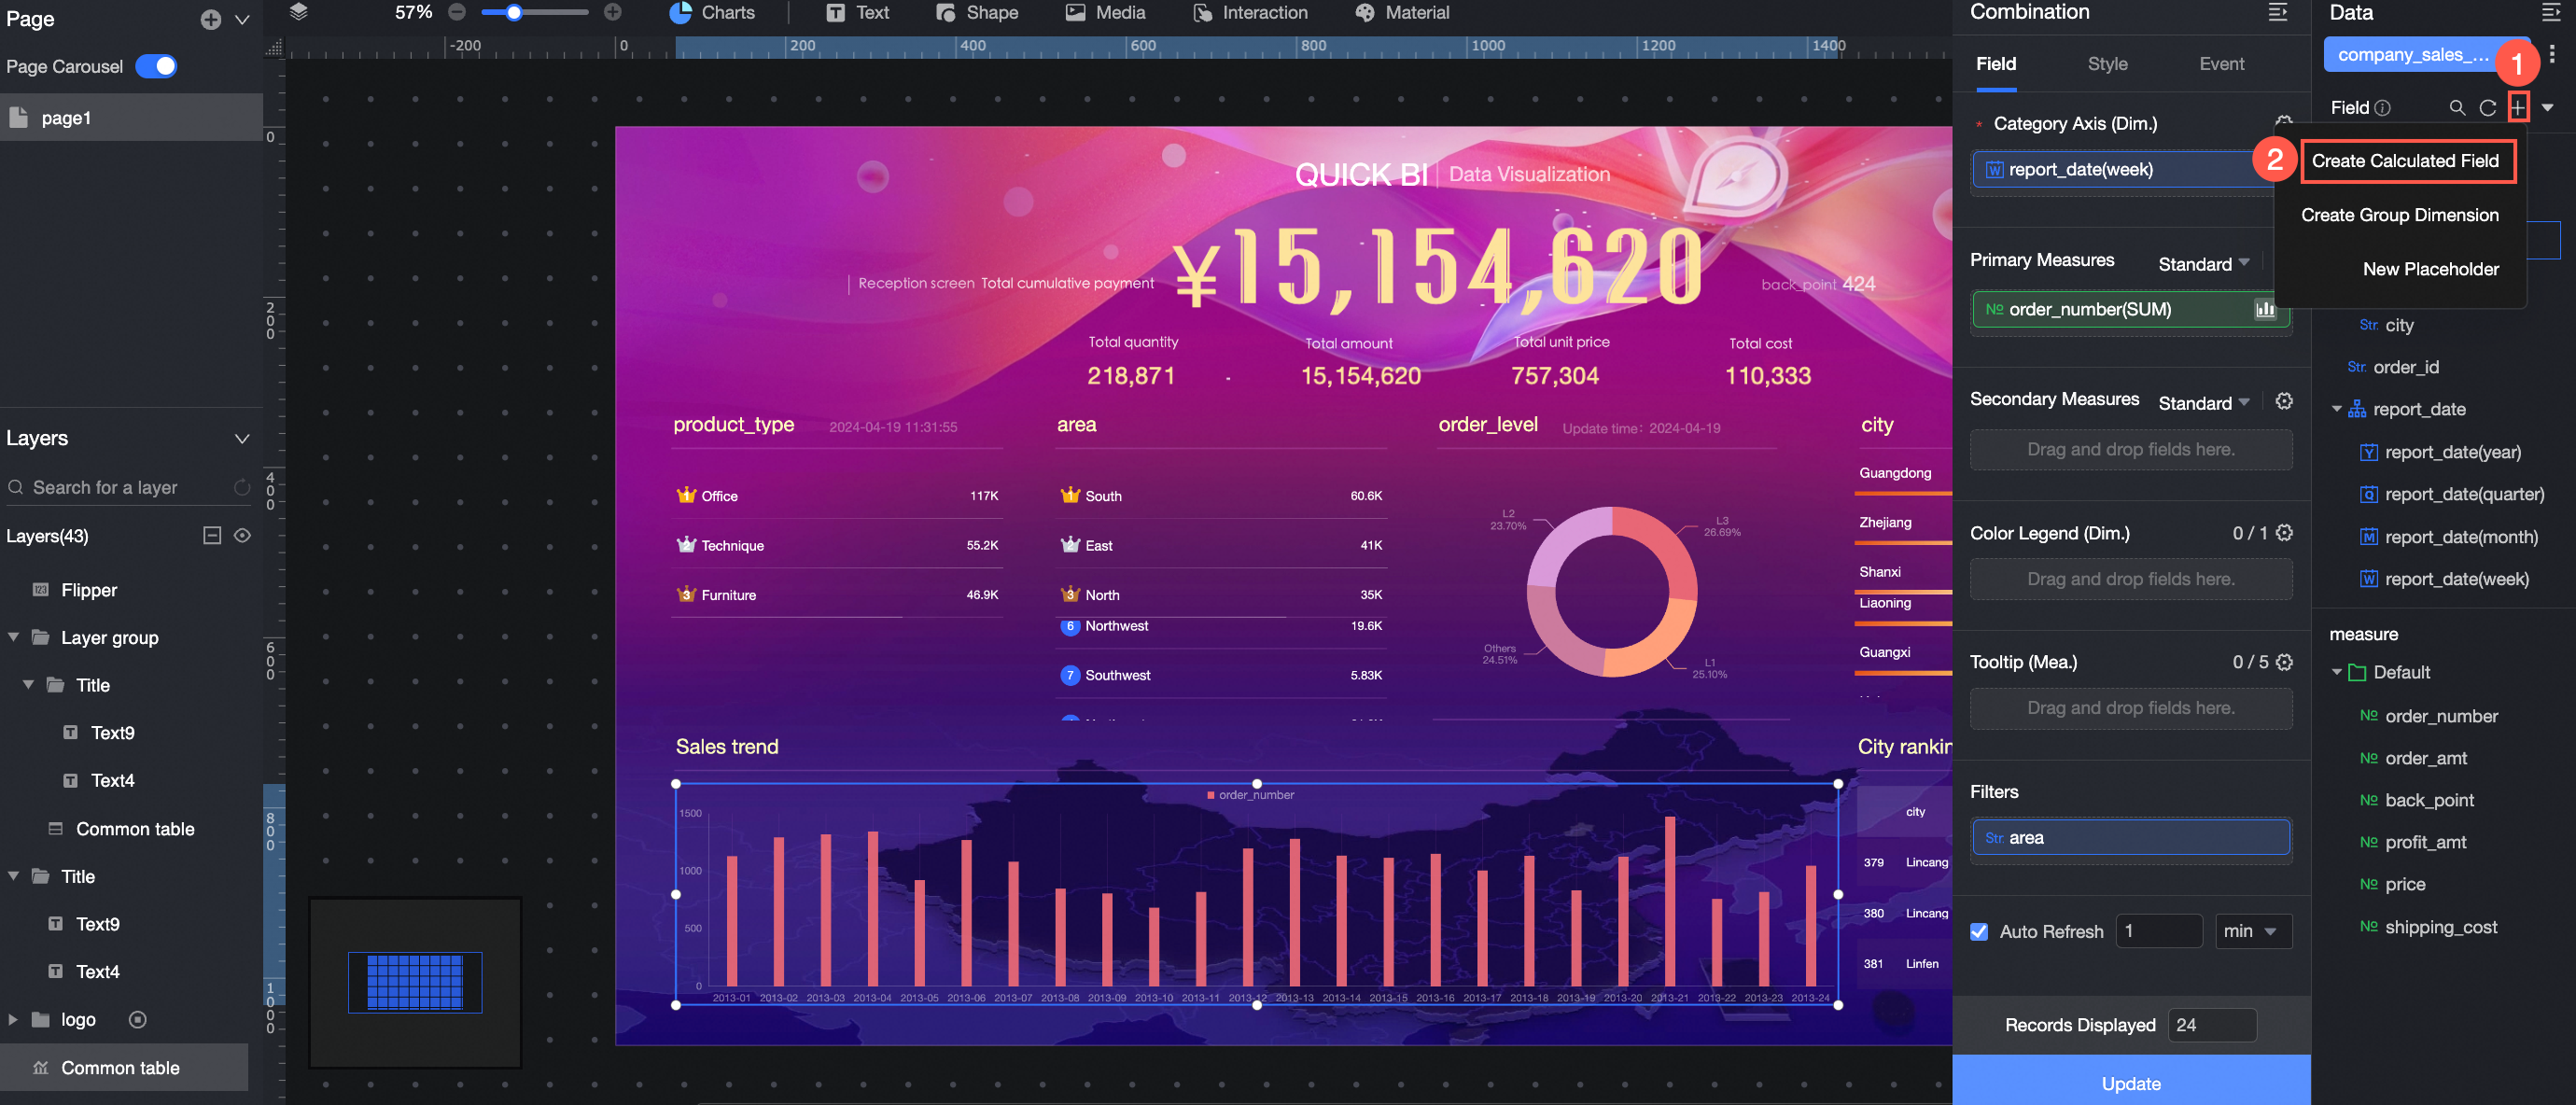
For detailed instructions, see Create a calculated field.
Create Grouping Dimension
-
A new grouping dimension applies only to the current chart and is not saved to the dataset. It will not be available if you create another chart, even with the same dataset.
-
However, if you copy a chart, its grouping dimensions are also copied and will be available in the new chart.
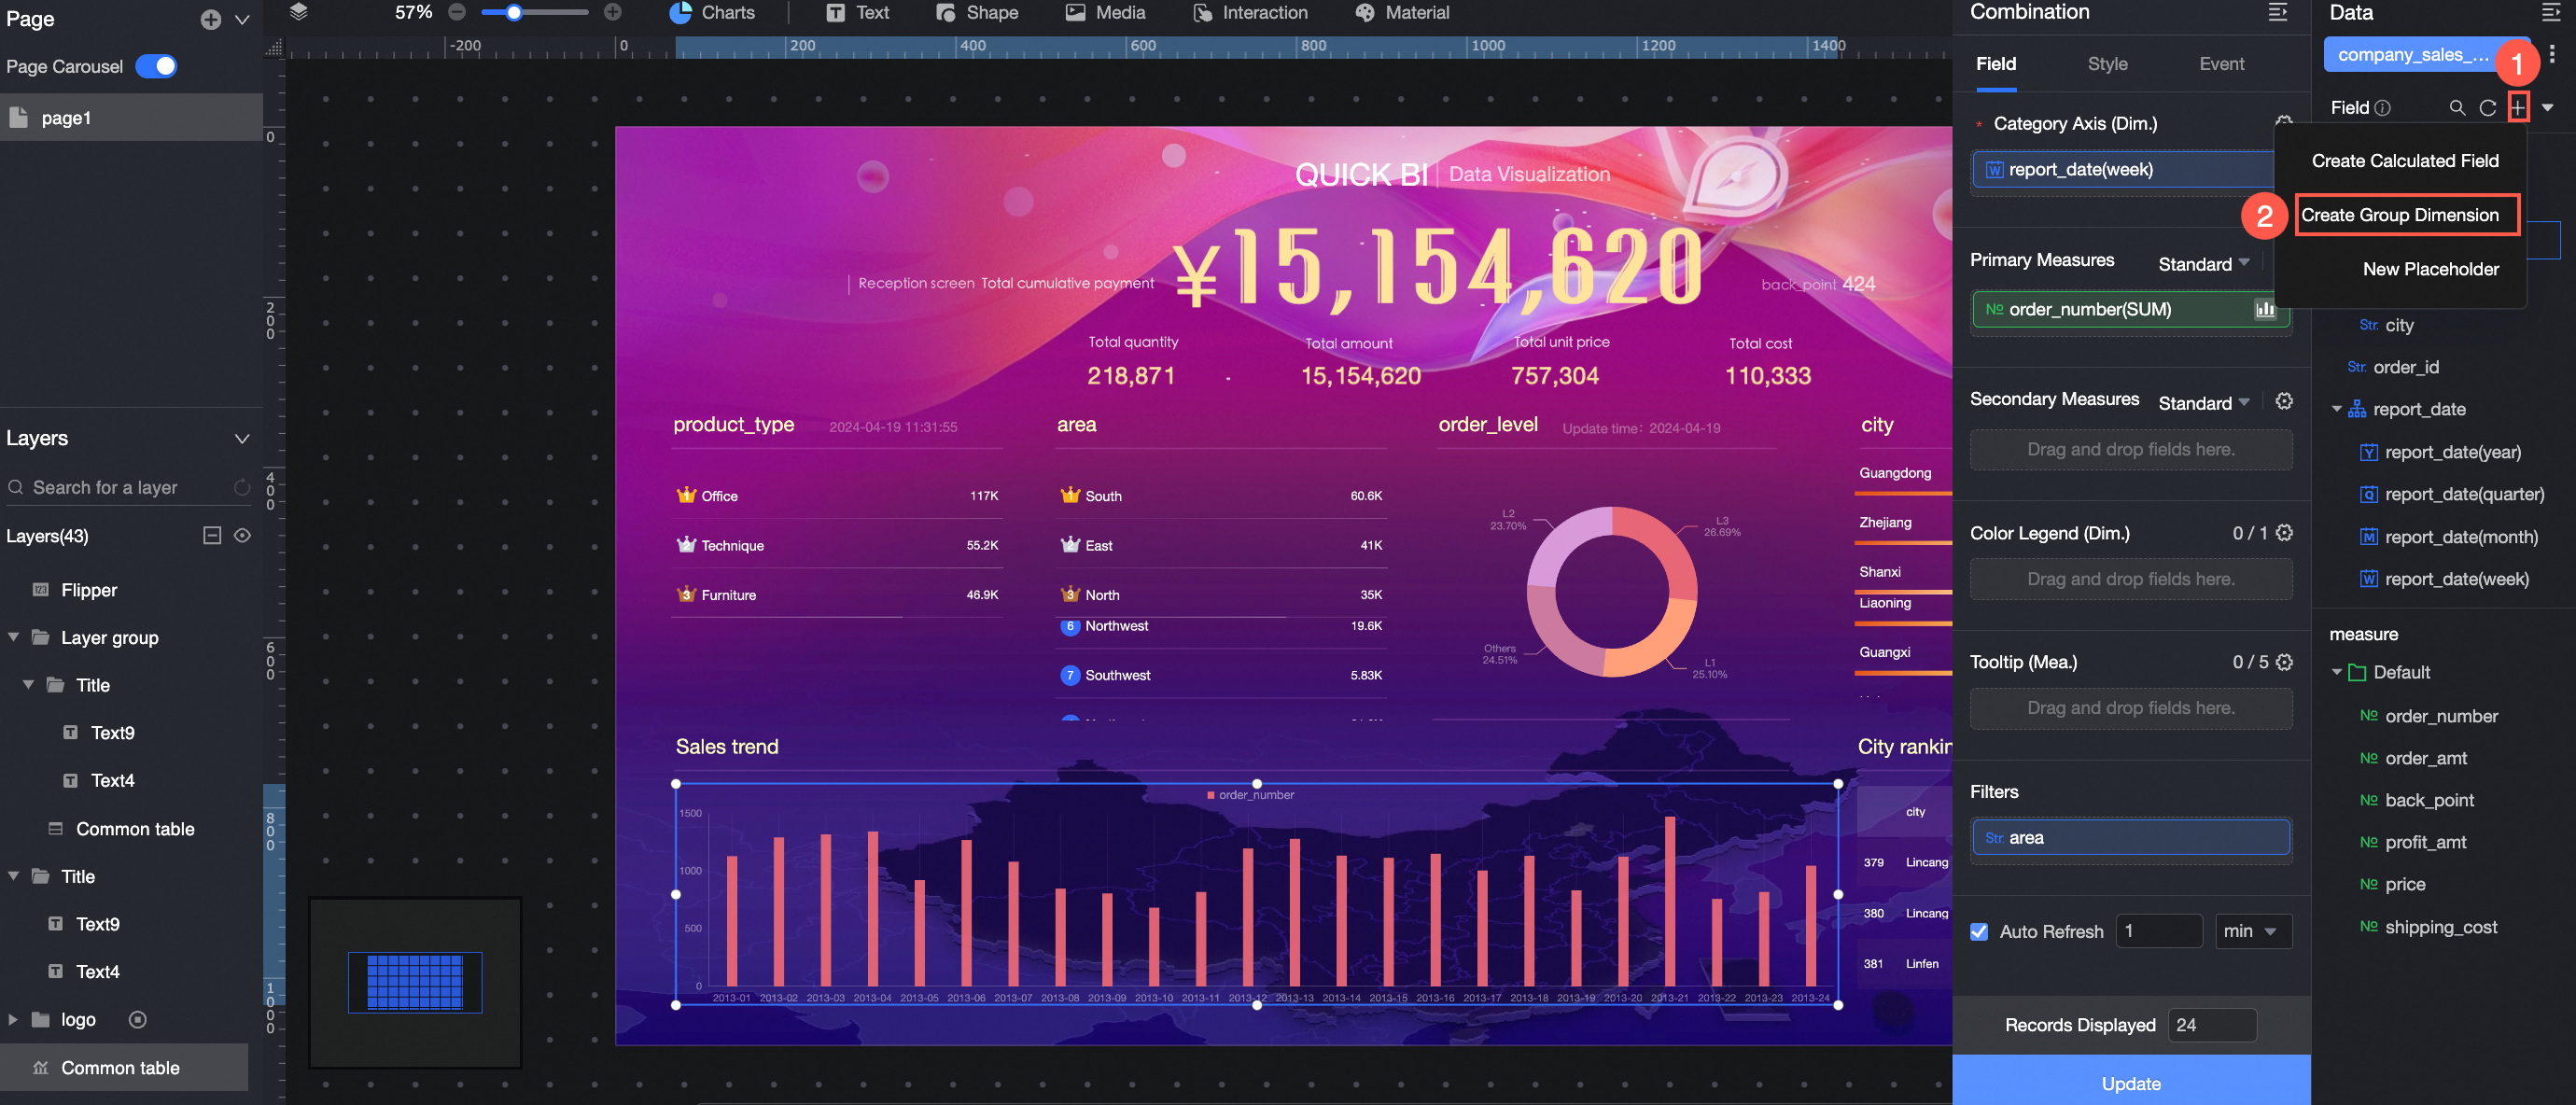
For detailed instructions, see Create a grouping dimension.
Create Placeholder
Click Create Placeholder to add a placeholder with a manually entered value.
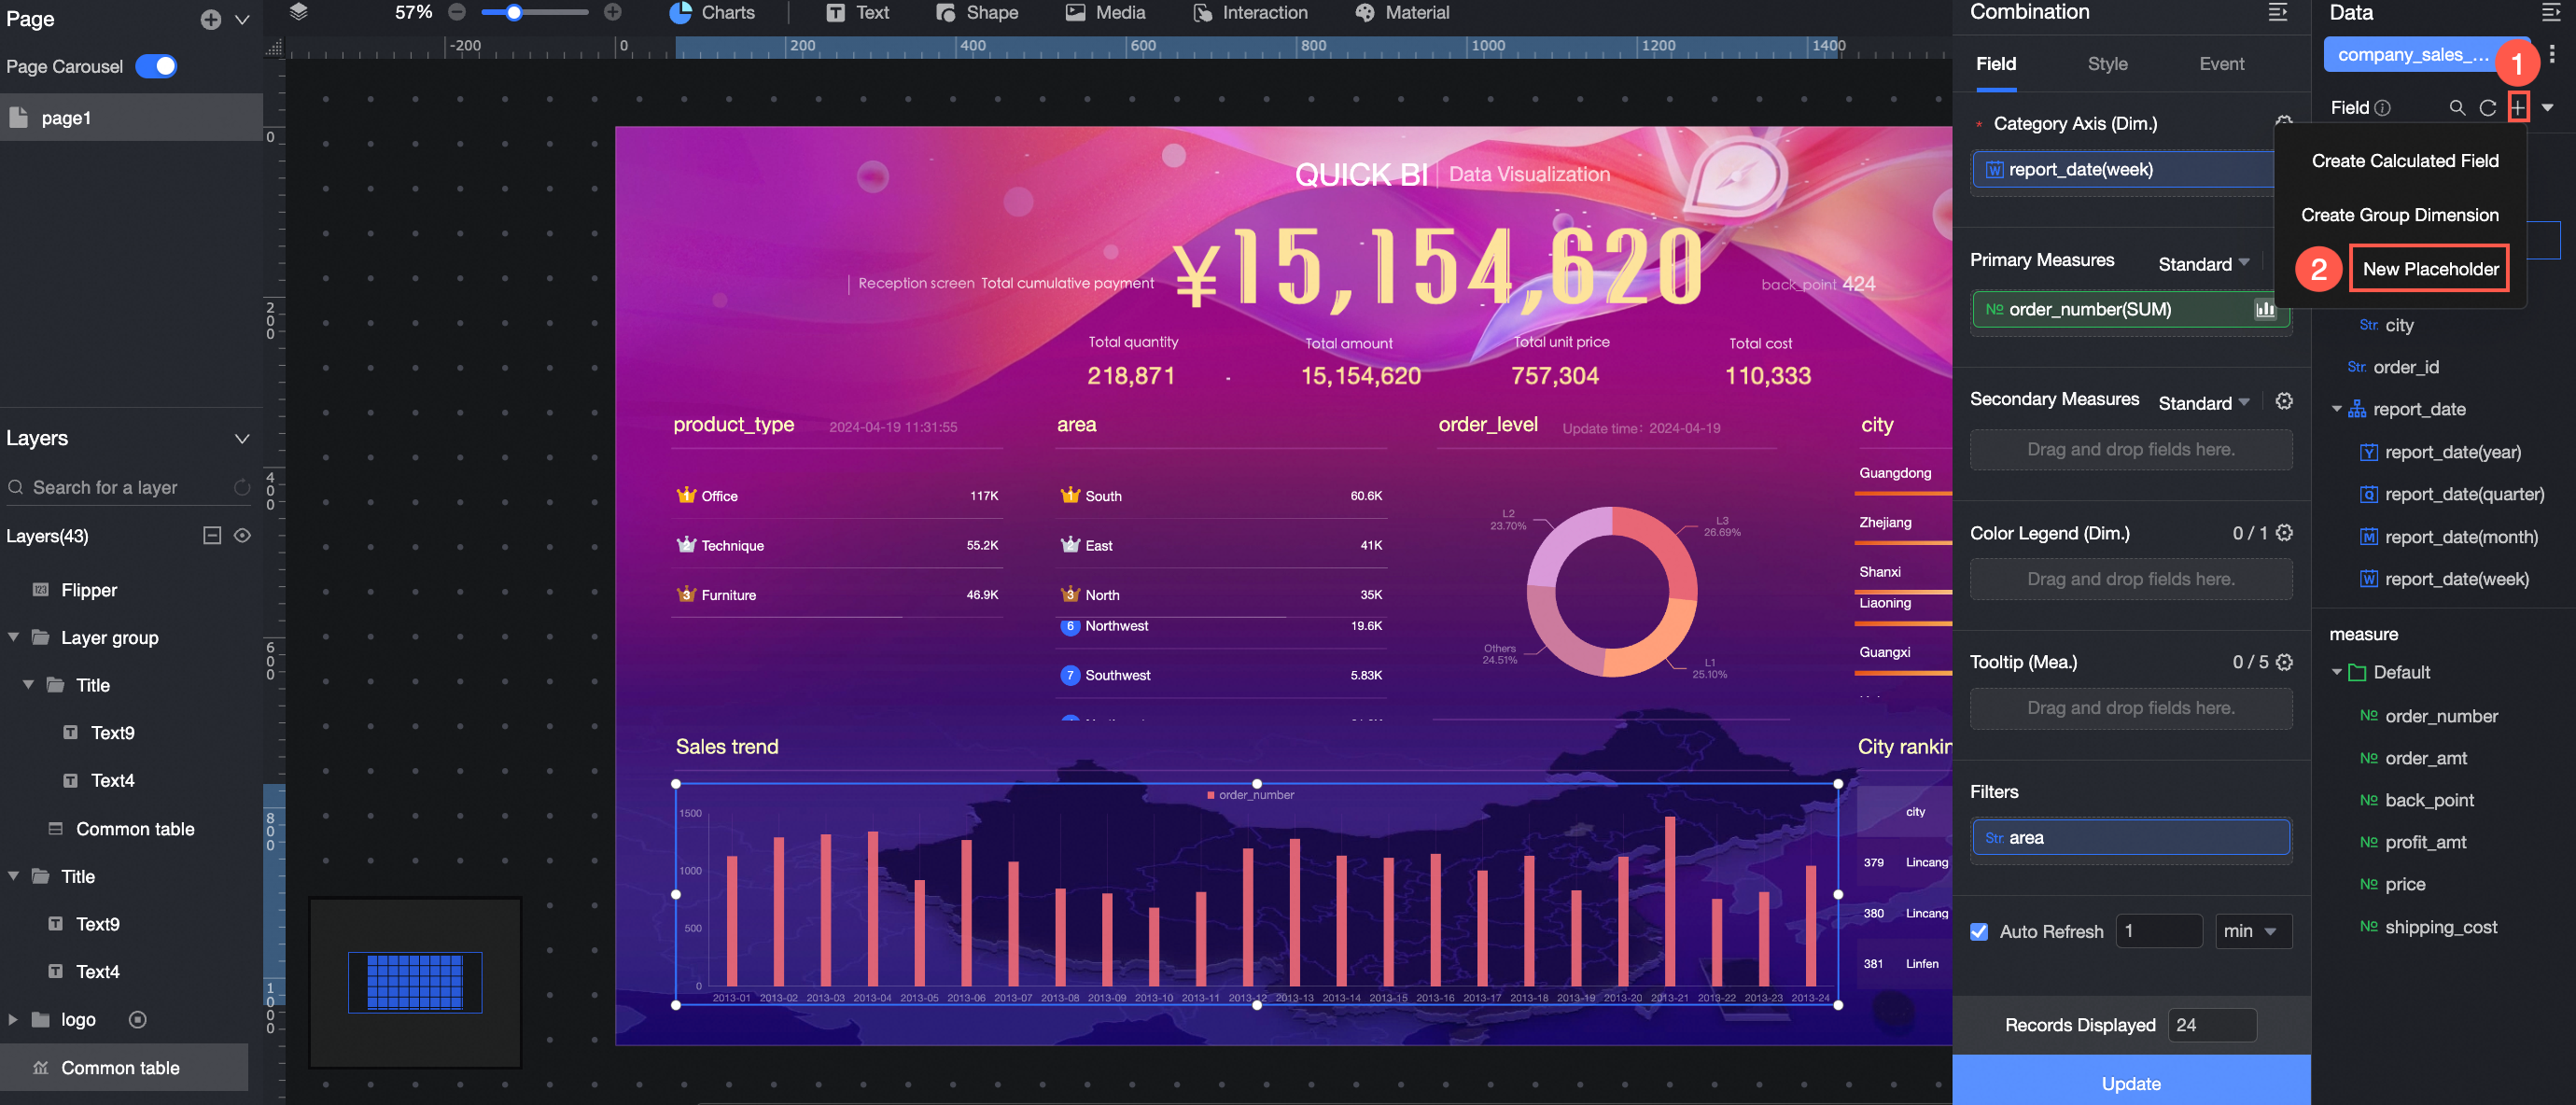
For detailed instructions, see Placeholders.
Calculate Time Difference
Calculates the time difference between two date fields and returns a number. Only complete time units are counted.
Calculated fields are not supported.

For detailed instructions, see Calculate time difference.
Add Dimension Value Alias
Create new aliases for the values of a text field.
-
You can add a dimension value alias only for a text field.
-
This operation is supported for a maximum of 50 dimension values.
-
Calculated fields are not supported.
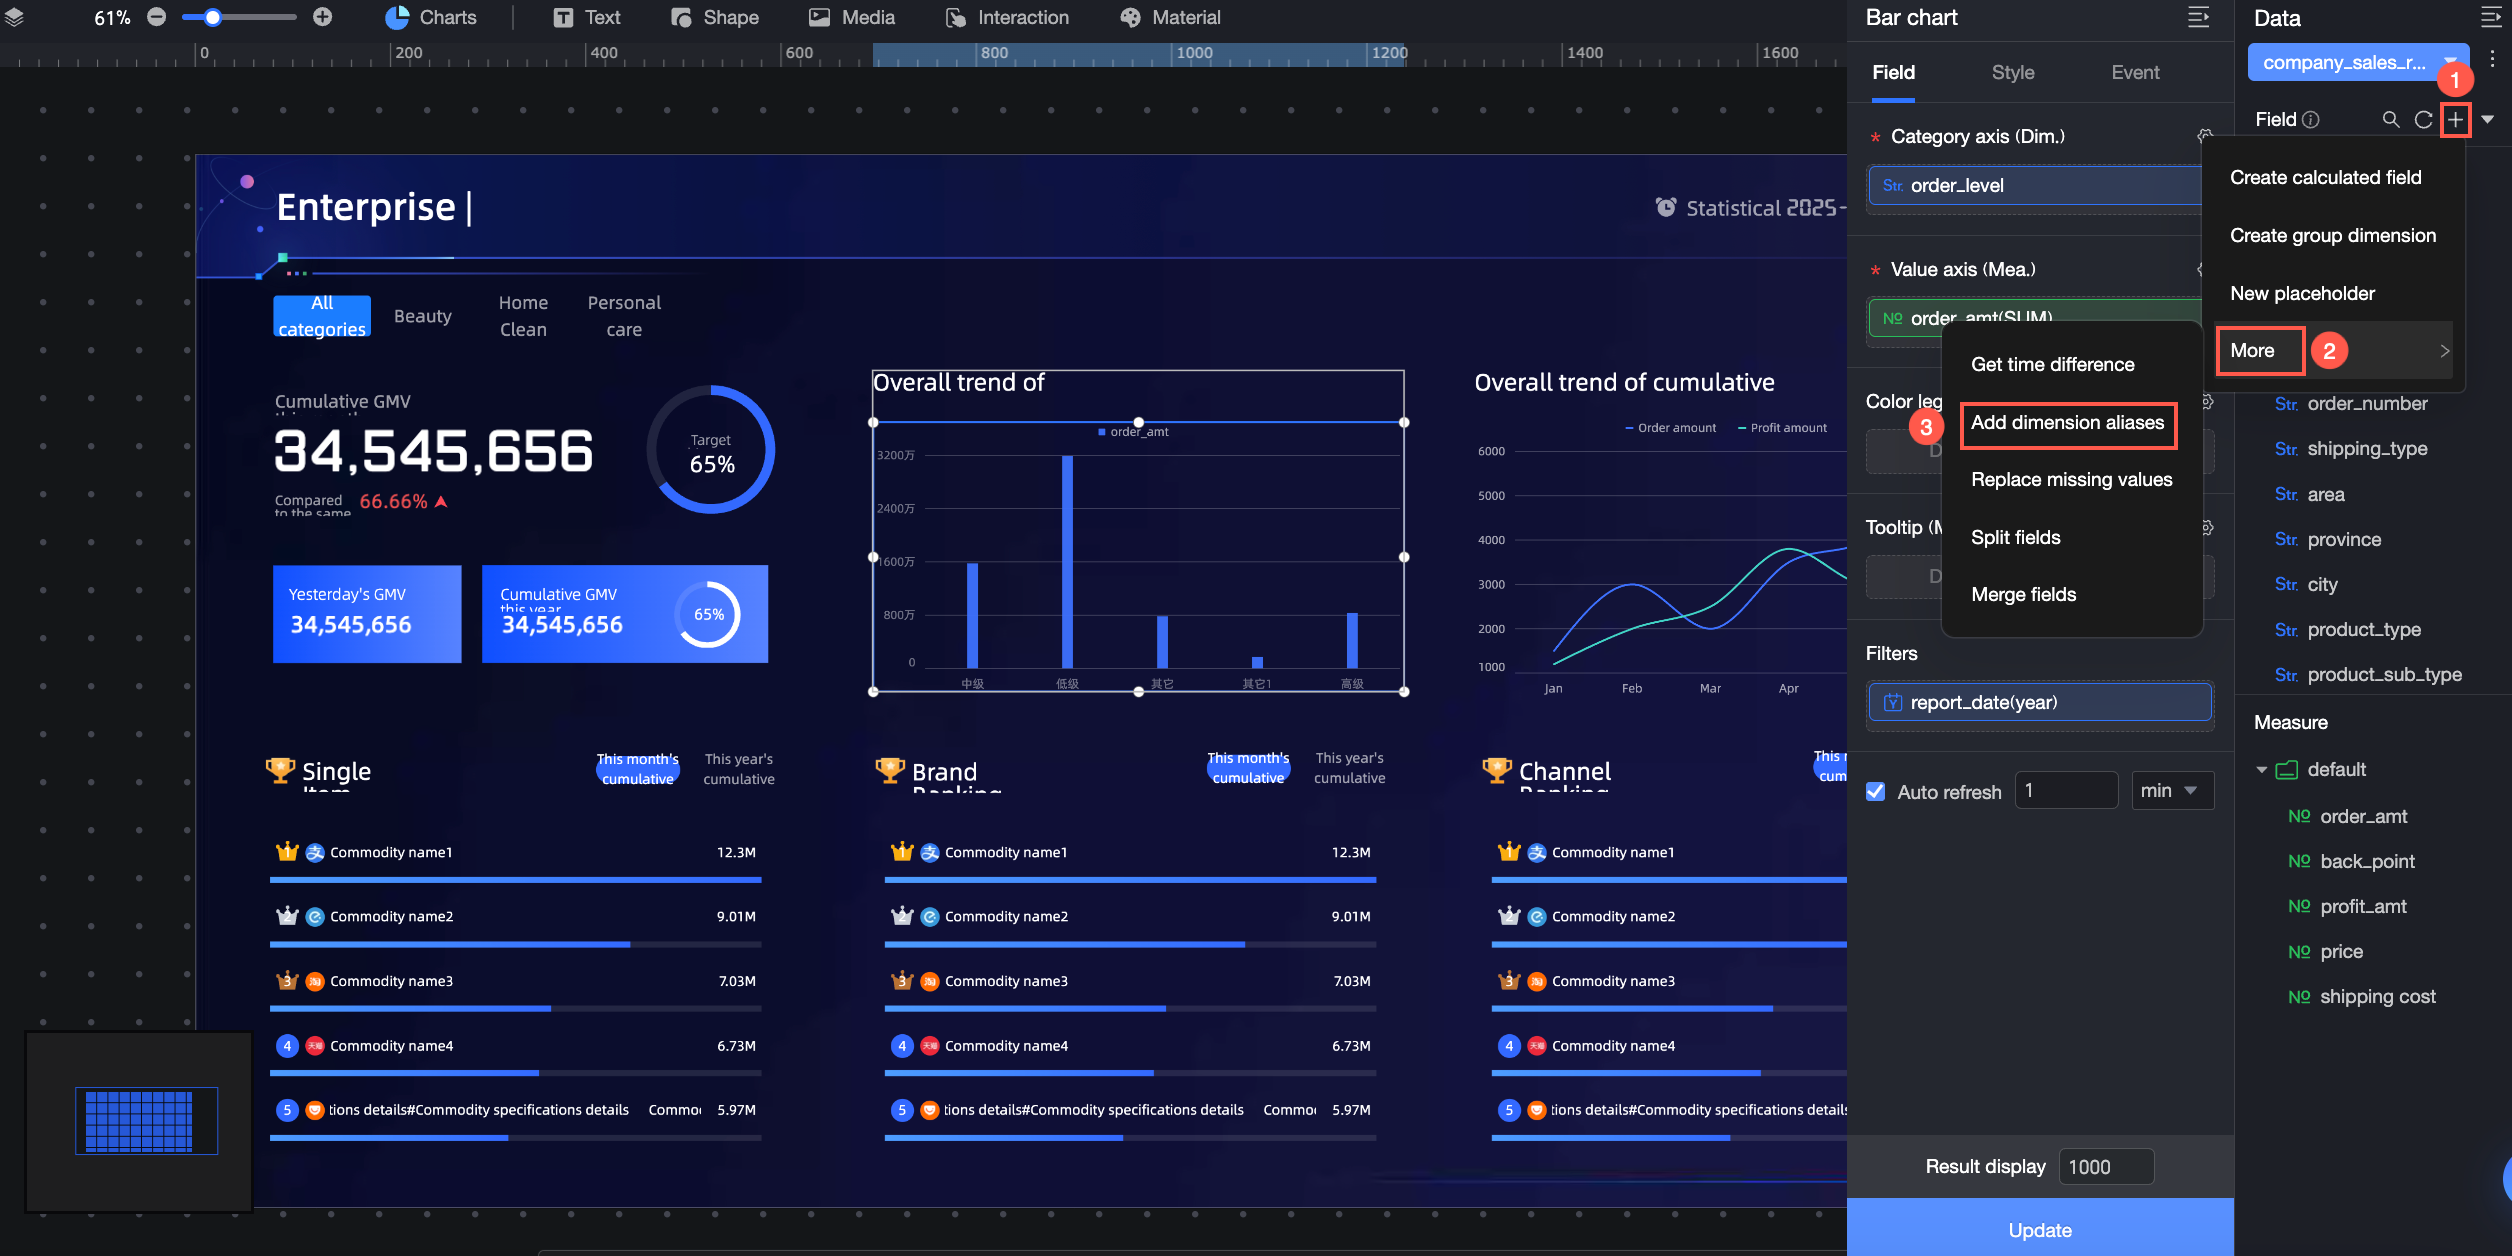
For detailed instructions, see Add a dimension value alias.
Replace Missing Values
Replace a null value or an empty string with another value.
Calculated fields are not supported.
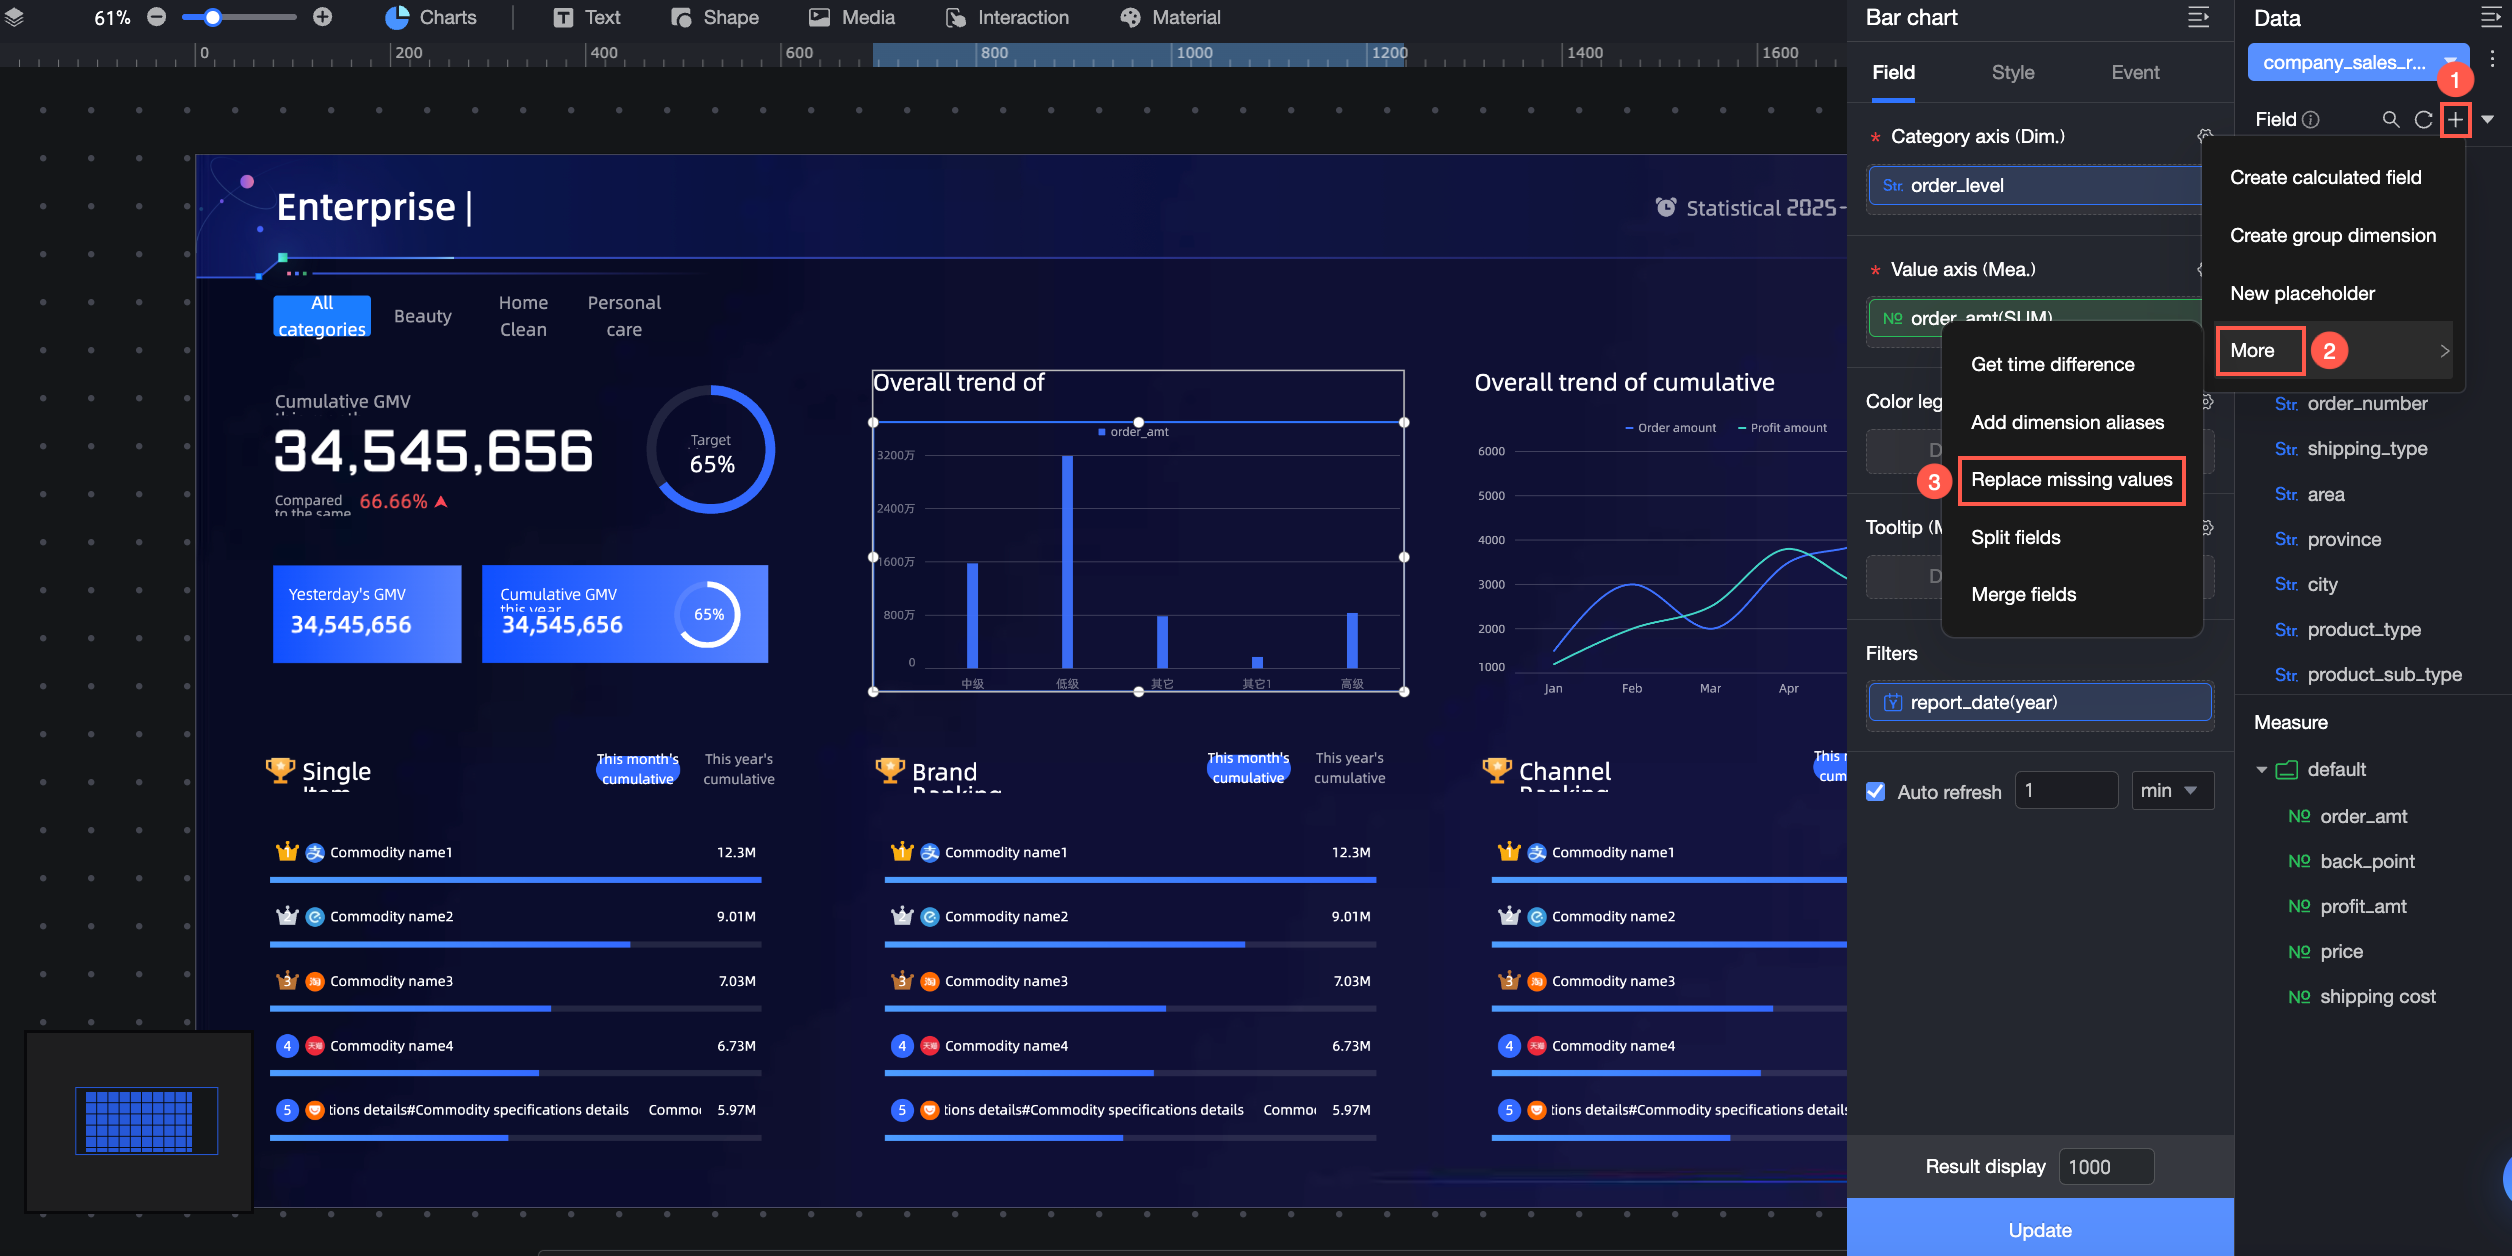
For detailed instructions, see Replace missing values.
Split Field
Split one text field into multiple fields based on a delimiter.
-
You can split only a text field.
-
Calculated fields are not supported.
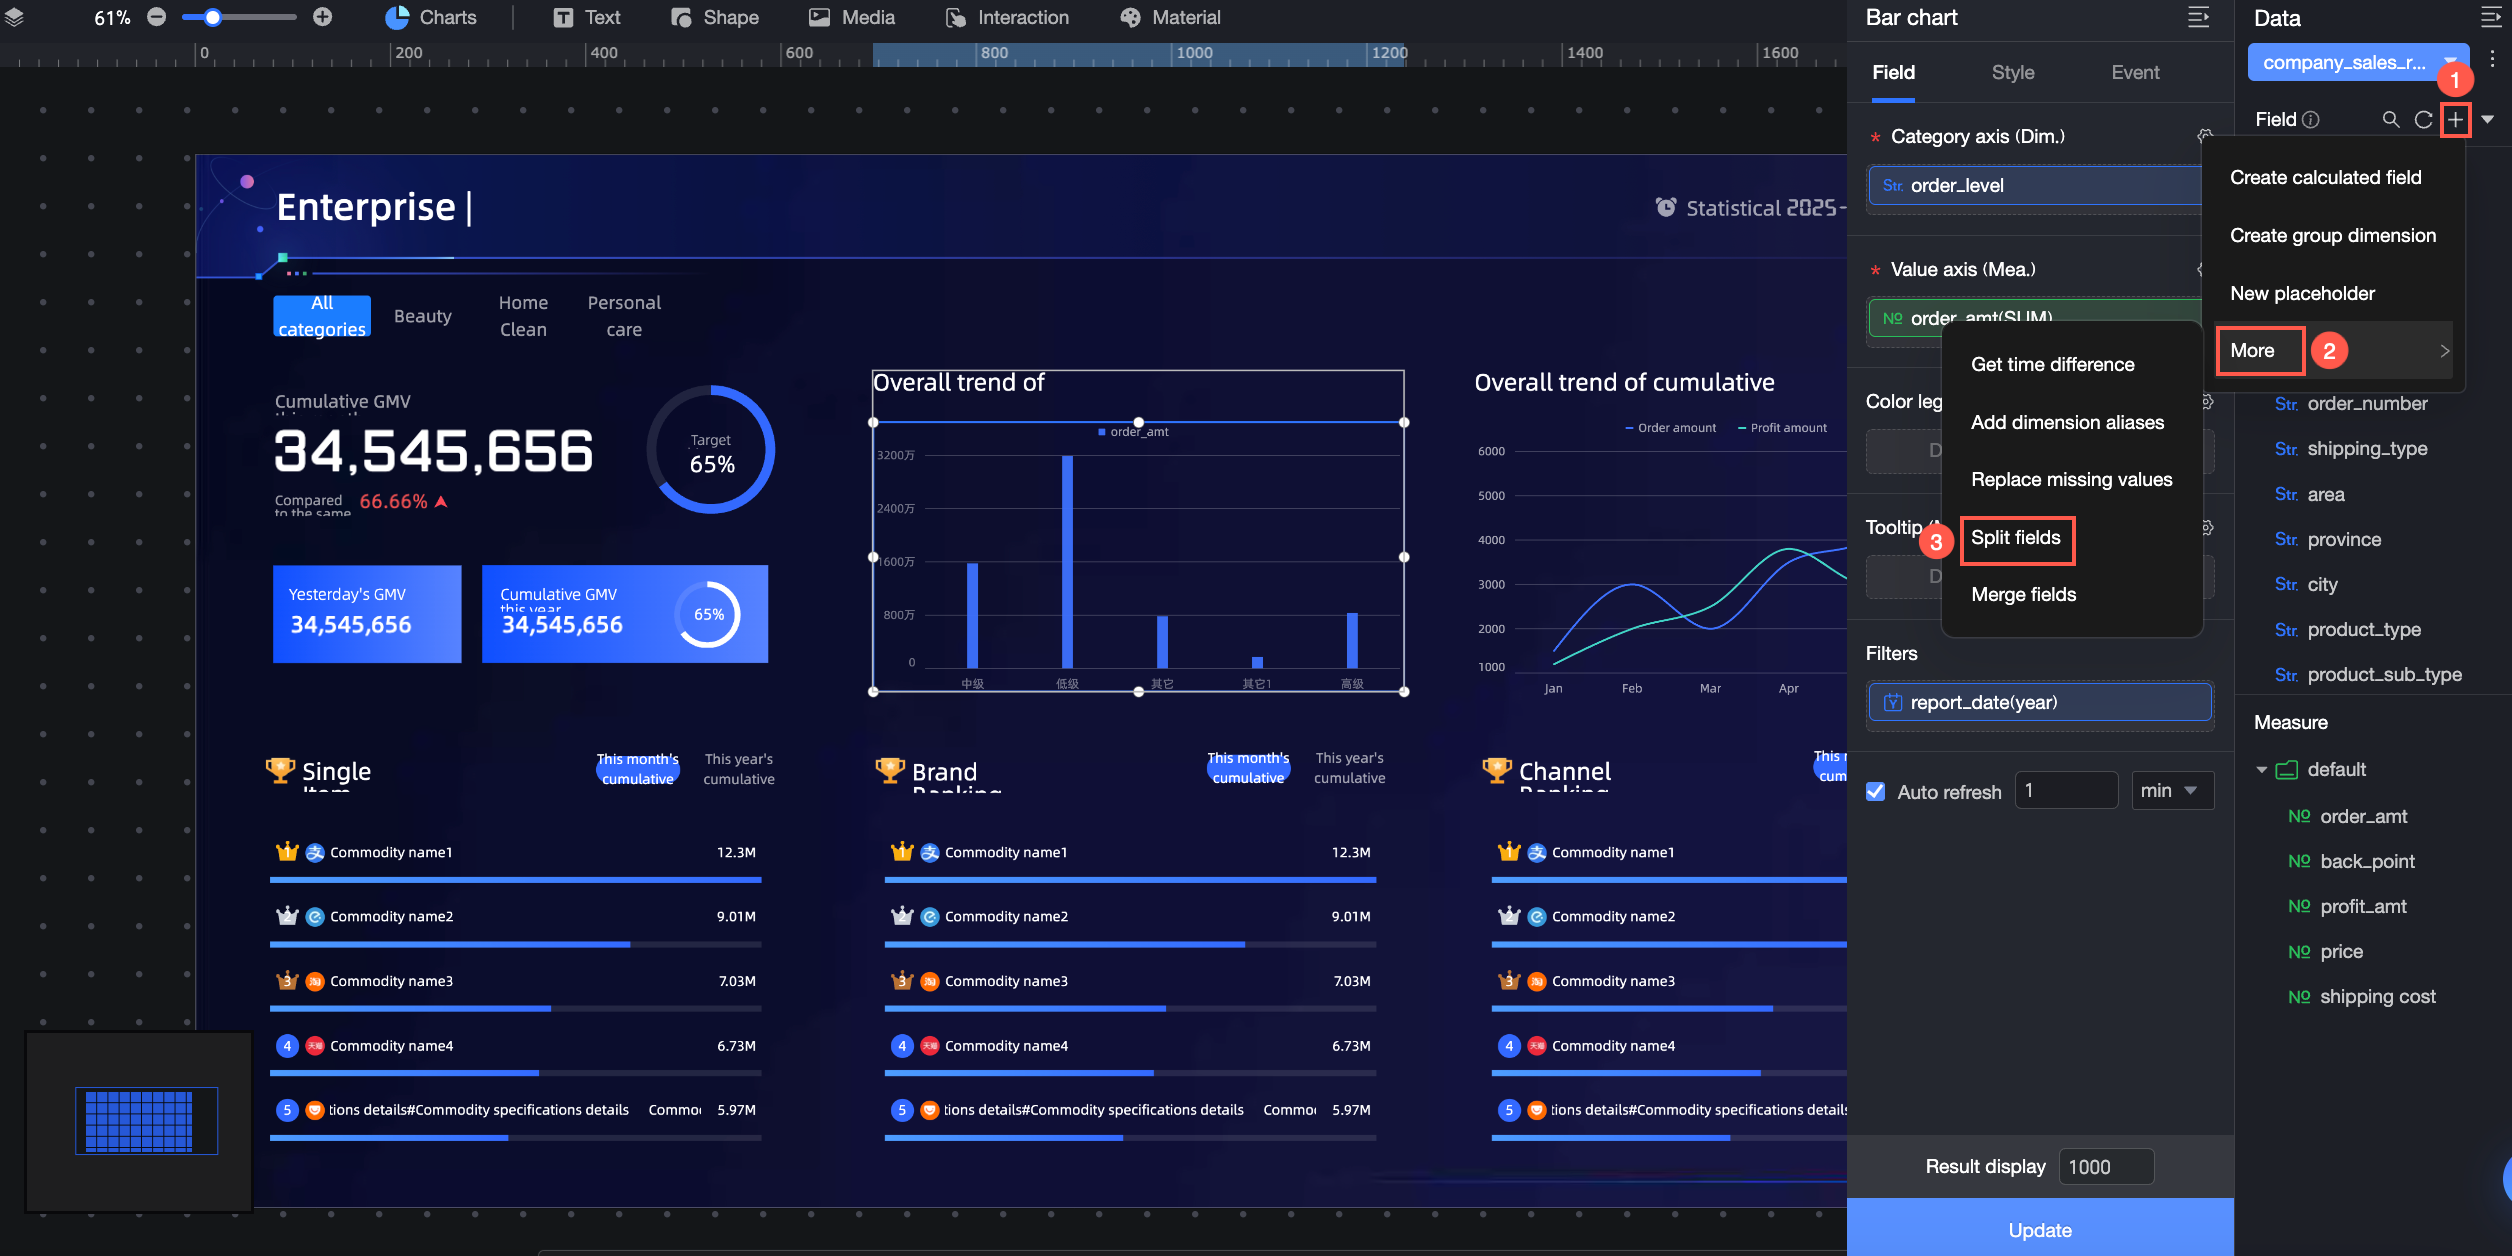
For detailed instructions, see Split a field.
Merge Fields
Combine multiple text fields into a single new field by using a separator.
-
You can merge up to 10 text fields.
-
Calculated fields are not supported.
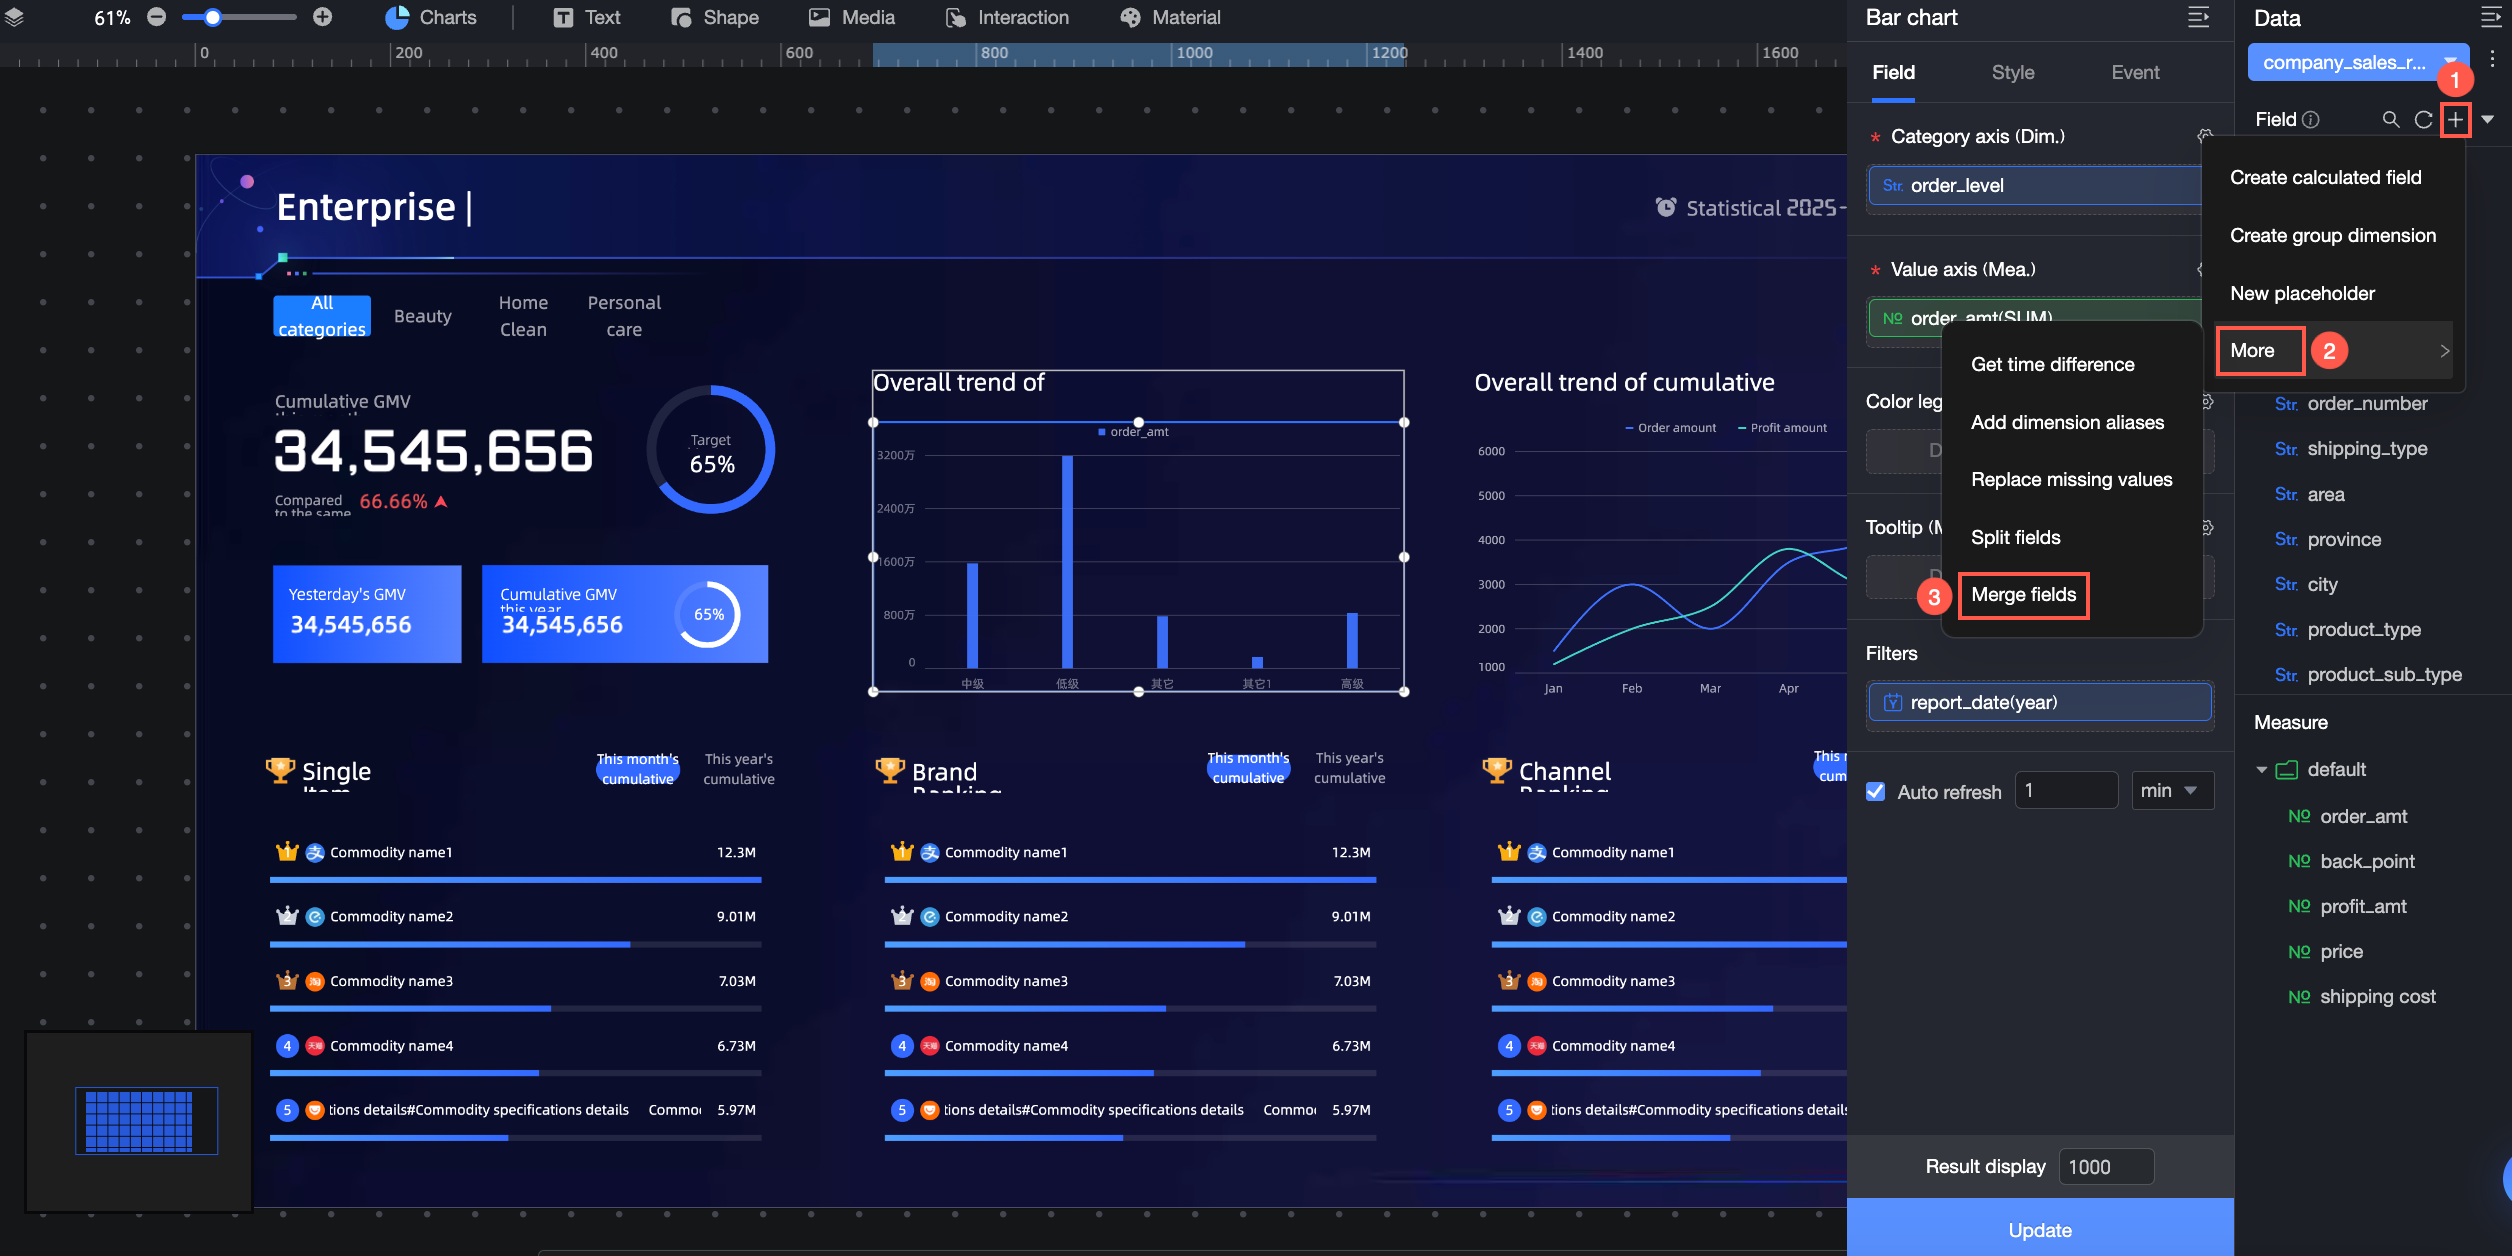 For detailed instructions, see Merge fields.
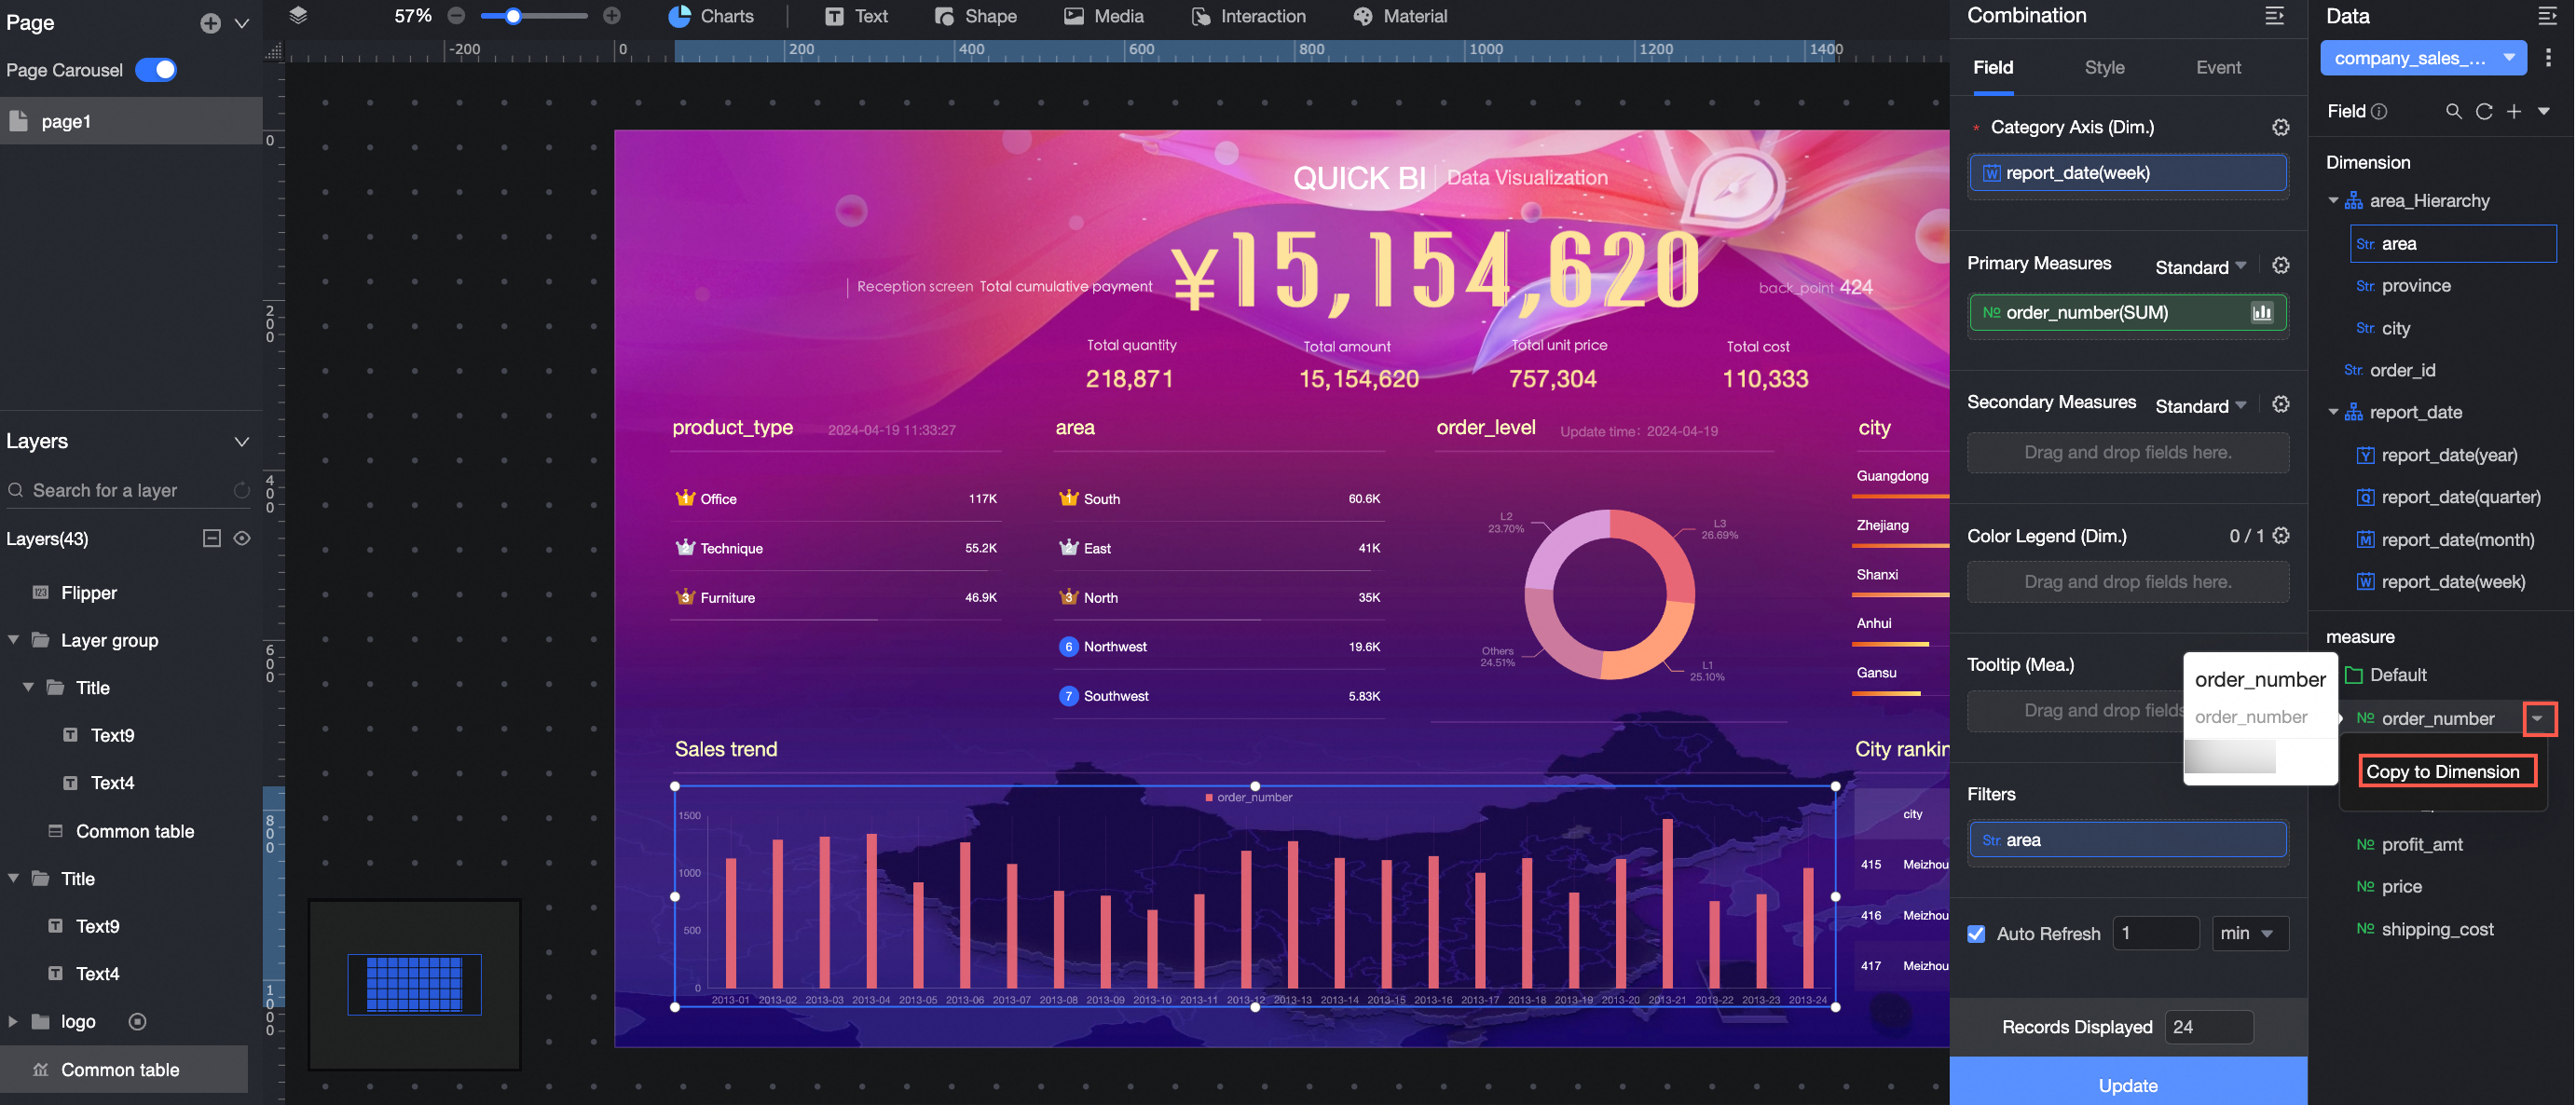
Copy to Dimension
-
A new dimension created this way applies only to the current chart and is not saved to the dataset. It will not be available if you create another chart, even with the same dataset.
-
However, if you copy a chart, these new dimensions are also copied and will be available in the new chart.
Edit Dataset
Click the ![]() icon to access dataset editing options, including Preview data, Edit dataset, and Replace current dataset.
icon to access dataset editing options, including Preview data, Edit dataset, and Replace current dataset.
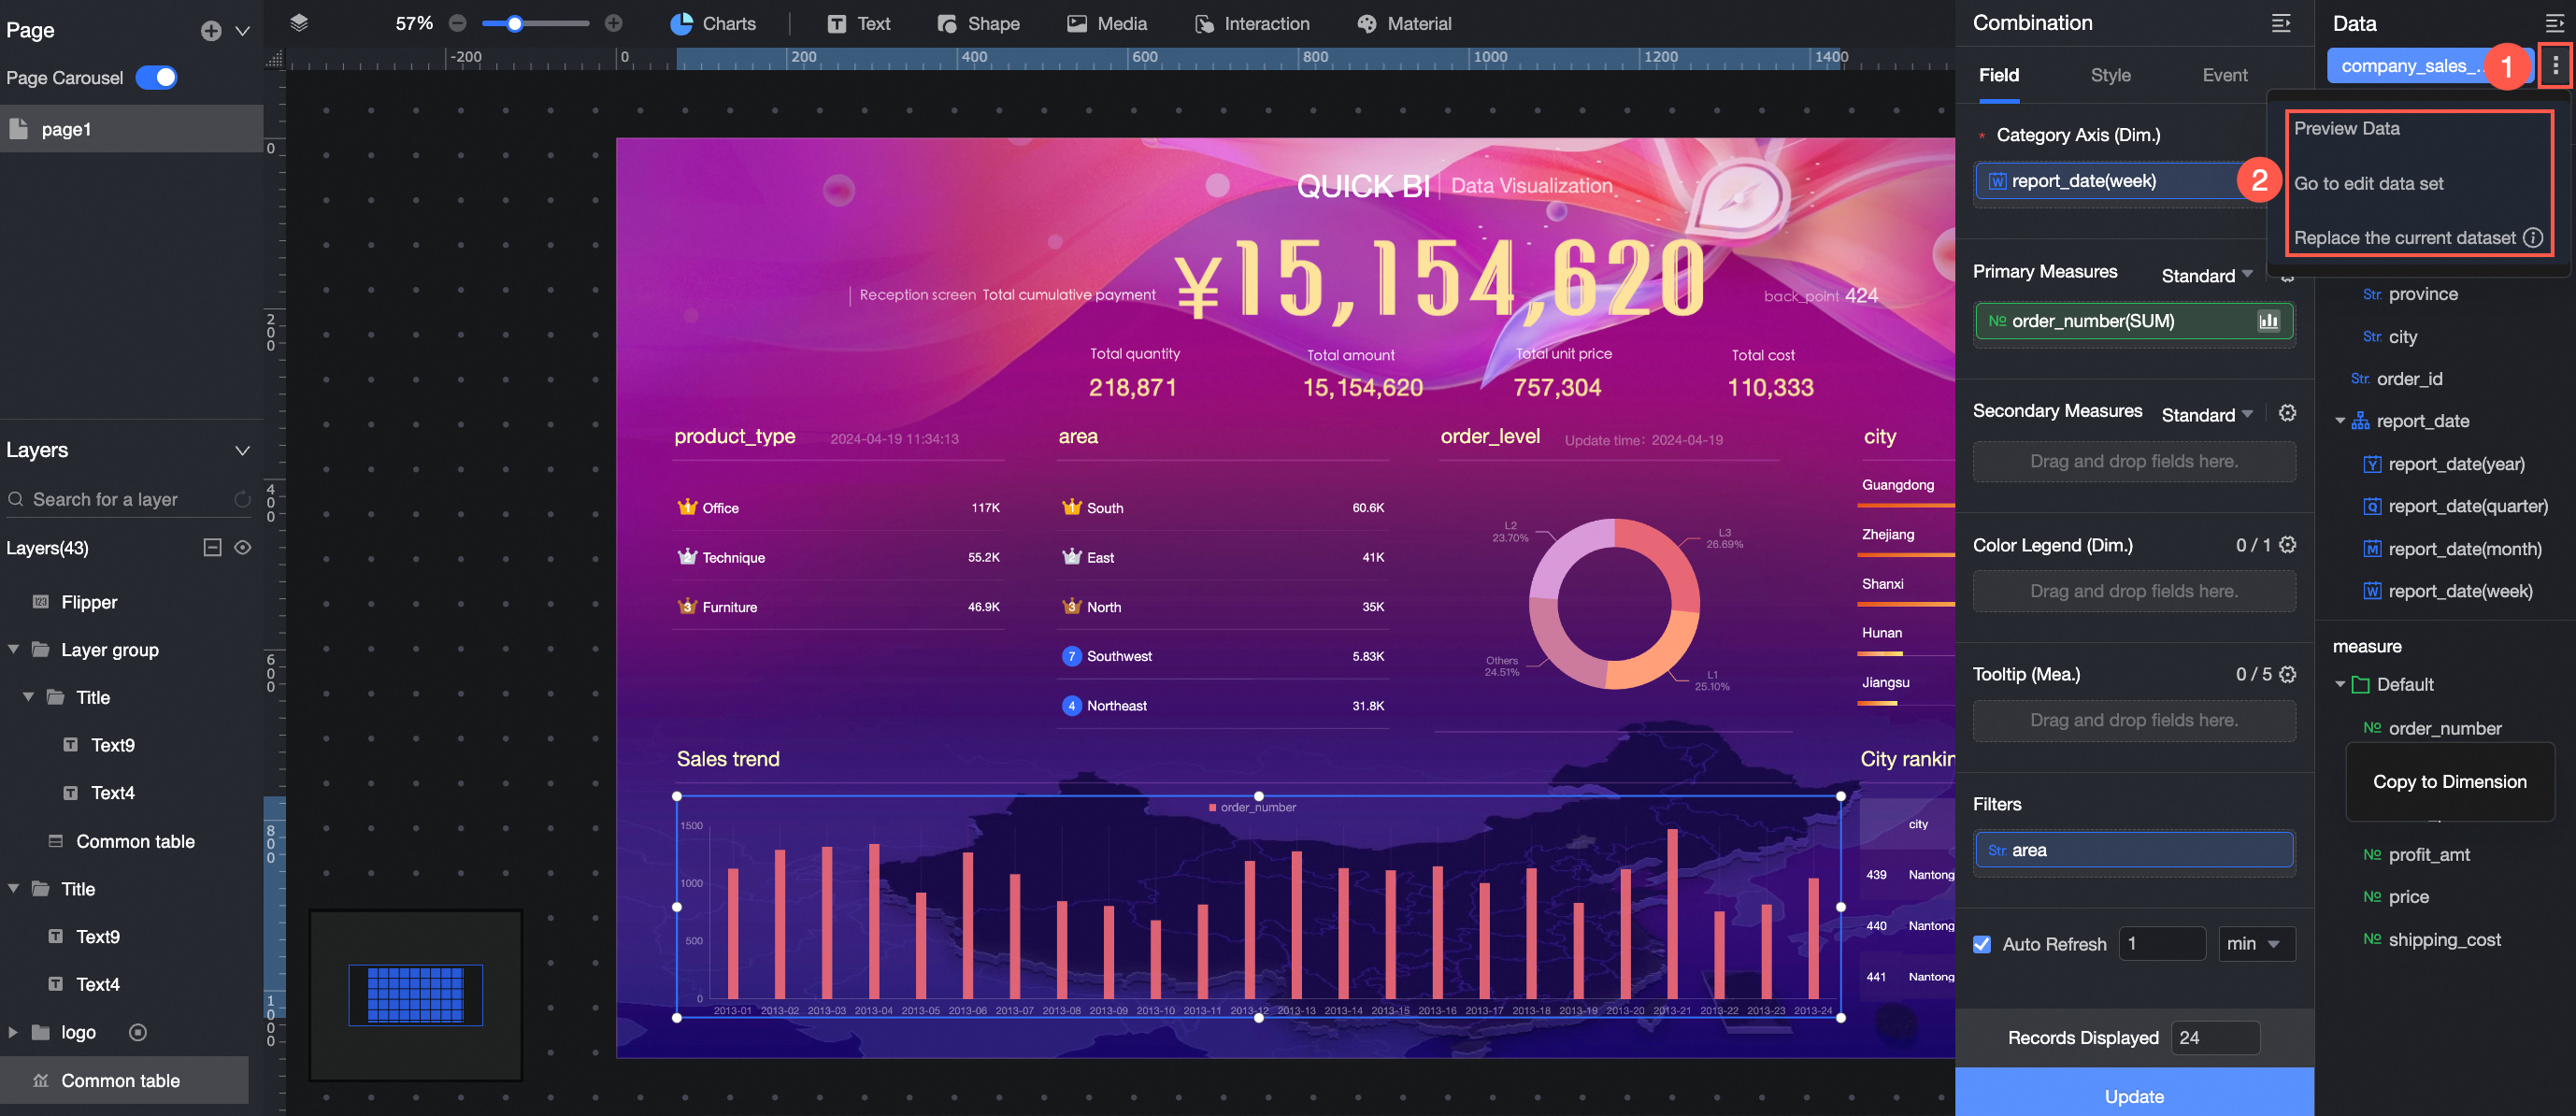
Preview Data
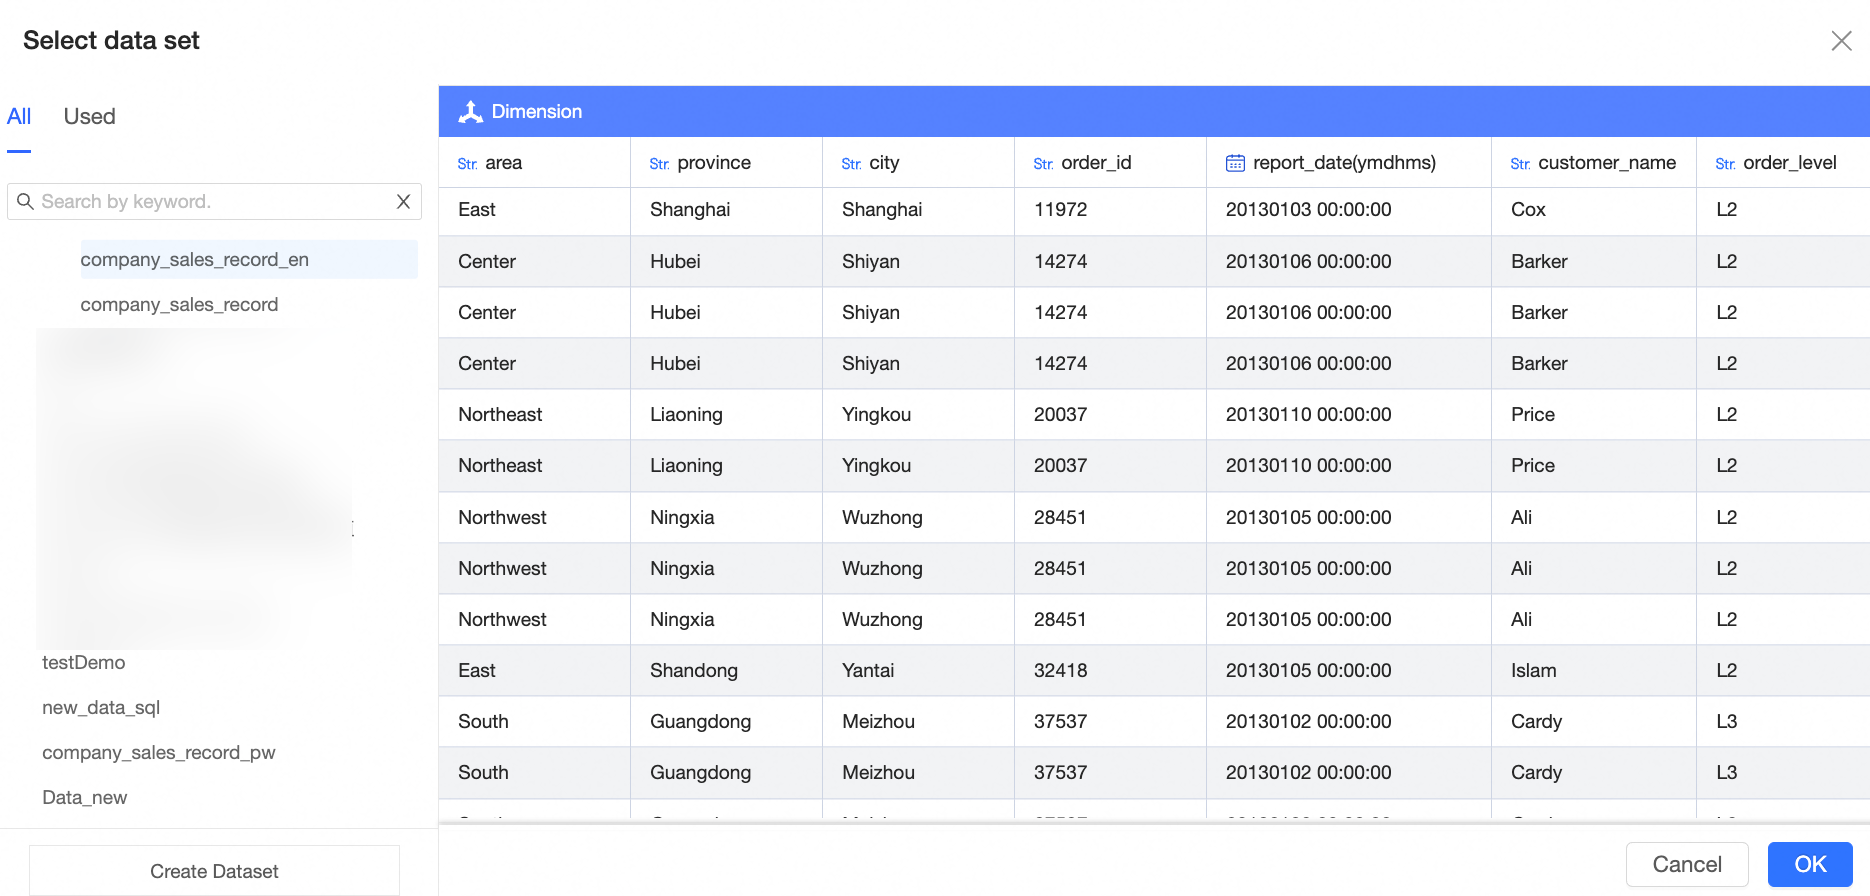
Click Preview data to view the All Datasets and Used Datasets tabs. You can also click Create dataset, which redirects you to the dataset creation page.
Edit Dataset
For detailed instructions, see Create a dataset.
Replace Current Dataset
To replace the dataset while keeping the field configurations, click the ![]() icon and select Replace current dataset.
icon and select Replace current dataset.
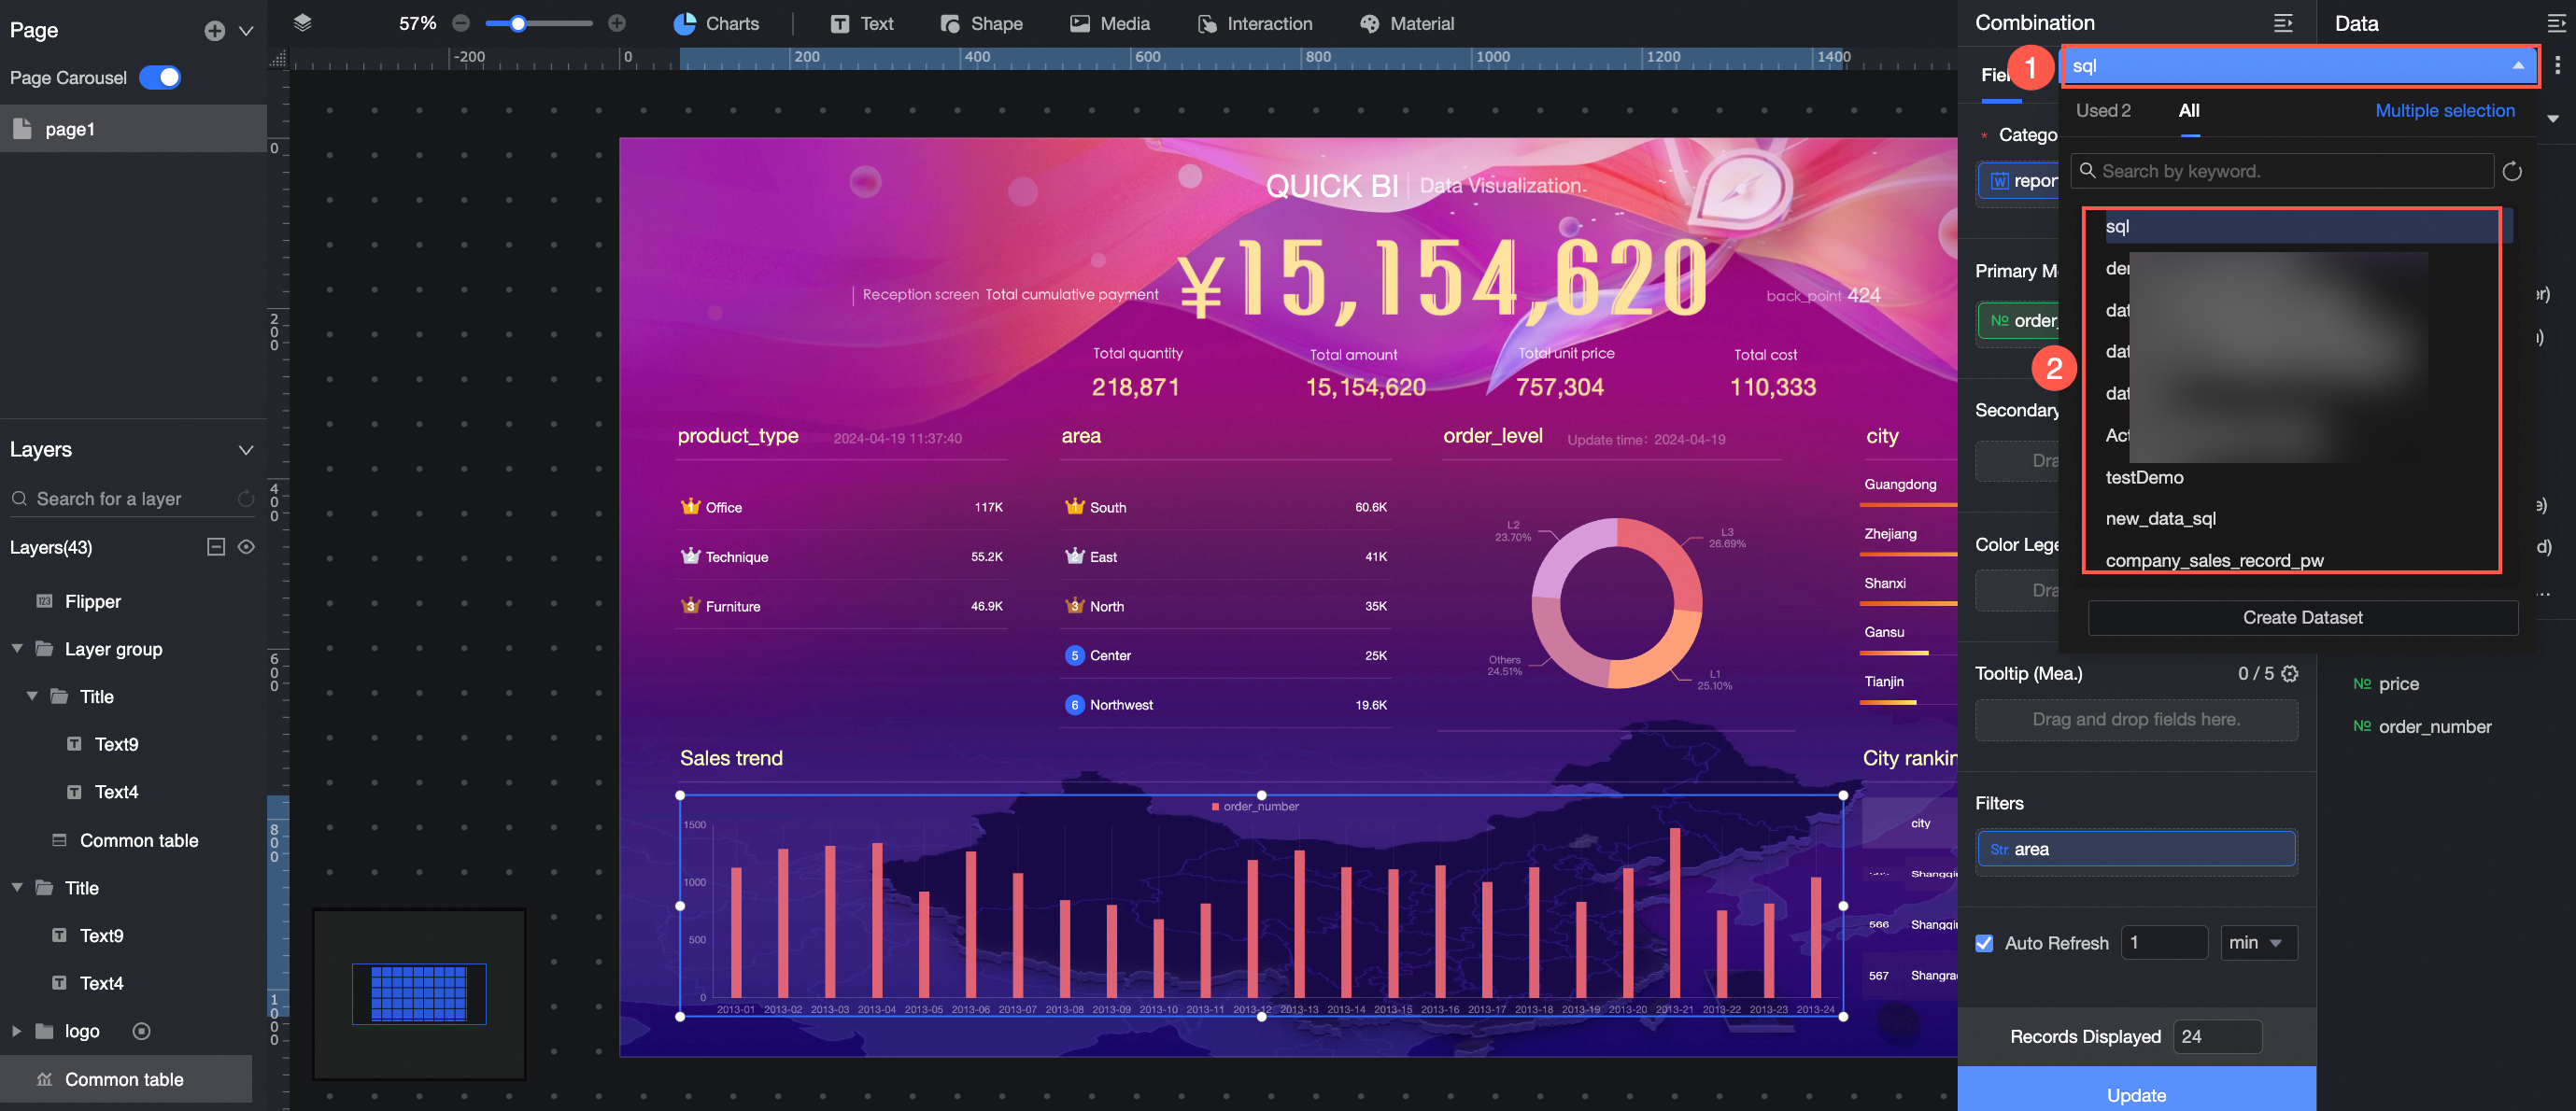
Switch Datasets
Click the selection box to switch between Used Datasets and All Datasets. This action clears all field configurations.
Upload Local File
Use a local file as a source table to create a chart.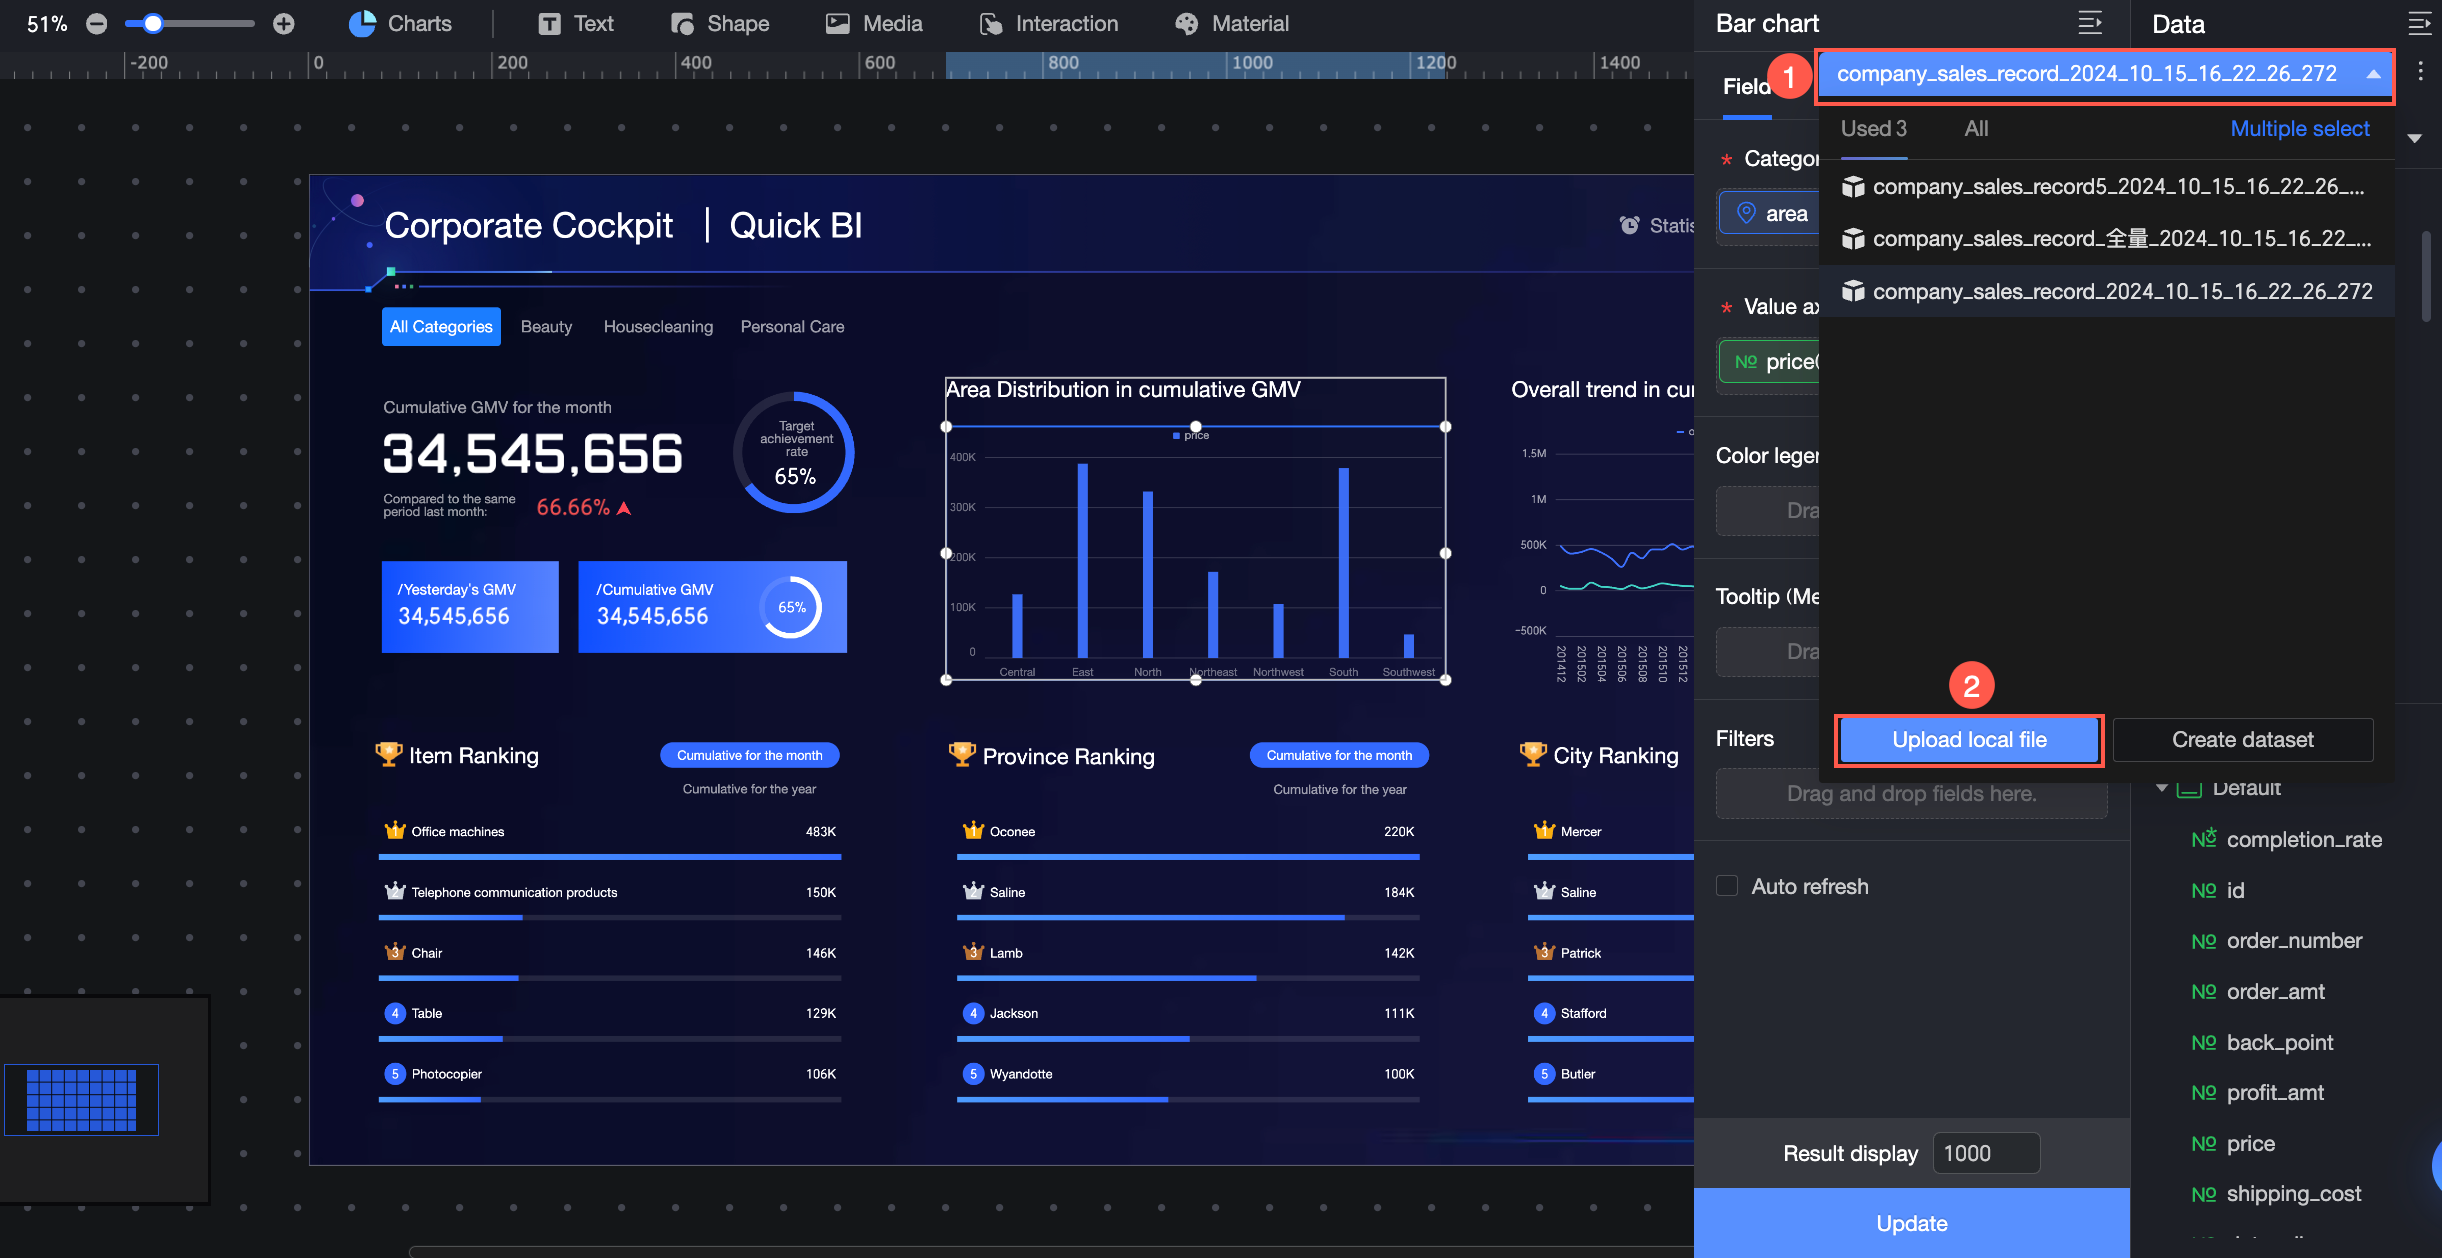
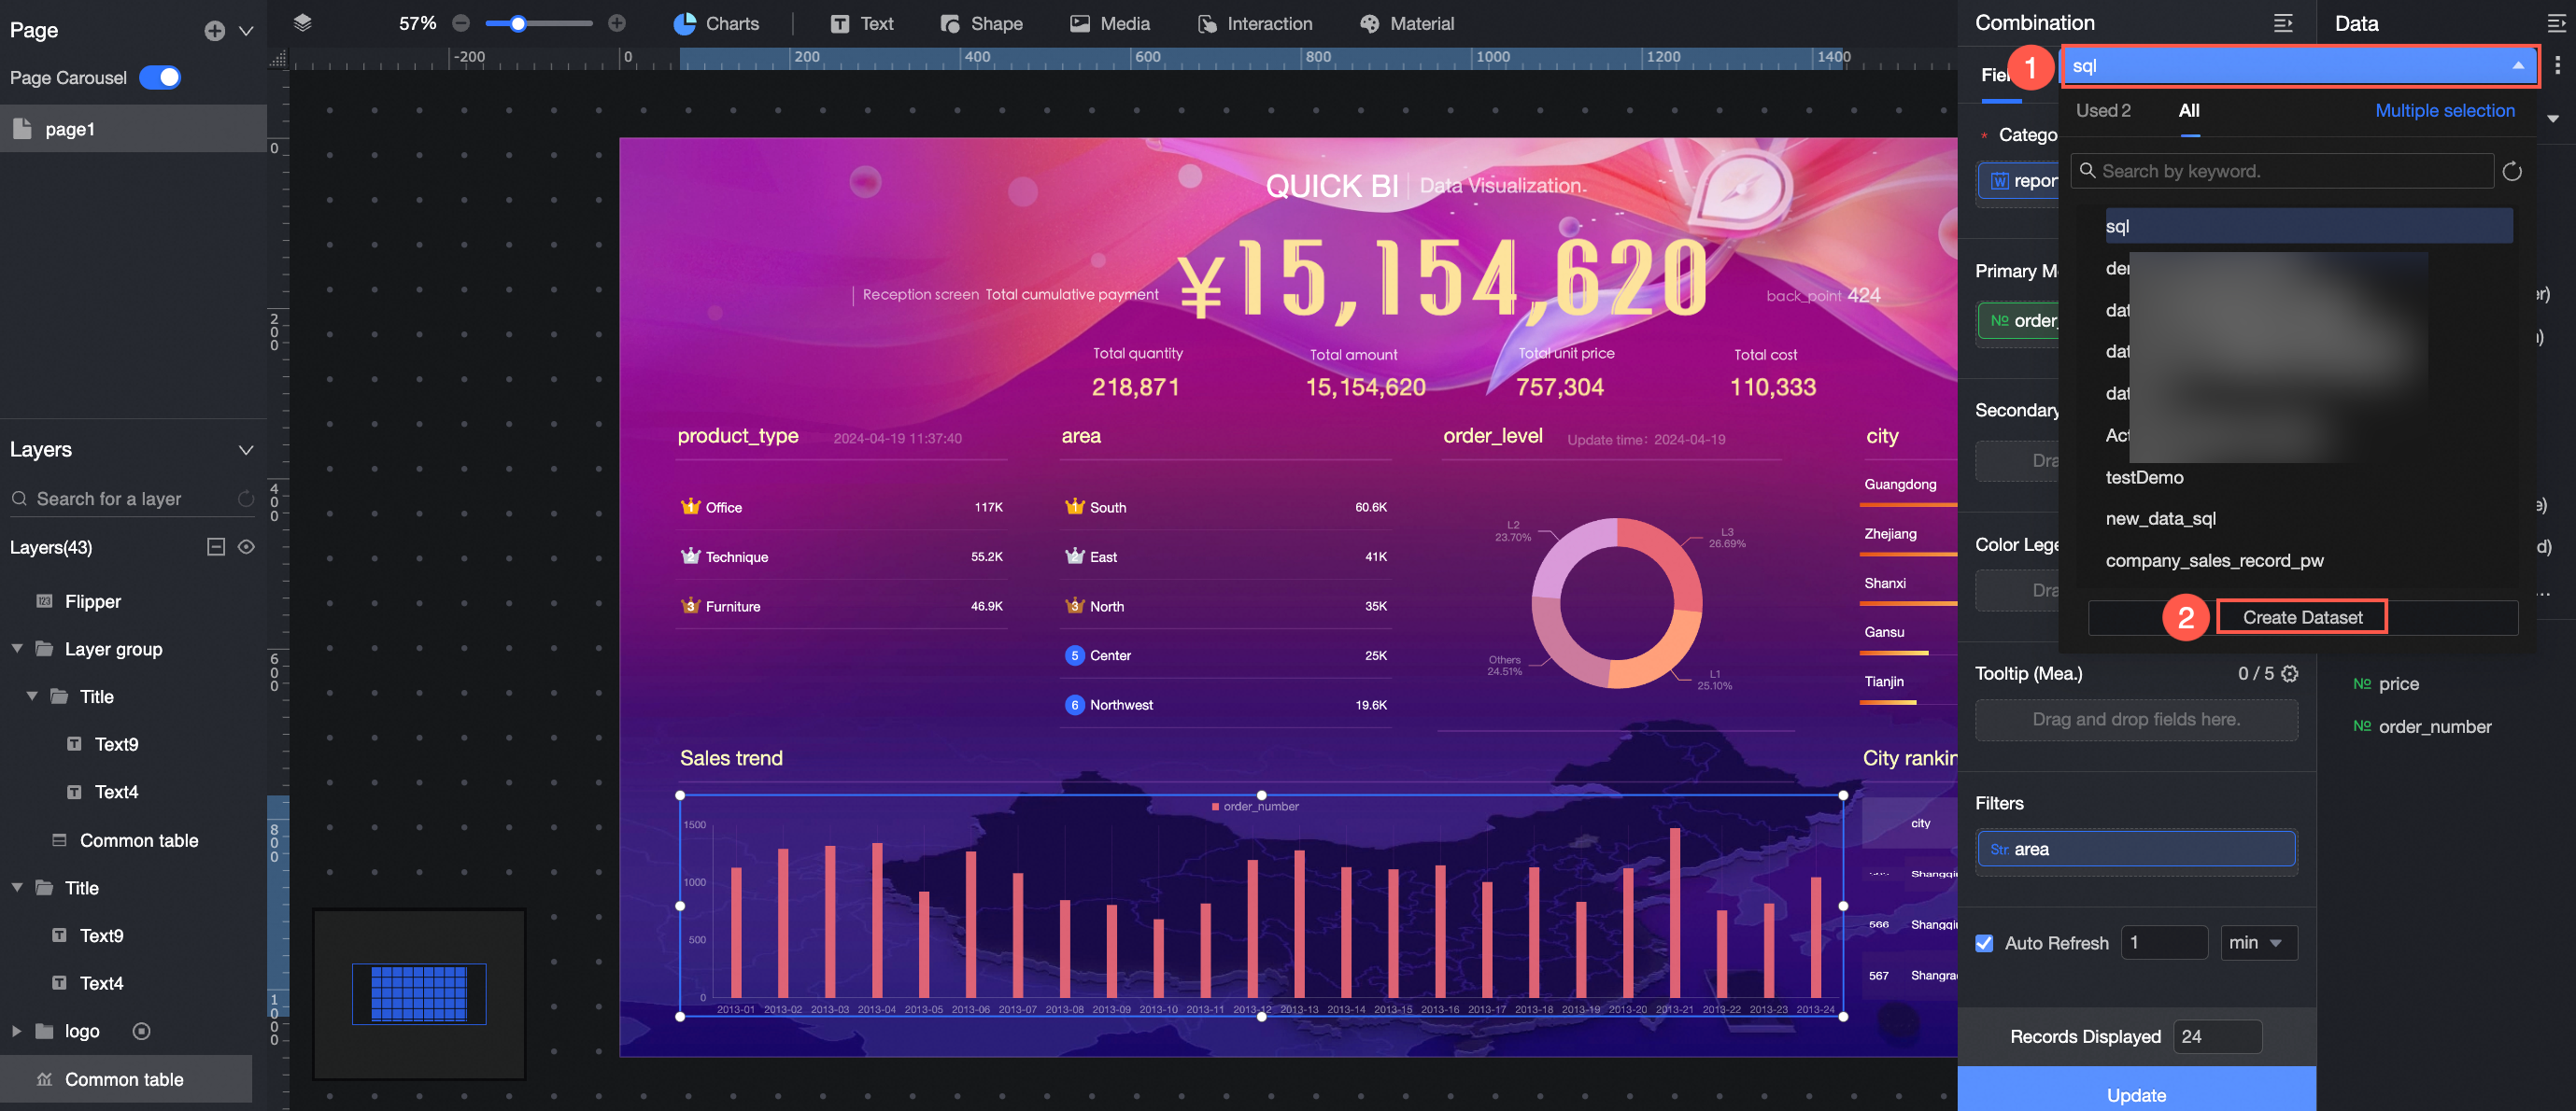
Create Dataset
Click Create dataset to go to the creation page. For detailed instructions, see Create a dataset.