This topic describes the UI sections and entry points for the data dashboard.
Interface Areas
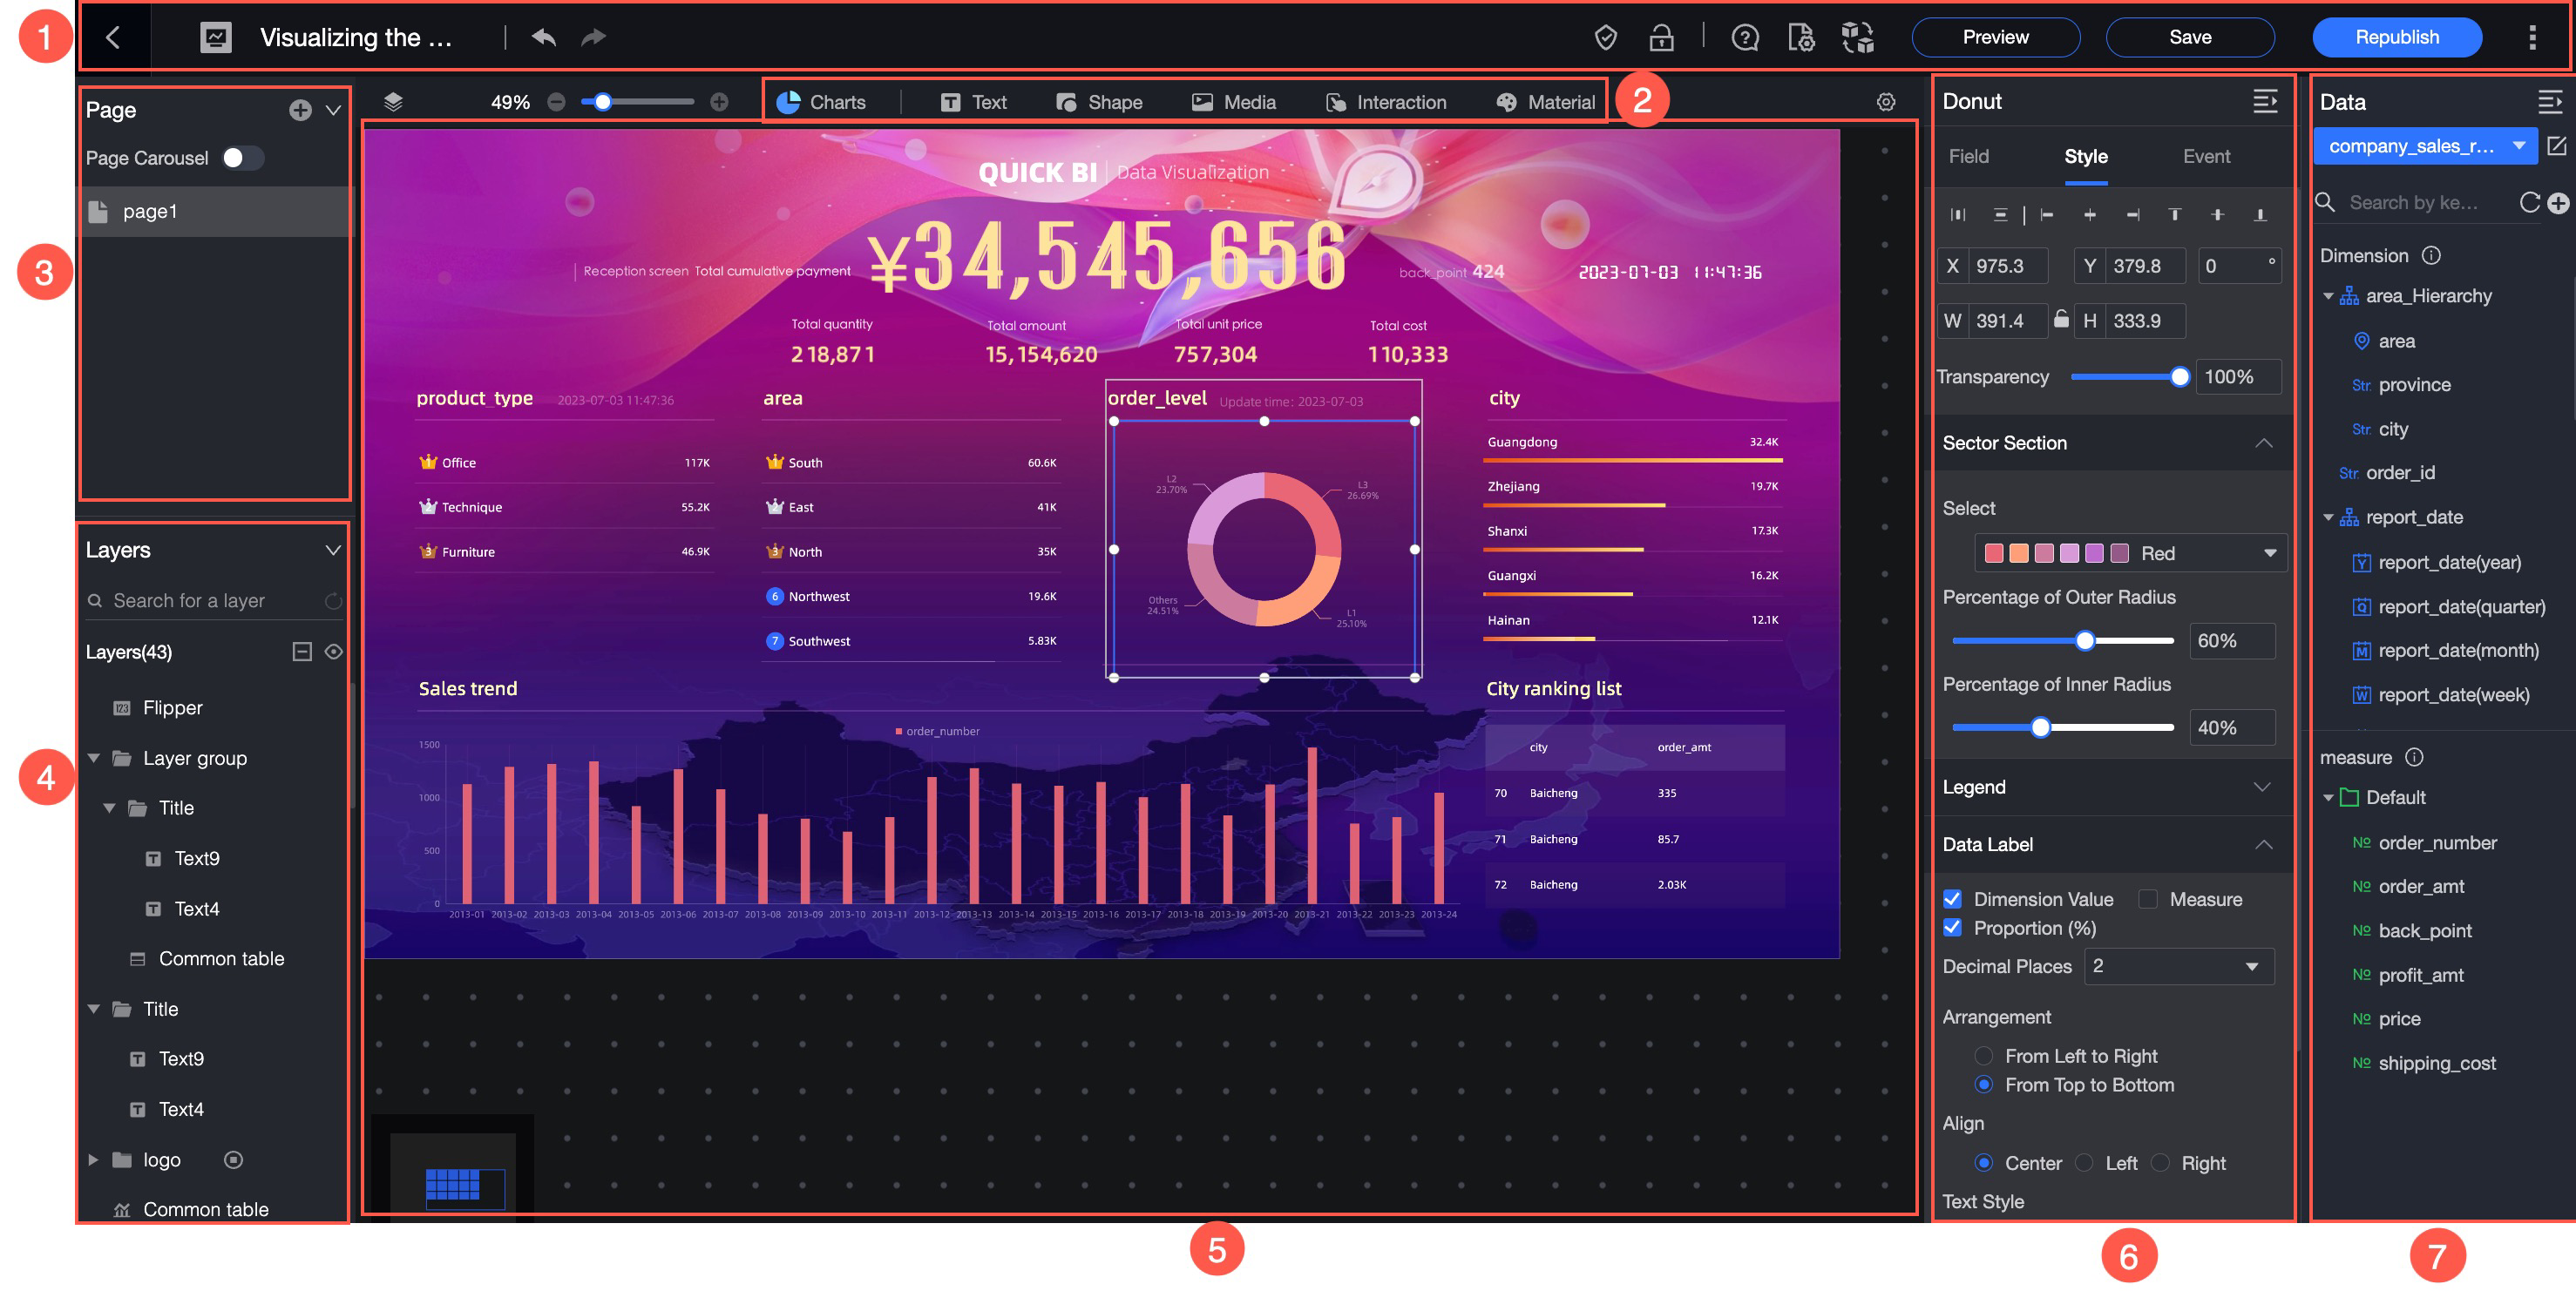
Toolbar
On the toolbar, you can change the dashboard name, add the dashboard to your favorites, undo or redo actions, grant collaboration permissions, force a lock, access help, and adjust the scale.
Component library
The component library provides seven types of charts and a rich selection of text, media, interactive controls, and materials to meet various dashboard creation needs.
Page configuration area
This area lets you add pages, configure page carousels, and delete pages.
Layer configuration area
This area supports multiple layers. You can configure layer groups, configure layer carousels, and lock or hide layers.
Canvas configuration area
This area lets you adjust the canvas layout and perform operations on components, such as cut, copy, lock, hide, and group.
Component configuration area
This area lets you add data to components and configure their styles.
Data transformation area
This area lets you select datasets, add data, modify data formats, and transform data.
Entry Points
Log in to the Quick BI console and use one of the following methods to create a data dashboard.
Method 1: Create from the resource entry point outside a workspace.
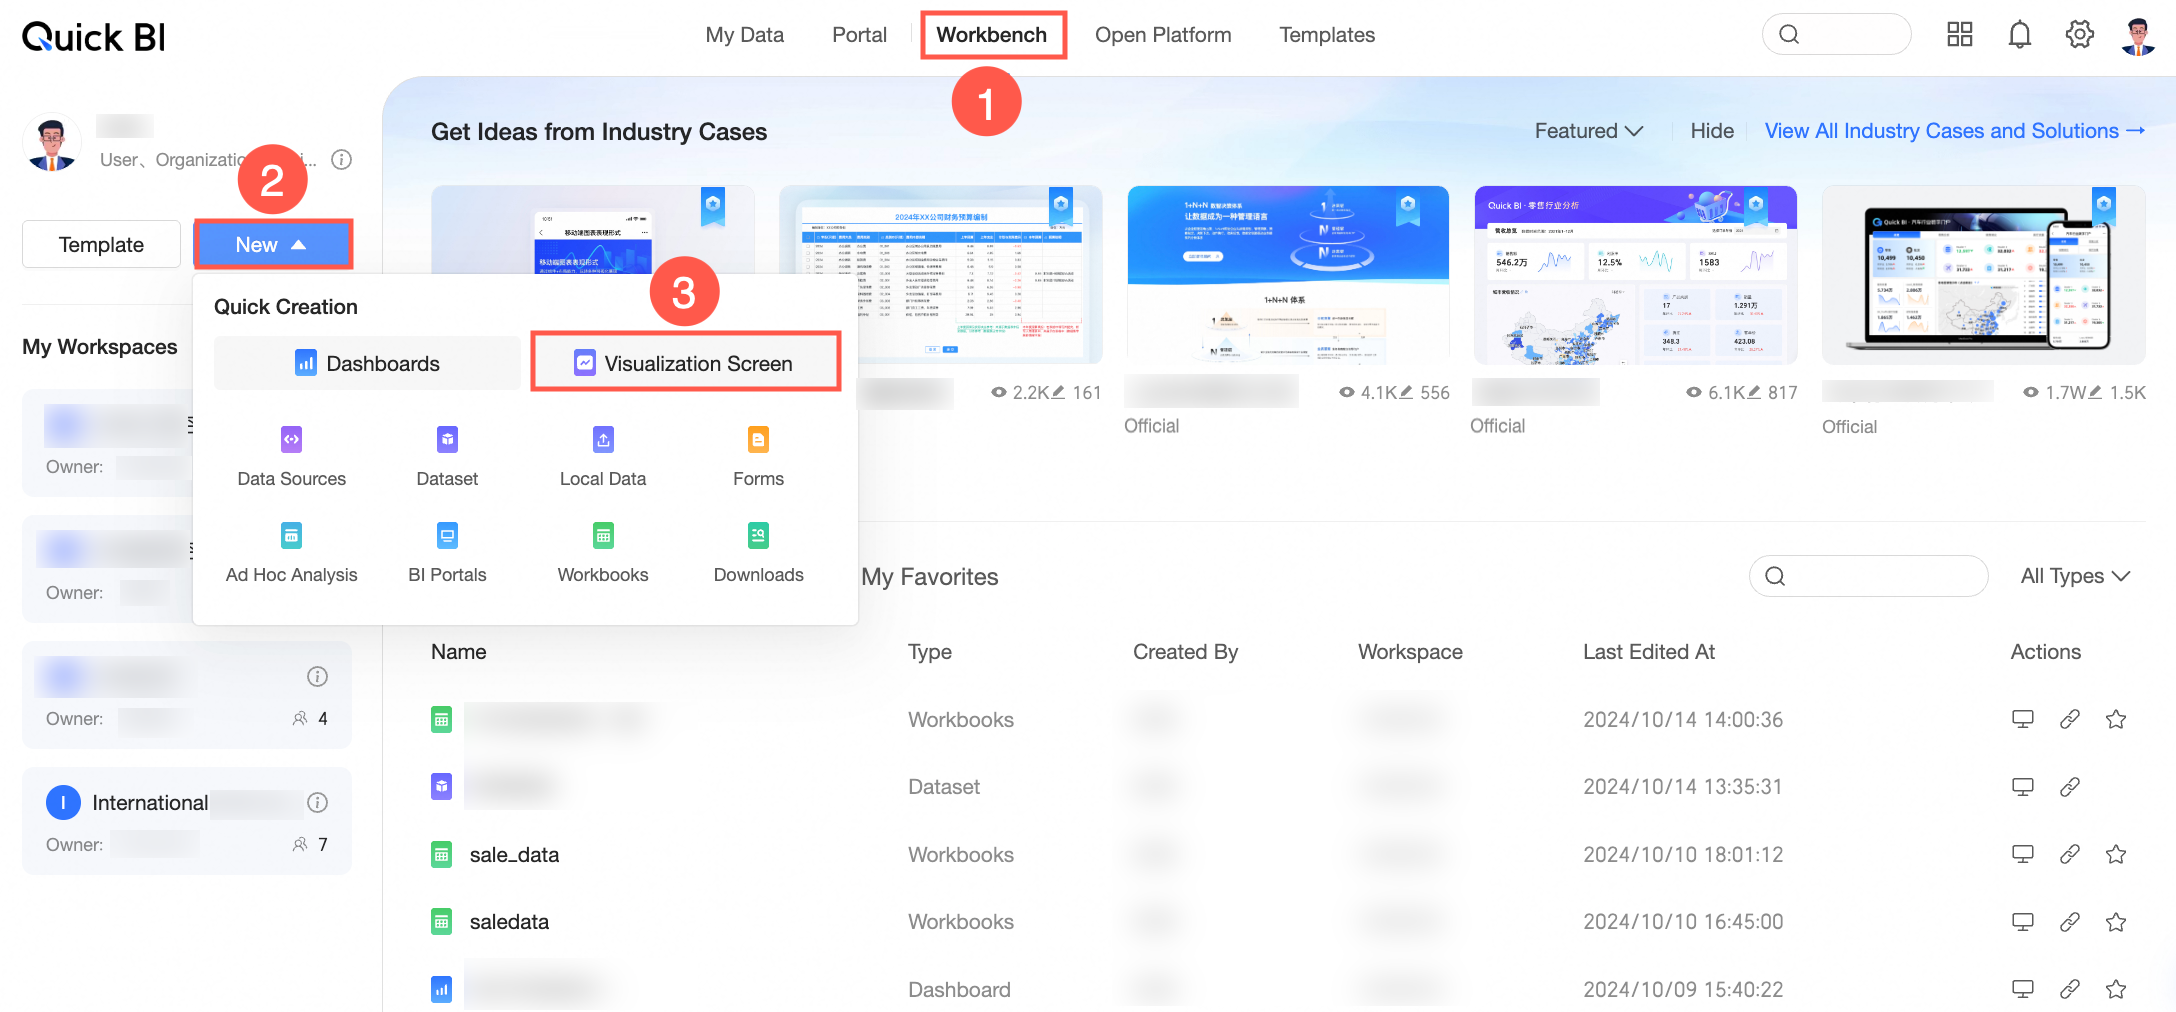
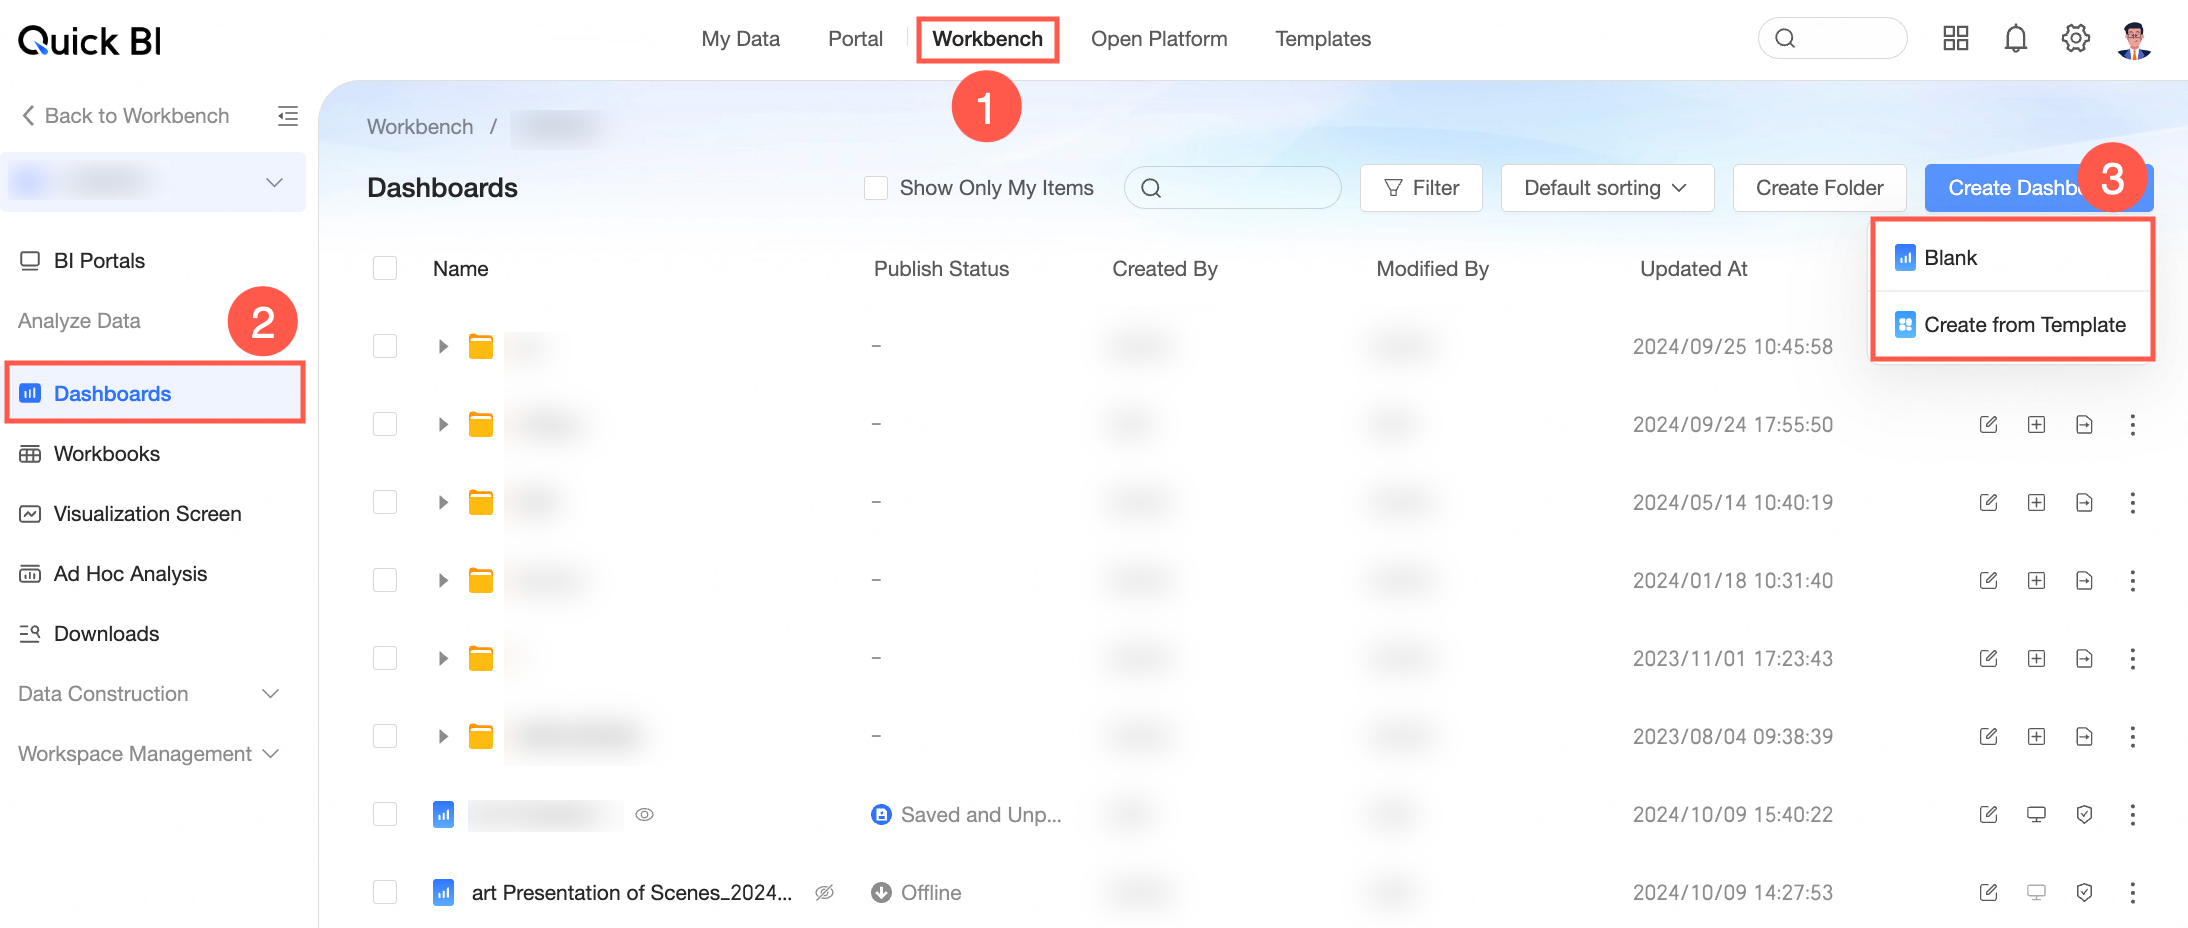
Method 2: Create from the resource list within a workspace.
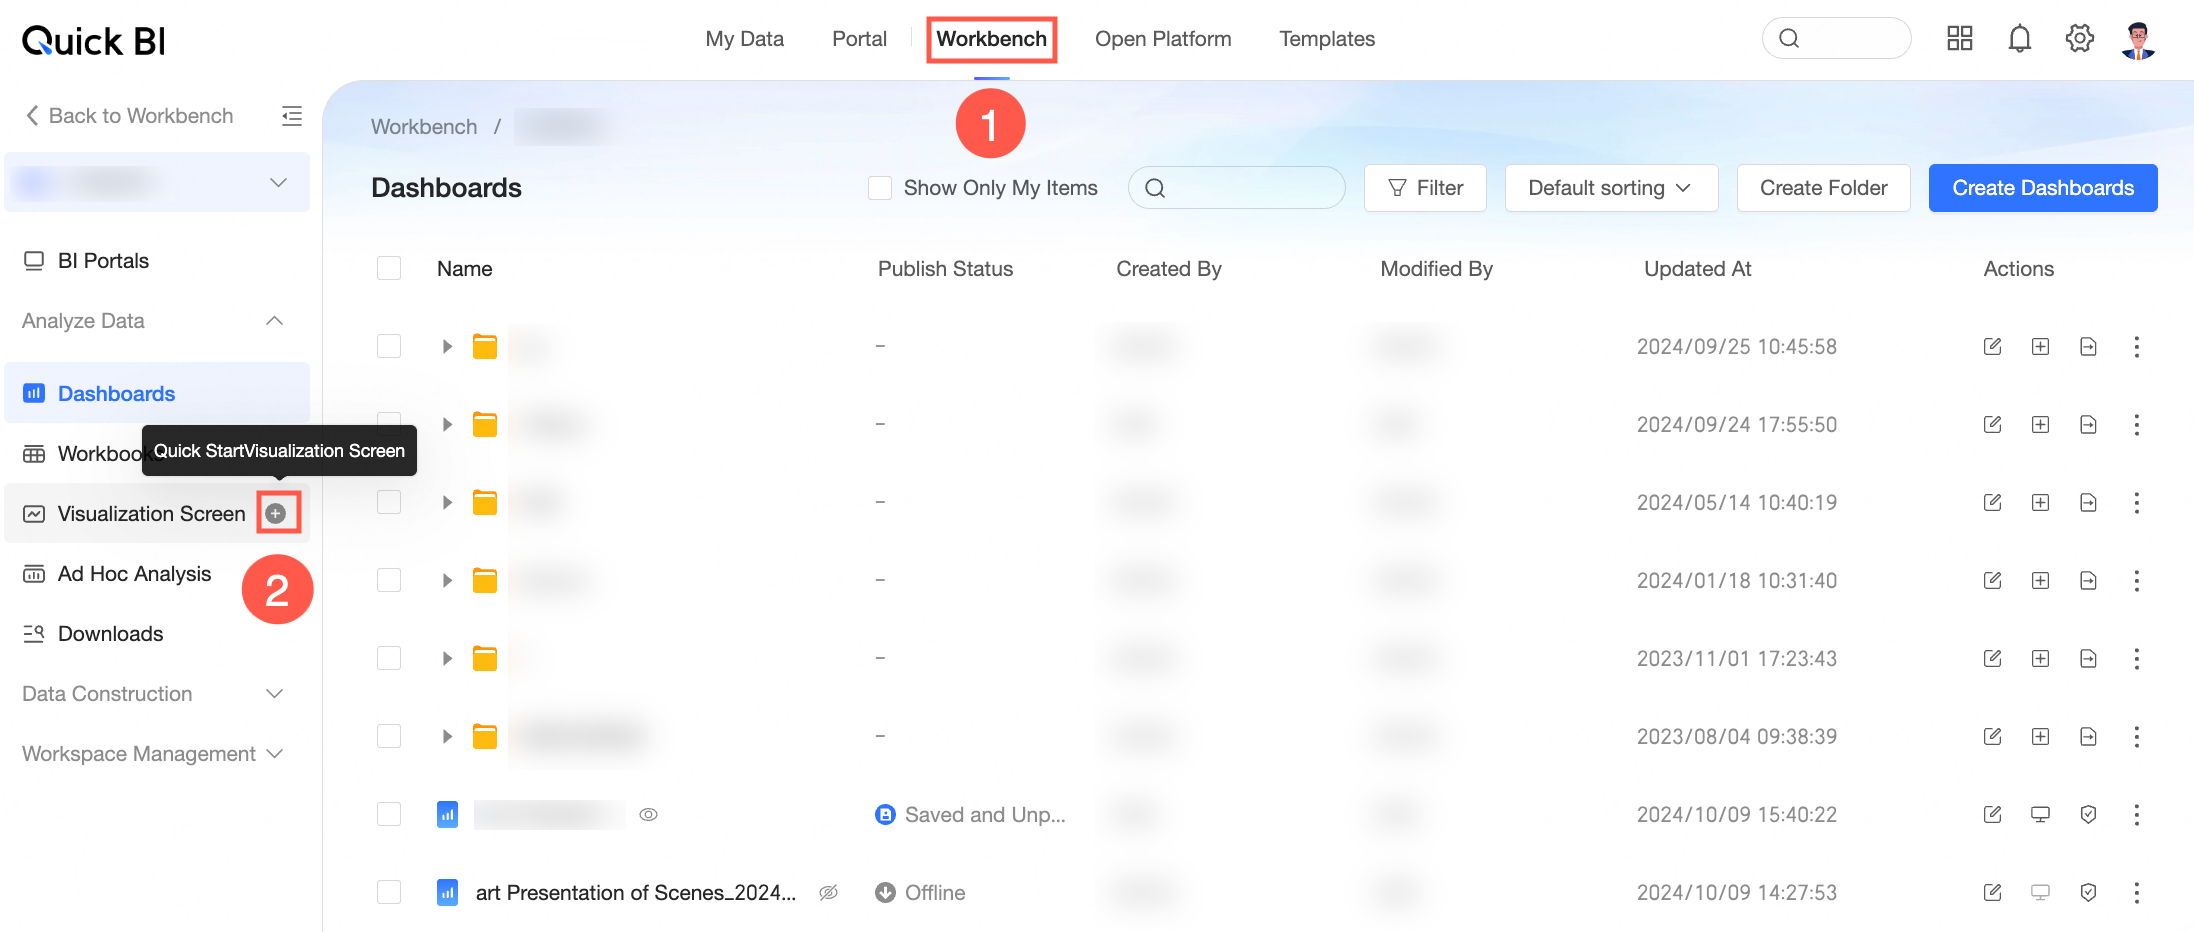
Method 3: Create from the data dashboard module within a workspace.
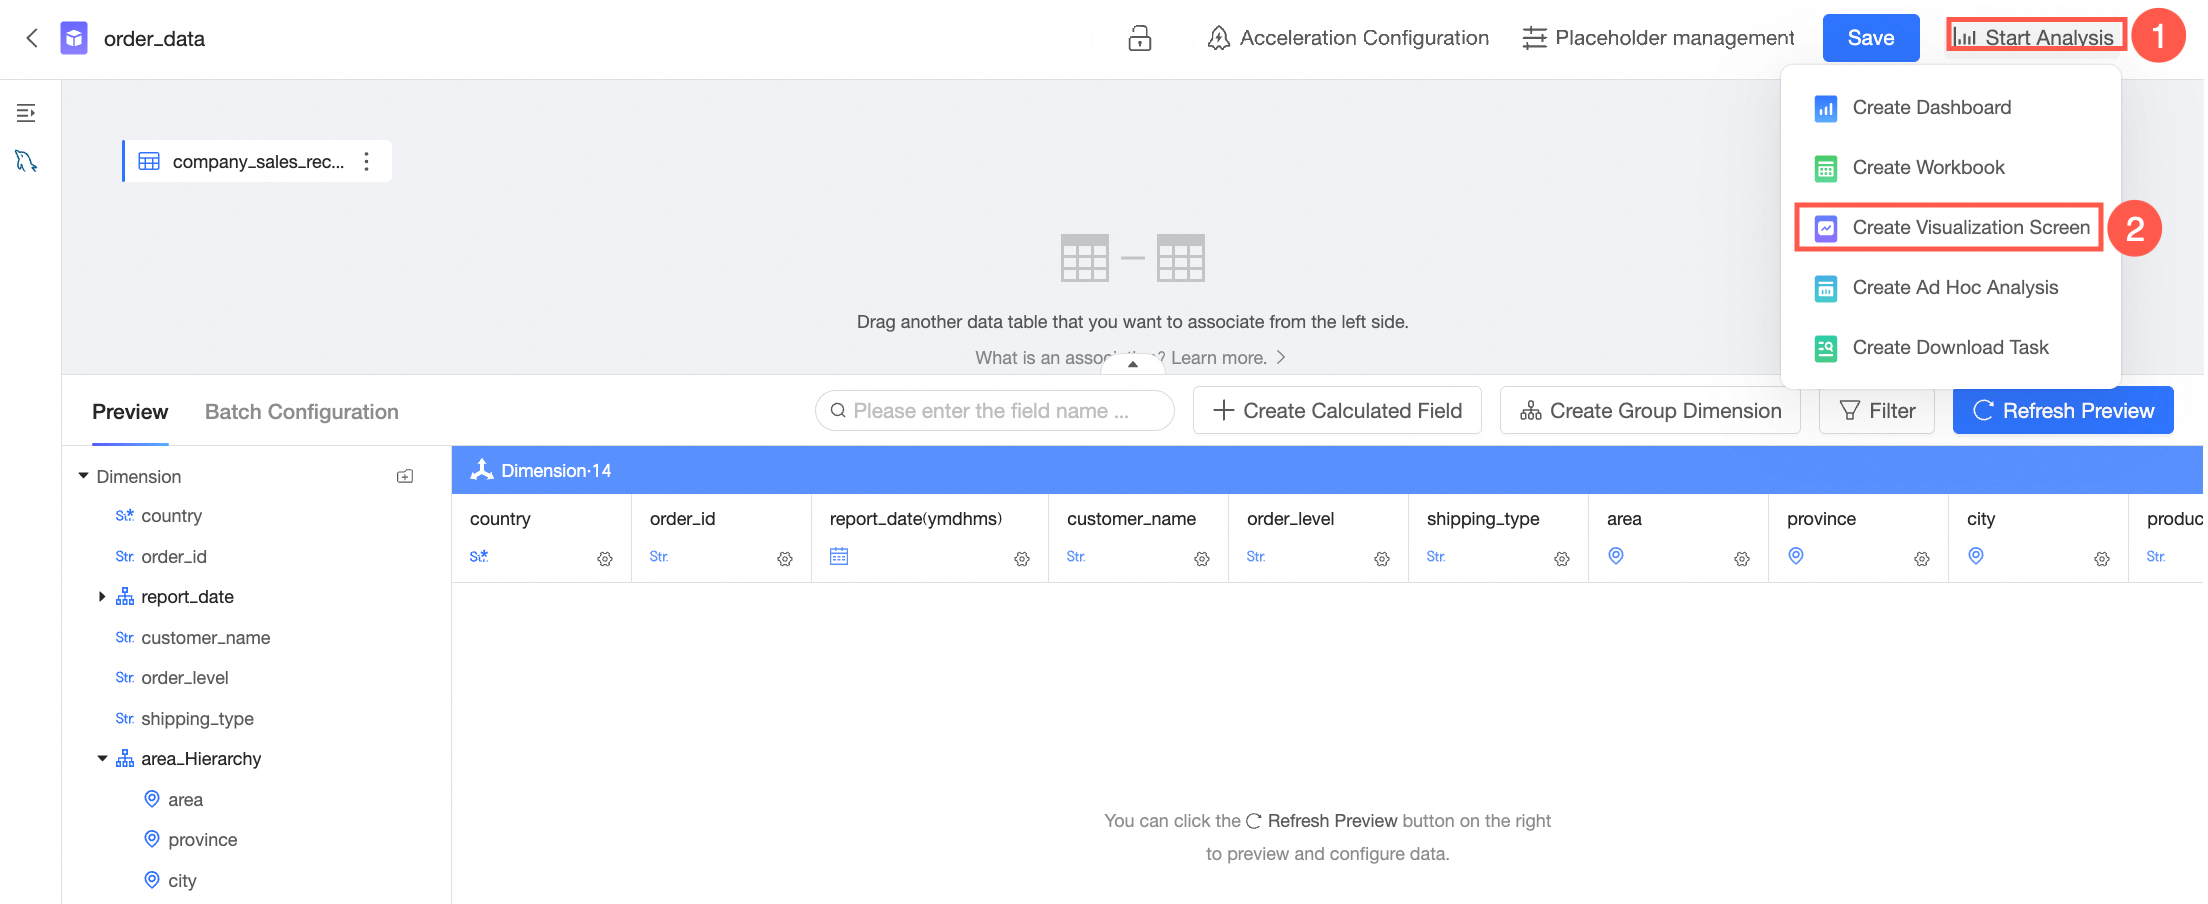
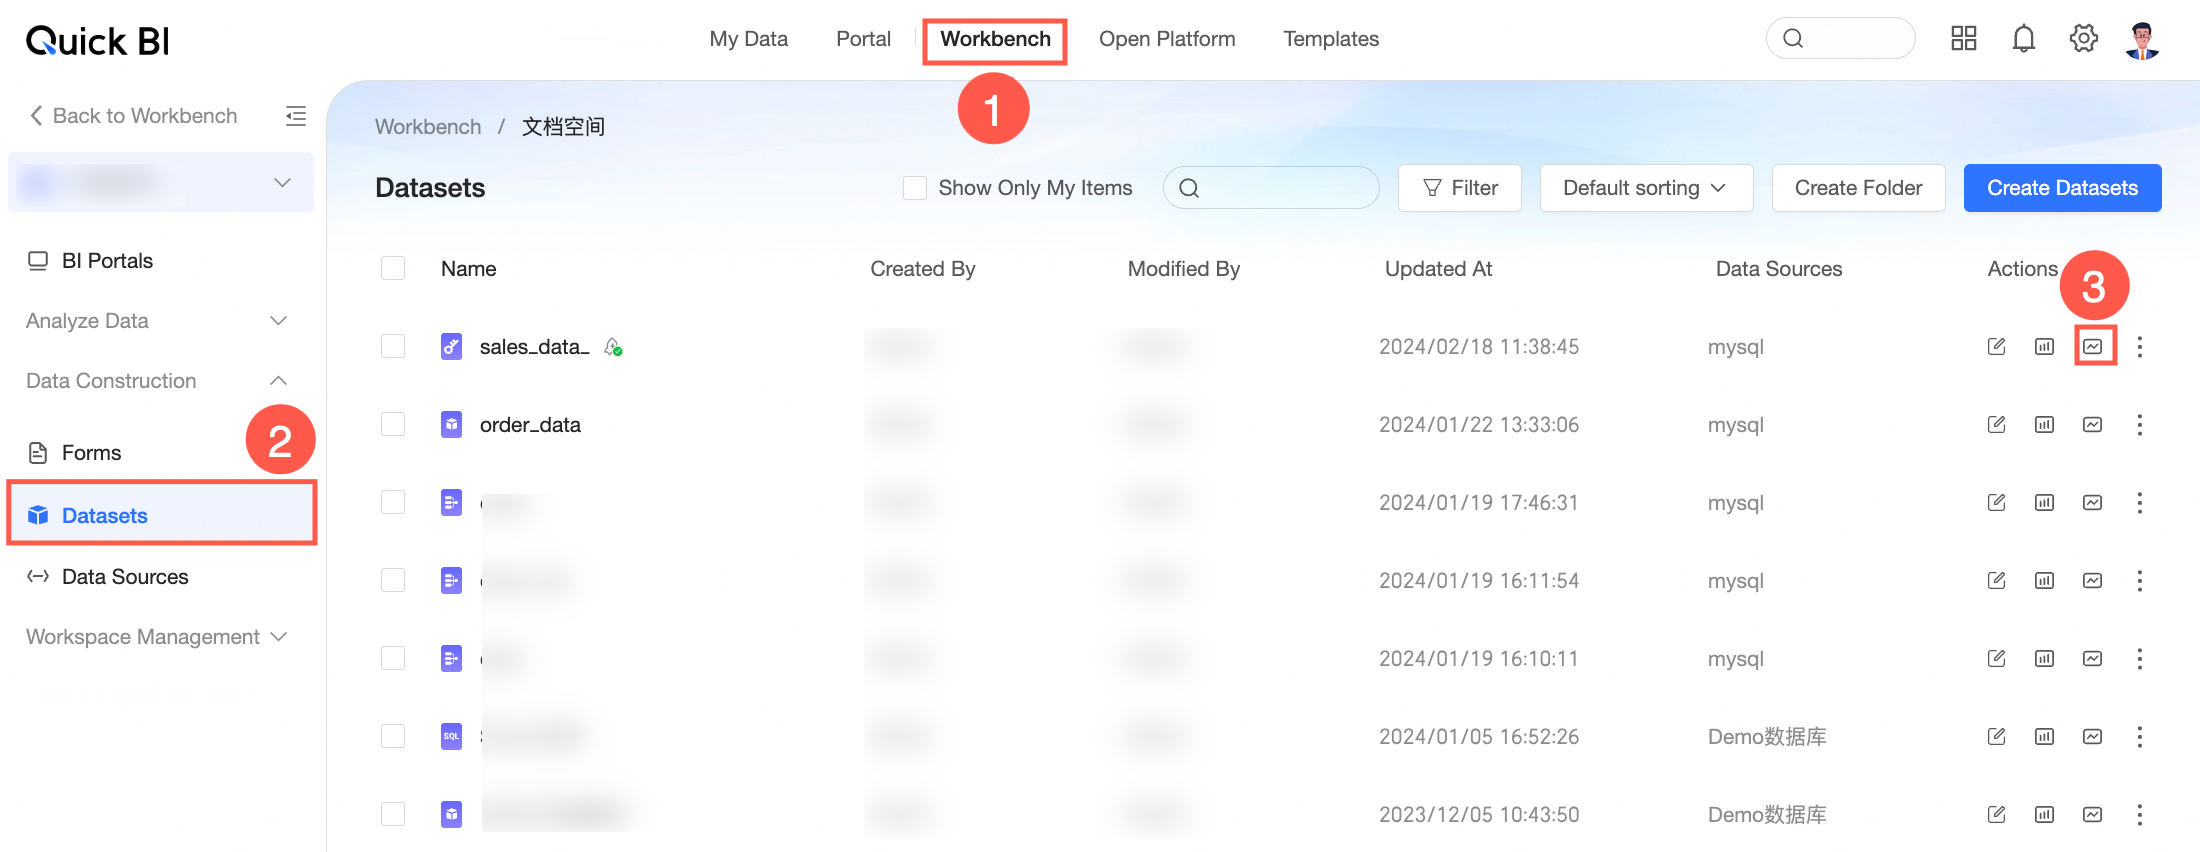
Method 4: Create from the dataset list.
Method 5: Create from the dataset editing page.