This topic primarily discusses the use of placeholders and their application methods.
Procedure
Create entry
Entry one: custom SQL editing page
Navigate to the SQL code editing page and click Placeholder Management.

In the Placeholder Management panel, the system lists the placeholders used in your SQL. Here, you can adjust the variable type and default value for each placeholder. Once configured, click Confirm.

Entry two: data processing interface
In the Toolbar of the data processing interface, click Create Placeholder, enter the Variable Name, Variable Type, and Query Default Value, then click Confirm.

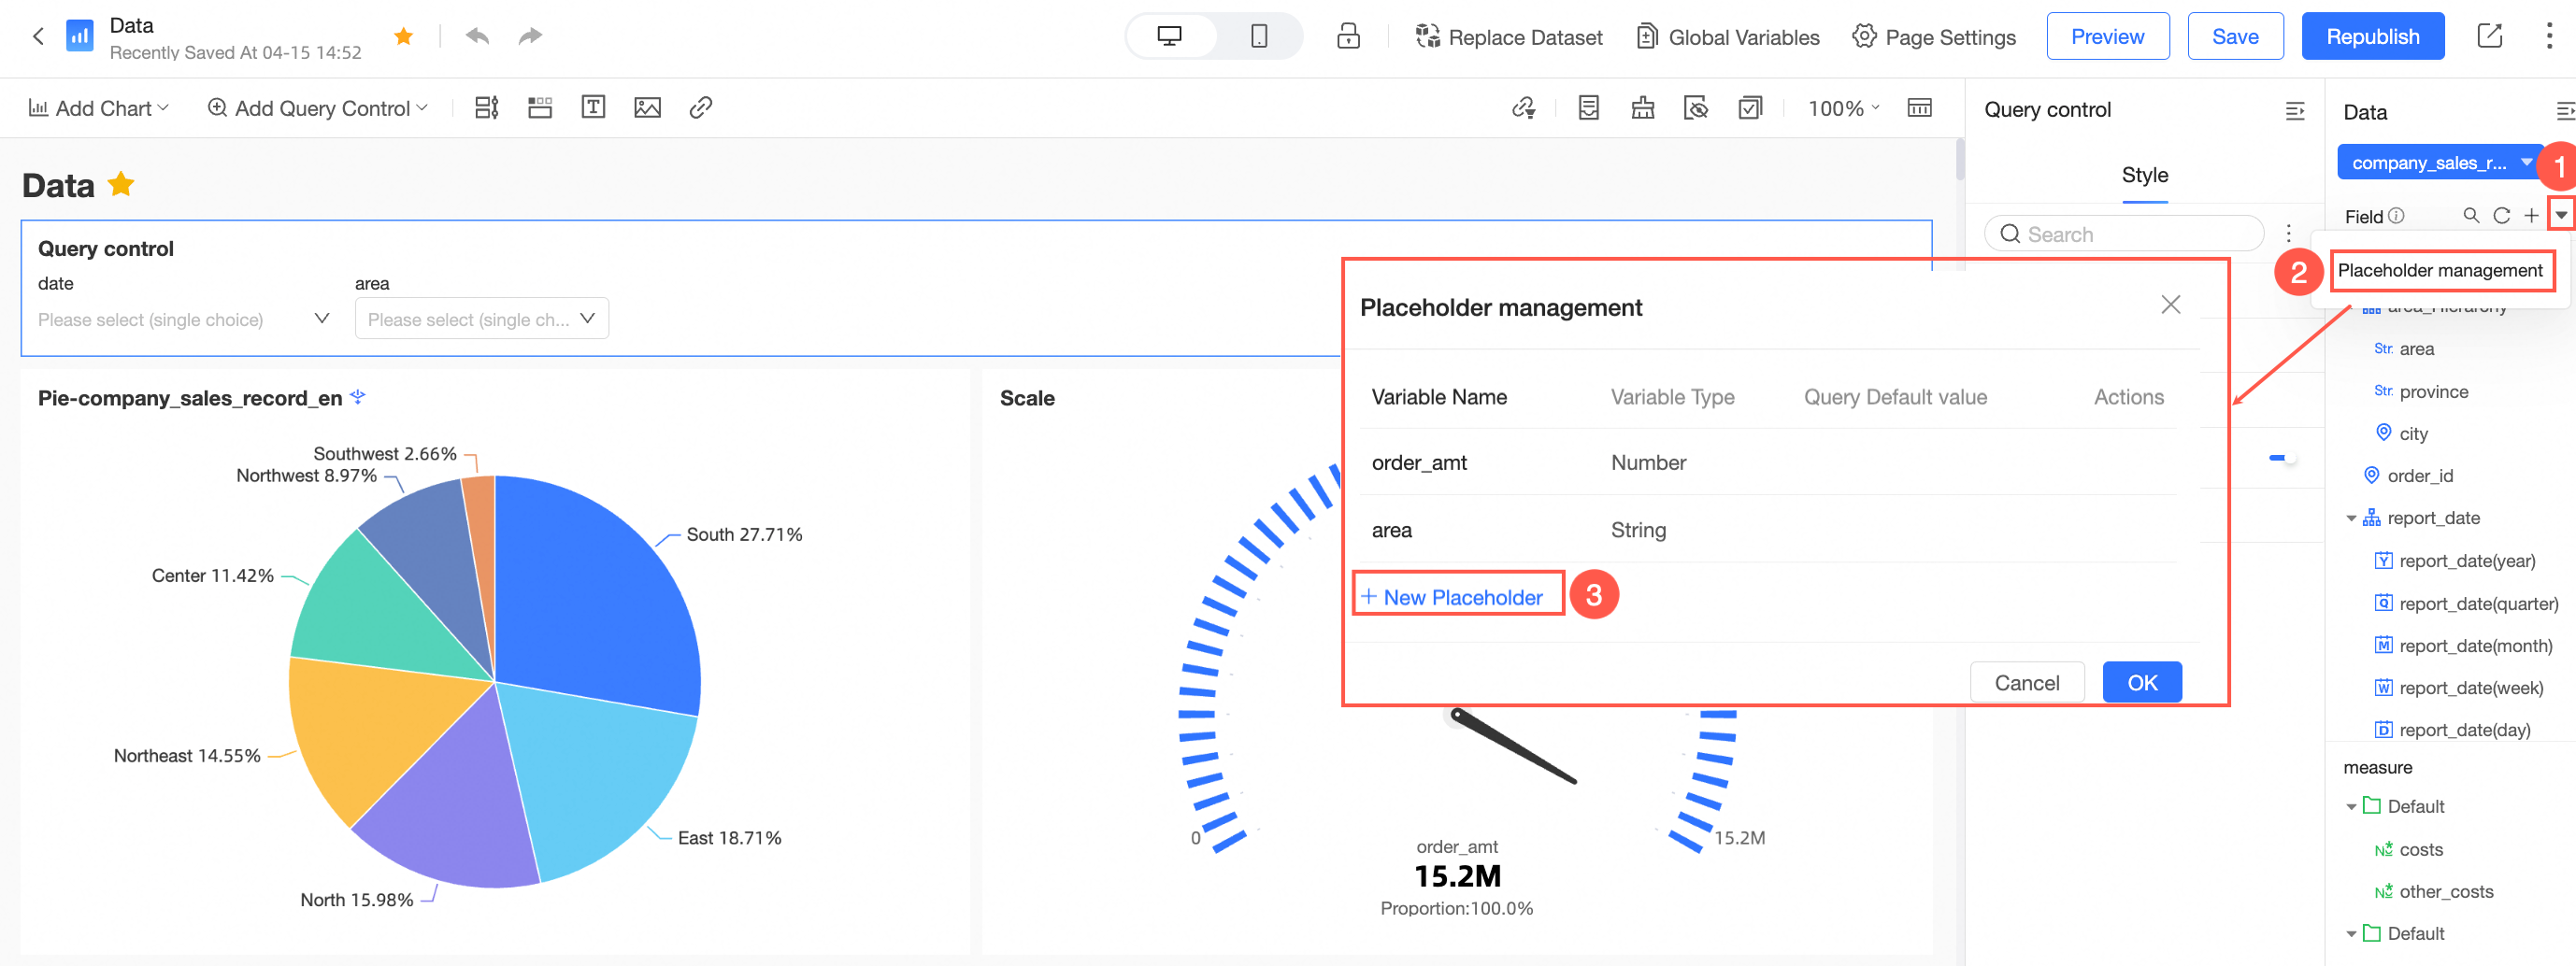
When a dataset contains placeholders, you can click Field Outline -> Placeholder icon
 to access the Placeholder Management interface.
 In the placeholder management interface, click Create Placeholder to manually create a placeholder.
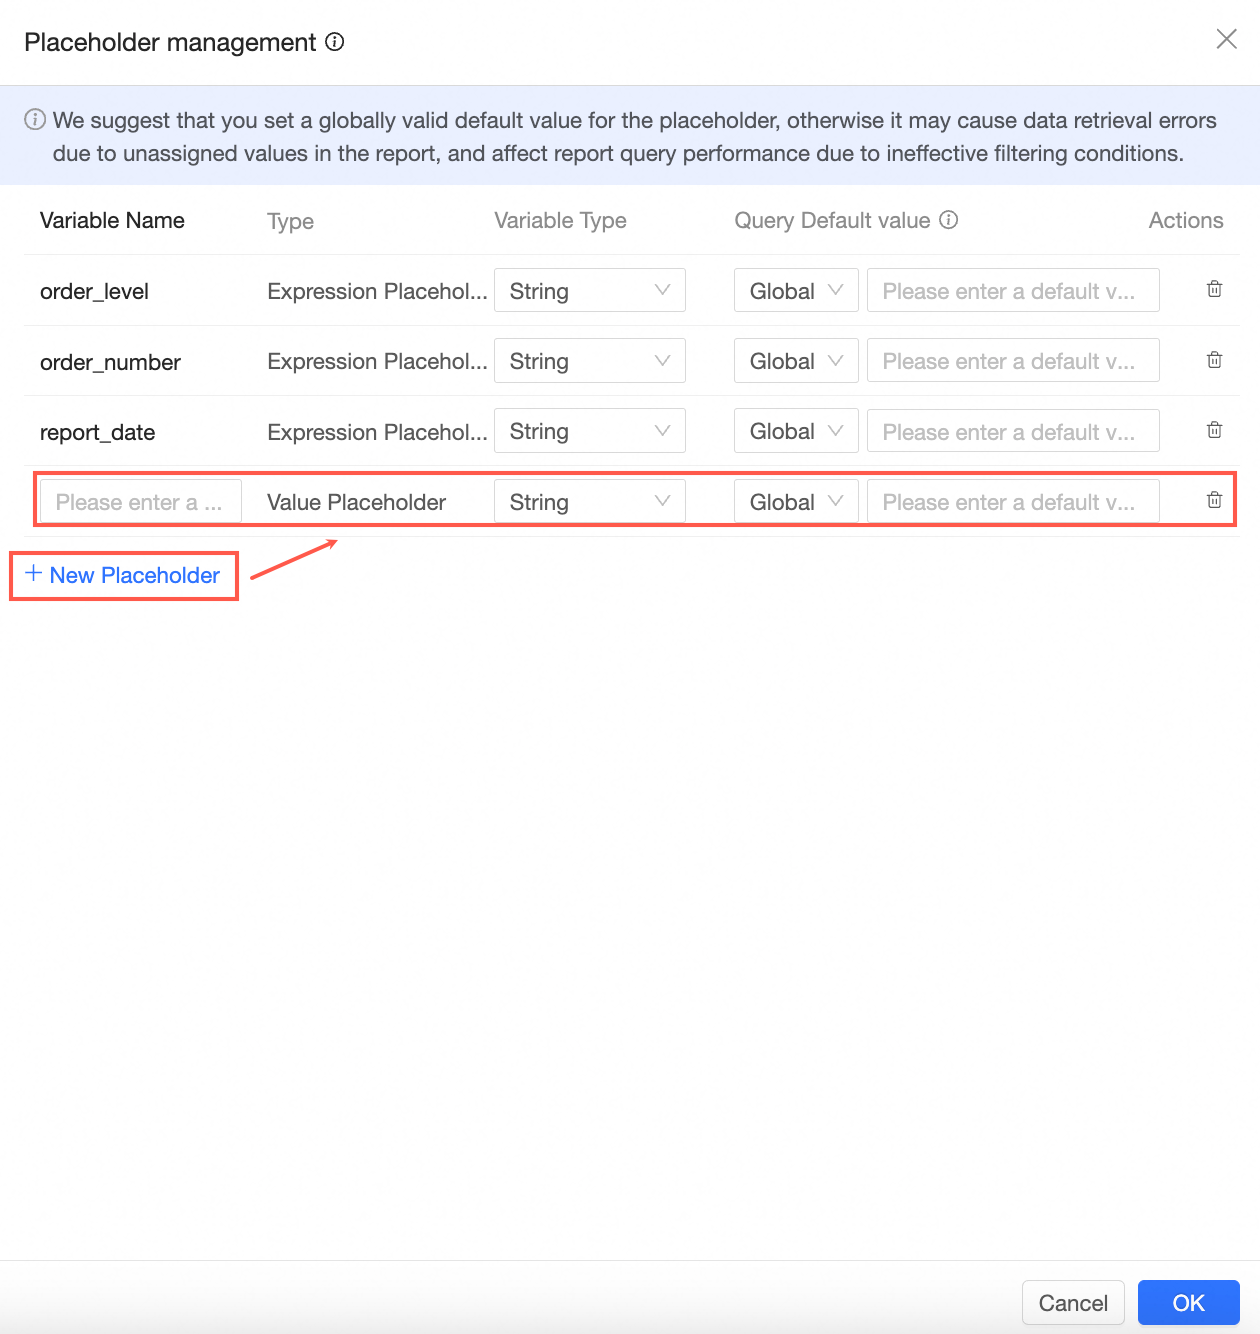
Entry three: dashboard editing page
To create a New Placeholder on the dashboard editing page, follow these steps.
Click the
 icon to initiate a new placeholder creation.
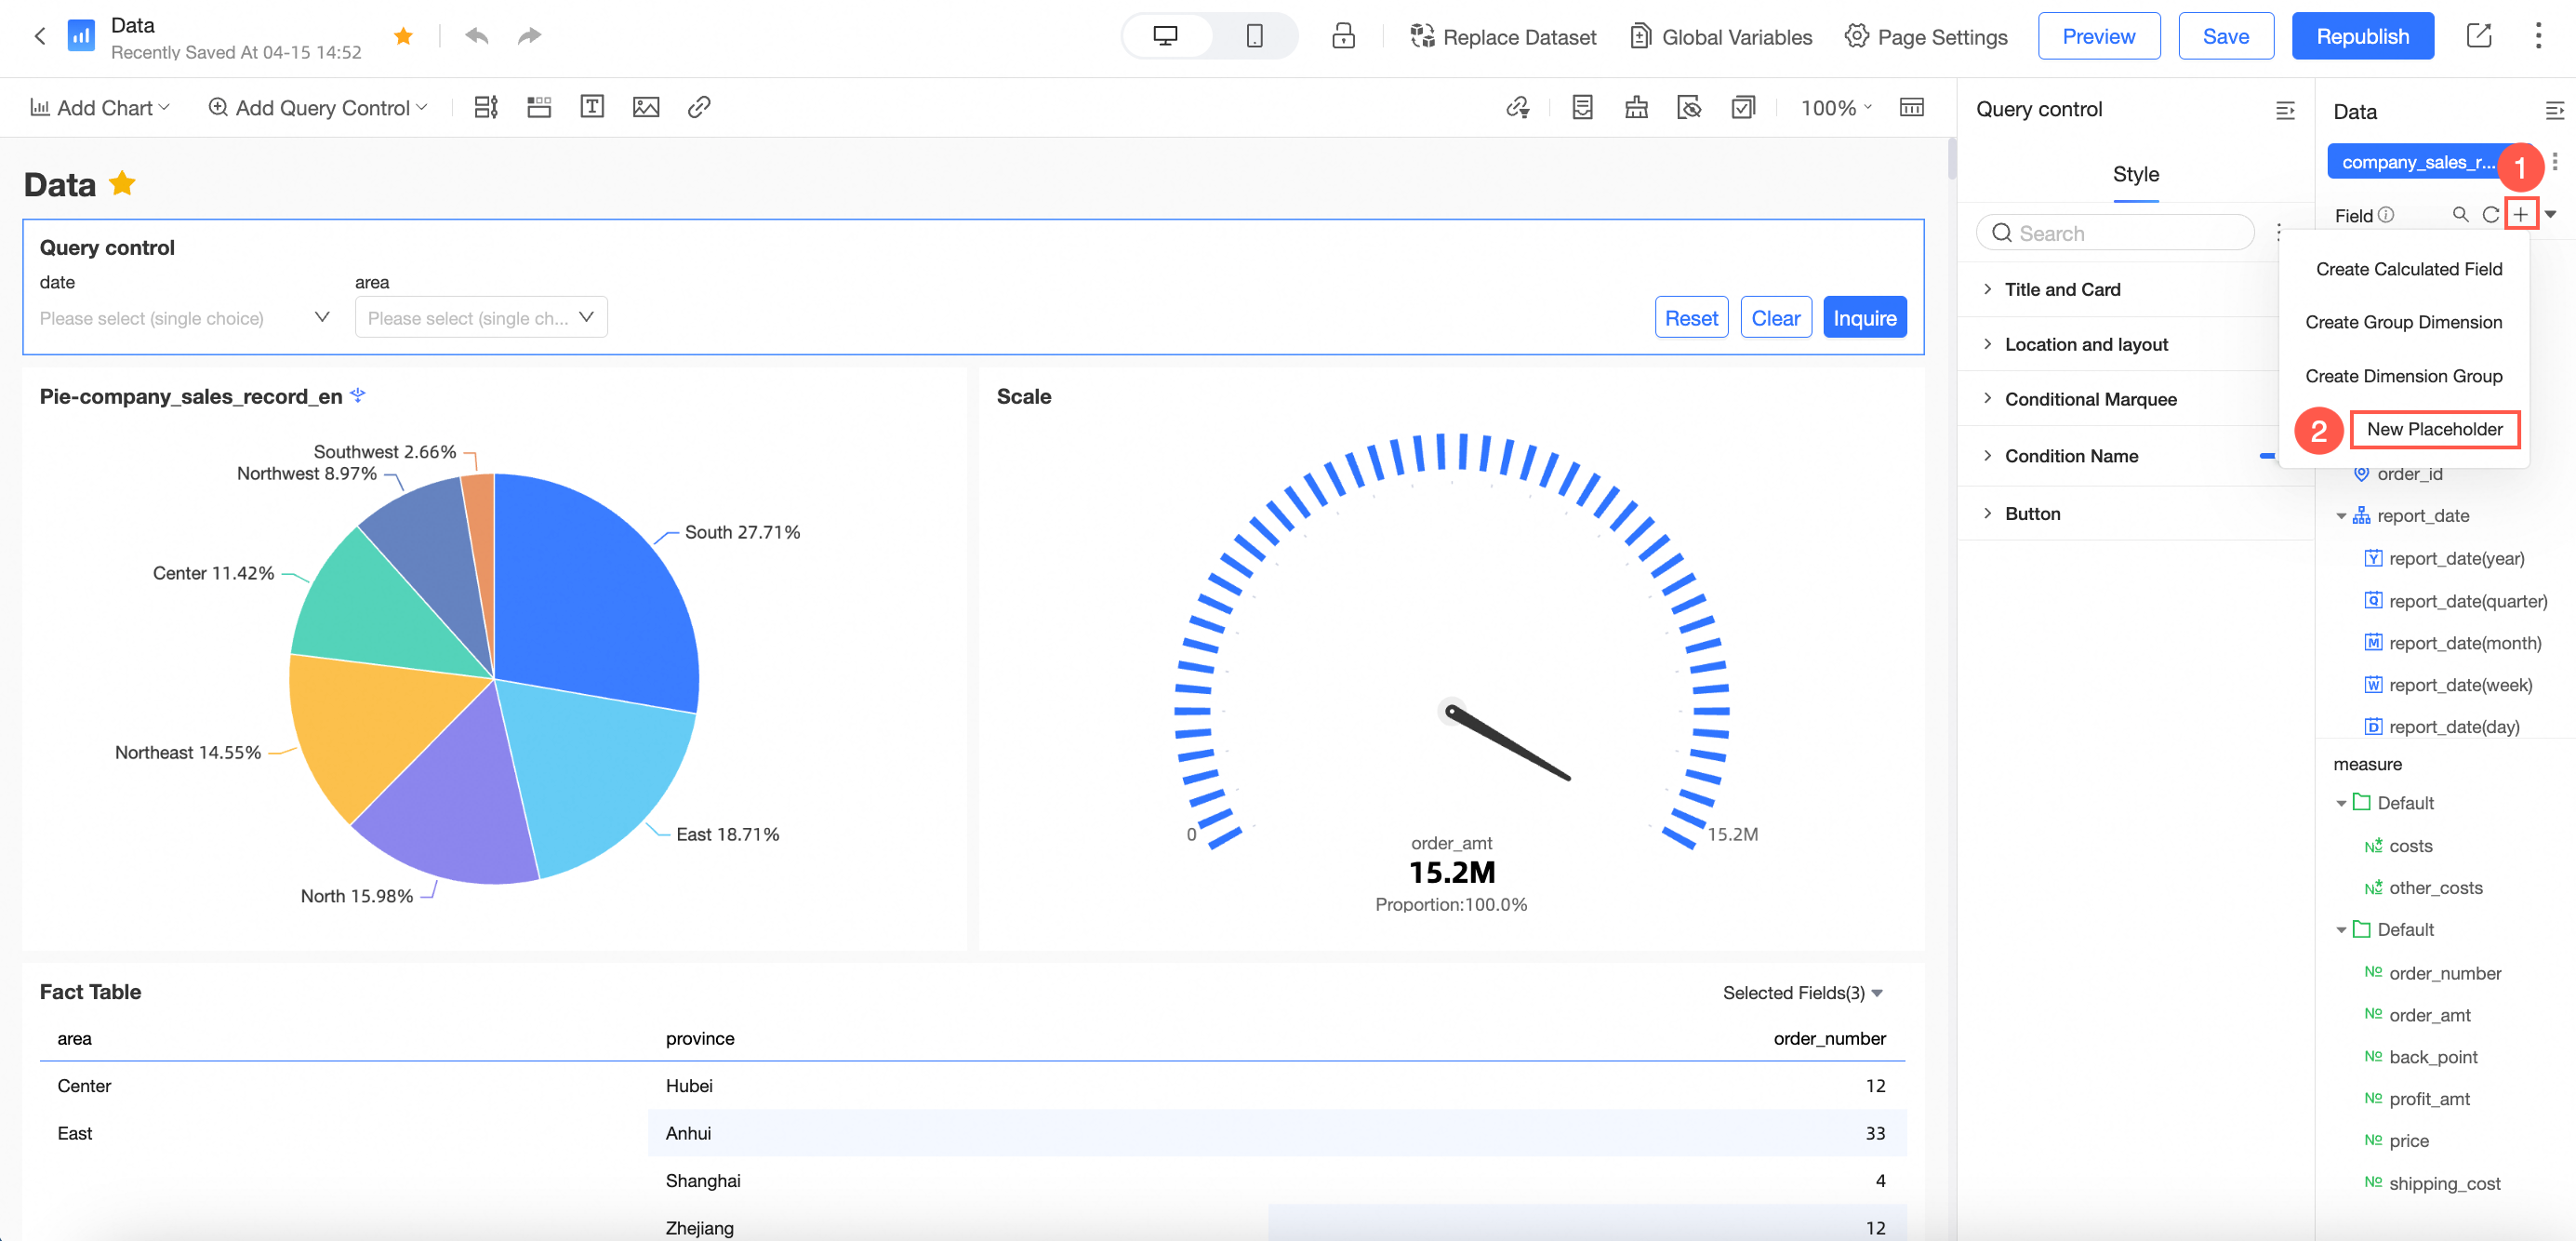
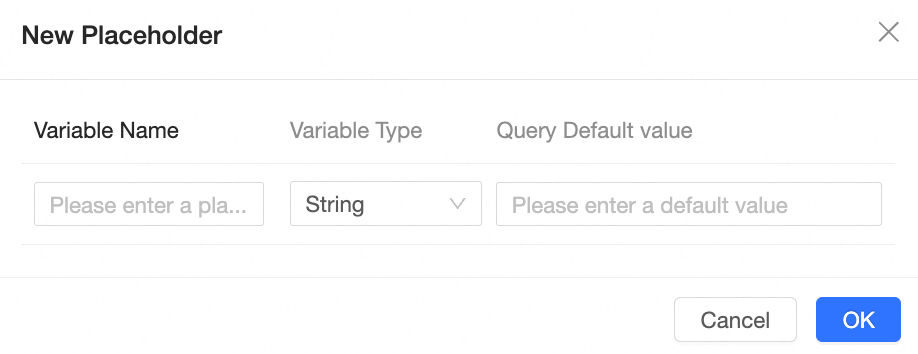
In the Placeholder Management interface, select Create New Placeholder.
Within the Create Placeholder interface, specify the Variable Name, Variable Type, and Query Default Value.
Configuration Items and Descriptions
Configuration Item | Description |
Variable Name | The name of the placeholder, which can be customized and modified. |
Type | The type of placeholder. Types include expression, value, and acceleration. The type cannot be modified. |
Variable Type | Supports text, numeric, date-year, date-year quarter, date-year month, date-year week, date-year month day, date-year month day hour minute second. |
Query Default Value | The default value takes effect in two modes: Dataset Only and Global Effectiveness:
The input box can contain up to 150 characters. Note The default value of an expression placeholder must be a complete expression, such as: area = "Northeast". |
Operation | Click the |
Value placeholder
Pass a value or set of values through the query control on the dashboard.
If the placeholder represents a date, select a specific date format to manage the input value's format.
Format: '$val{PlaceholderName}'
Sample SQL Code:
SELECT * FROM tablename
WHERE area in ('$val{area_ph}') -- Text type multiple selection
AND name = '$val{name_ph}' -- Text type single selection
AND number = $val{number_ph} -- Numeric type
AND report_date > '$val{report_date_ph.get(0)}' -- Date type get start date of date range control
AND report_date < '$val{report_date_ph.get(1)}' -- Date type get end date of date range control
Expression placeholder
Pass a condition through the query control on the dashboard.
When users need to modify the filter method in the dashboard's filter conditions, an expression placeholder is used to incorporate the entire filter condition into the SQL.
Format: $expr{PhysicalFieldName:PlaceholderName}
Sample SQL Code:
SELECT report_date,
 order_level,
 shipping_type,
 area,
 price,
 order_number
from company_sales_record
where $expr{report_date :report_date}
and $expr{order_level :order_level}
and $expr{order_number :order_number}
Tag placeholder
Retrieve the current user's tag value using the tag placeholder.
Format: $tag{UserTagName}
For instance, to ensure an employee only sees data from the North area and specific products, configure the user's tag as follows:
Area:
NorthProduct:
Product A, Product B
Sample SQL Code Segment:
select * from table_name
where
area = '$tag{Area}'
and
product in ('$tag{Product}')
The system automatically retrieves the user's tags during data access. Example of runtime SQL:
select * from table_name
where
area = 'North'
and
product in ('Product A', 'Product B')
System placeholder
System placeholders function like other placeholders and can be used in SQL and calculated fields. They support the following four system placeholders:
Username (logon account):
$system{accountName}User Nickname (within organization):
$system{userNick}User ID (within Quick BI system):
$system{userId}Third-party system user ID (Alibaba Cloud ID):
$system{accountId}
Sample SQL Statement:
select
  *
from
  company_sales_record
where
  customer_name = '$system{accountName}'
  and customer_name = '$system{userNick}'
Condition placeholder
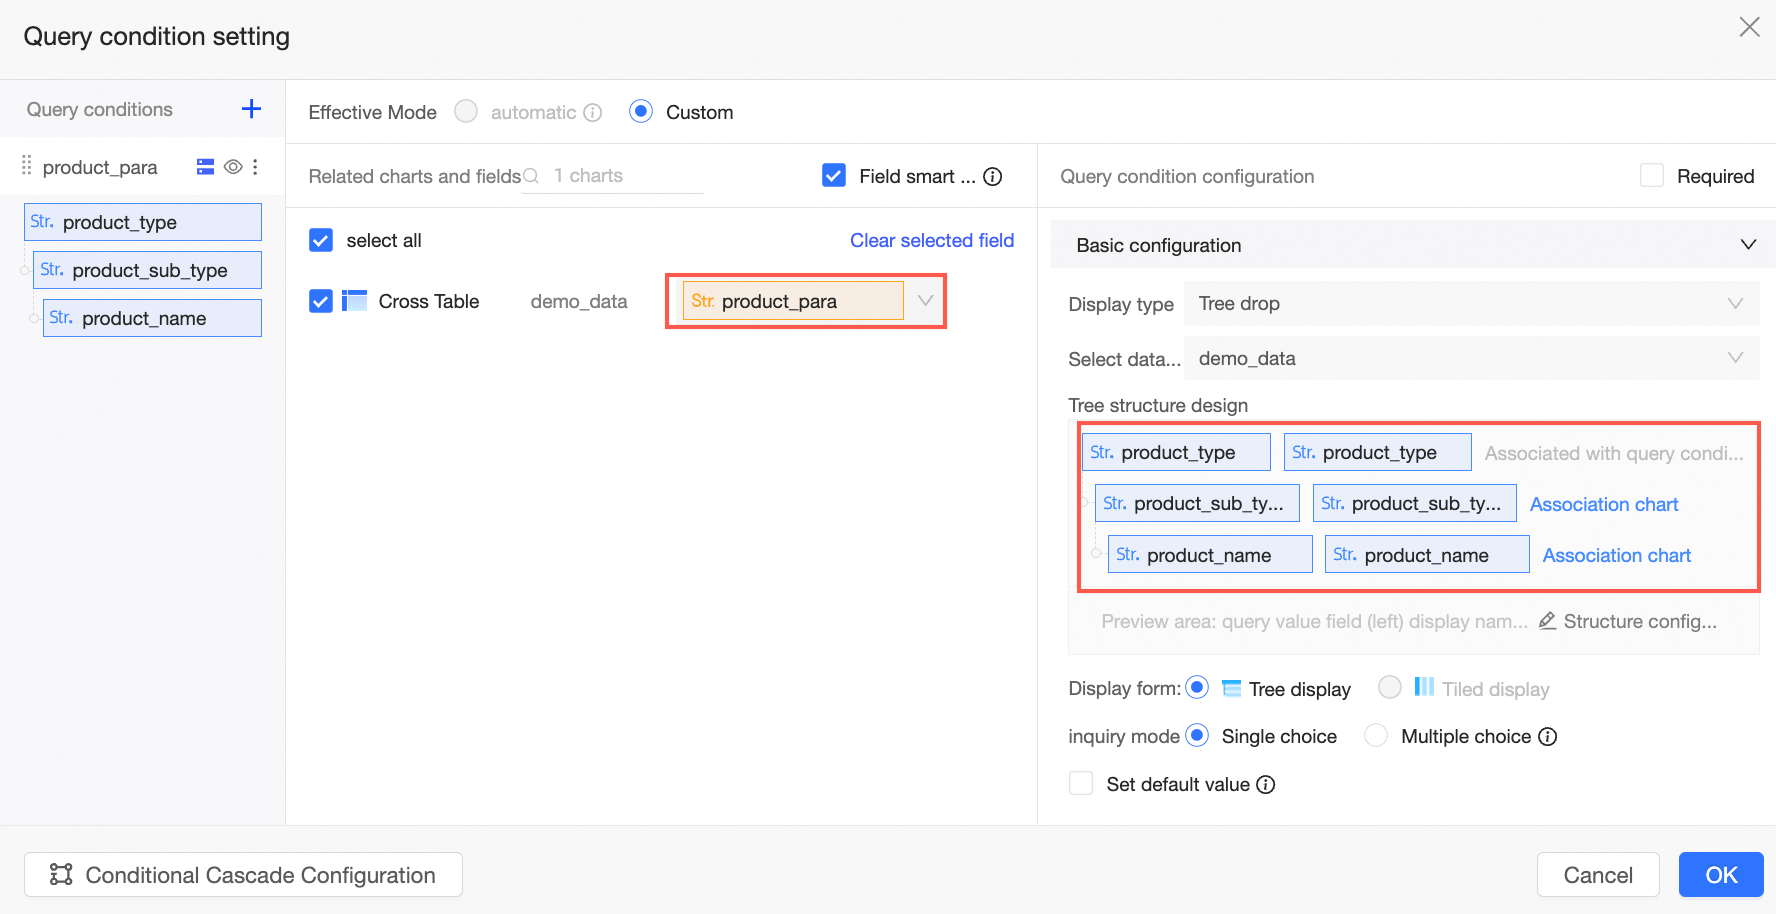
Pass a set of values through the tree dropdown query control on the dashboard.
Format: '$condition{PrimaryField, SecondaryField: PlaceholderName}'
The number of fields is limited to a maximum of 10 and must align with the tree structure of the query control.
Sample SQL Statement:
select
 *
from
 company_sales_record
where
 $condition{product_type,product_sub_type,product_name :product_para}
The configuration of the query control is as follows:
Acceleration placeholder
Acceleration placeholders accelerate data extraction in custom SQL that includes time parameters. You can place an acceleration placeholder in the WHERE condition. The Quick BI engine then dynamically replaces the time window during extraction and performs incremental offline extraction based on your configuration.
Format: $accel{PhysicalFieldName:PlaceholderName}
Sample SQL code:
select
  *
from
  company_sales_record
where
$accel{report_date:report_date}Only acceleration placeholders support extraction acceleration by the Quick BI engine. Other types of placeholders do not support this feature.
Each dataset supports only one acceleration placeholder.
Do not use acceleration placeholders in calculated fields.
Acceleration placeholders work only at the dataset layer for custom SQL execution and accelerated extraction. They do not work in chart queries or appear in query controls.
Query default value: To prevent custom SQL queries from timing out, you can set a default value for the acceleration placeholder.
Example: The default value for an acceleration placeholder must be a complete filter expression, not just a date value, such as report_date<'2025-04-01'.

Acceleration configuration: For a dataset that has an acceleration placeholder, select the placeholder field as the date field in the acceleration settings. Configure the extraction time range and incremental granularity to complete the acceleration task.
Scenarios
Scenario 1 - Dynamically Adjust Calculated Field Result Values
Scenario description
Use calculated fields and placeholders in expressions to dynamically alter the values of calculated fields by passing different placeholder values.
For instance, orders exceeding the placeholder value are considered large orders; otherwise, they are small orders. Adjust the criteria for order size dynamically using query controls, and the chart will refresh to reflect the changes.
Procedure
Create a placeholder.
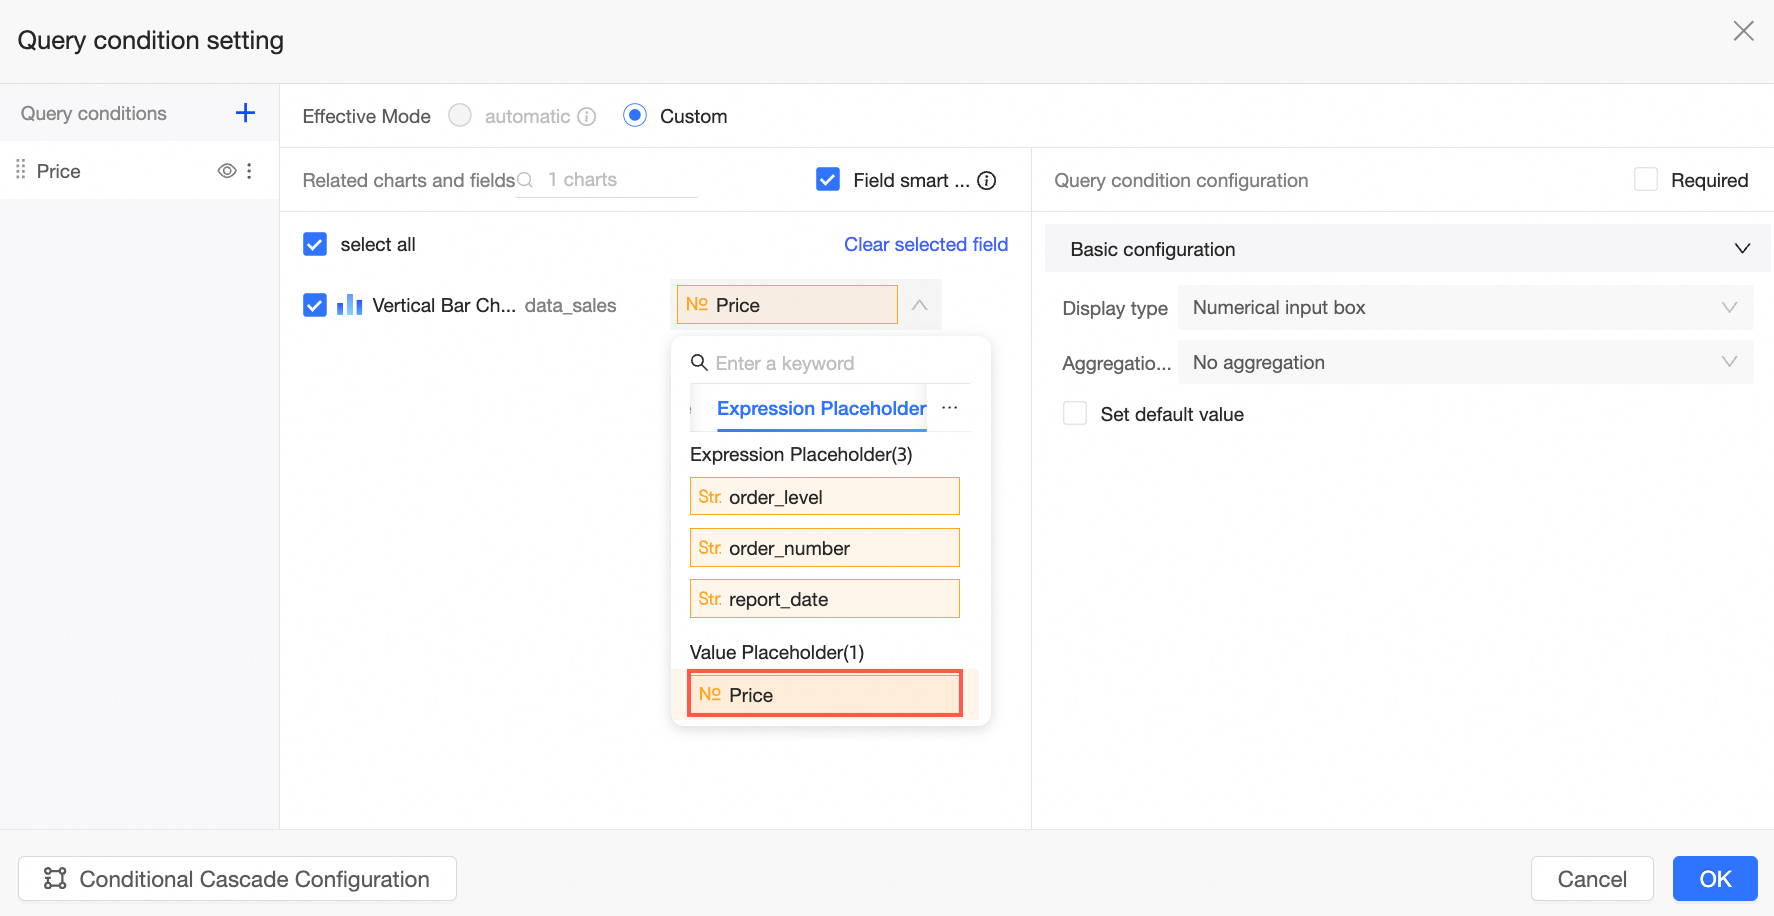
On the custom SQL editing page or dataset editing page, click Placeholder Management -> Create Placeholder.

Input the variable name Price, select Value Placeholder as the type, choose Numeric for the variable type, set the query default value to Global Effectiveness, and optionally, the default value to 100.
NotePlaceholders used in calculated fields must have a globally effective default value.

Create Calculated Field.
On the dataset editing page, click Create Field and establish the Order Scale field as depicted in the image.

Field expression example:
case when [price]>$val{Price}
then 'Large Order'
else 'Small Order'
end
Click Confirm and Save the dataset.
Create Visualization Chart and Query Control.
Begin analysis by creating a dashboard.
Add a Bar Chart on the dashboard editing page as shown in the image.

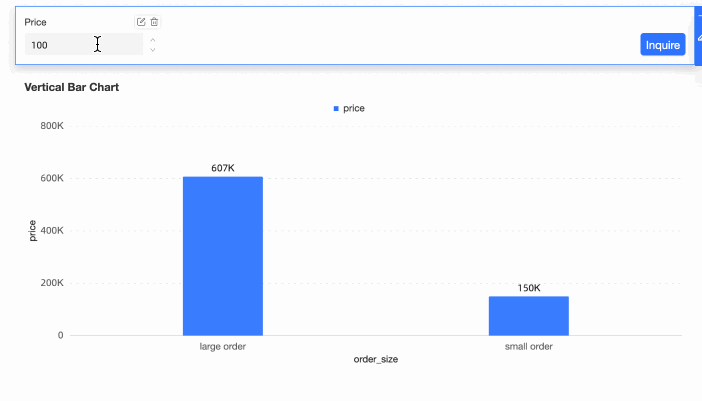
Drag the order size field to the category axis/dimension, place the price field on the value axis/measure, and click Update. The bar graph will display as follows:
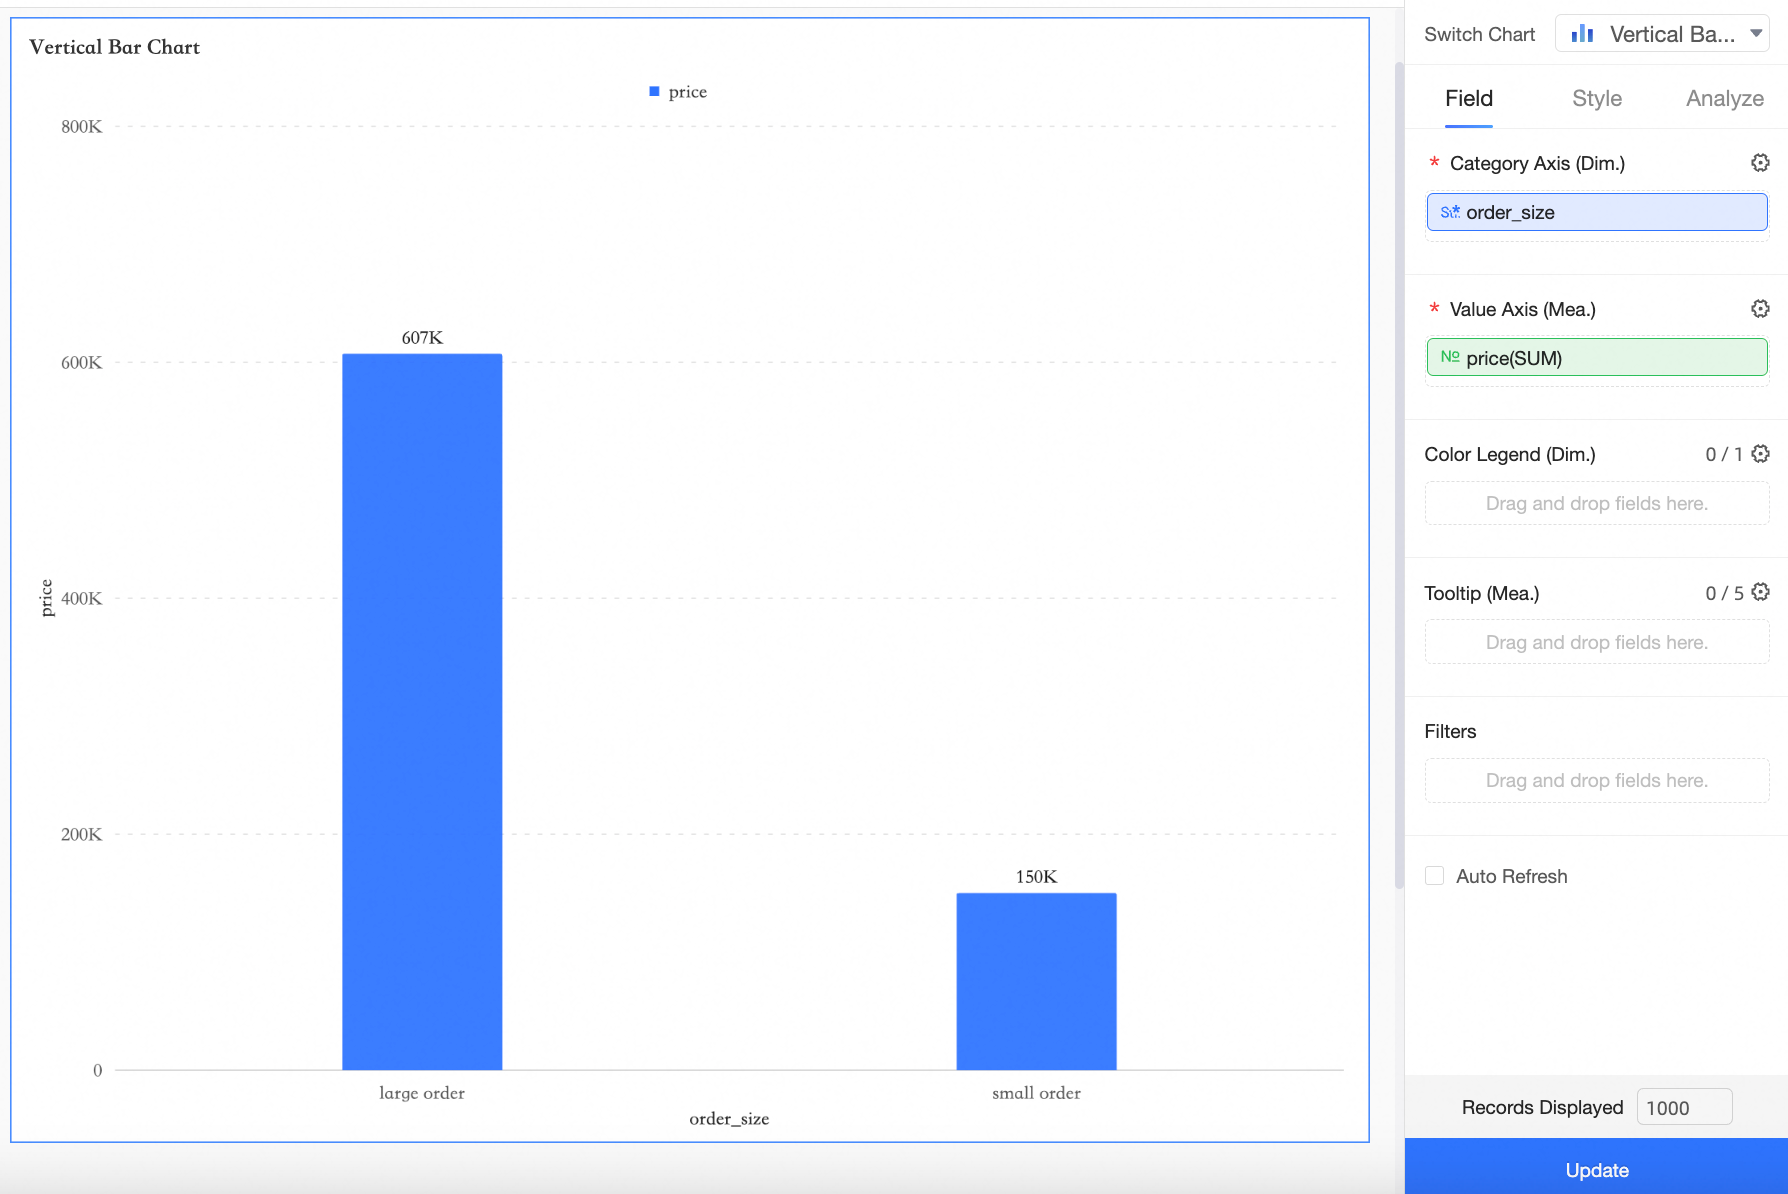
Currently, the measure field price distinguishes between large and small orders based on the default placeholder value of 100 for Price.
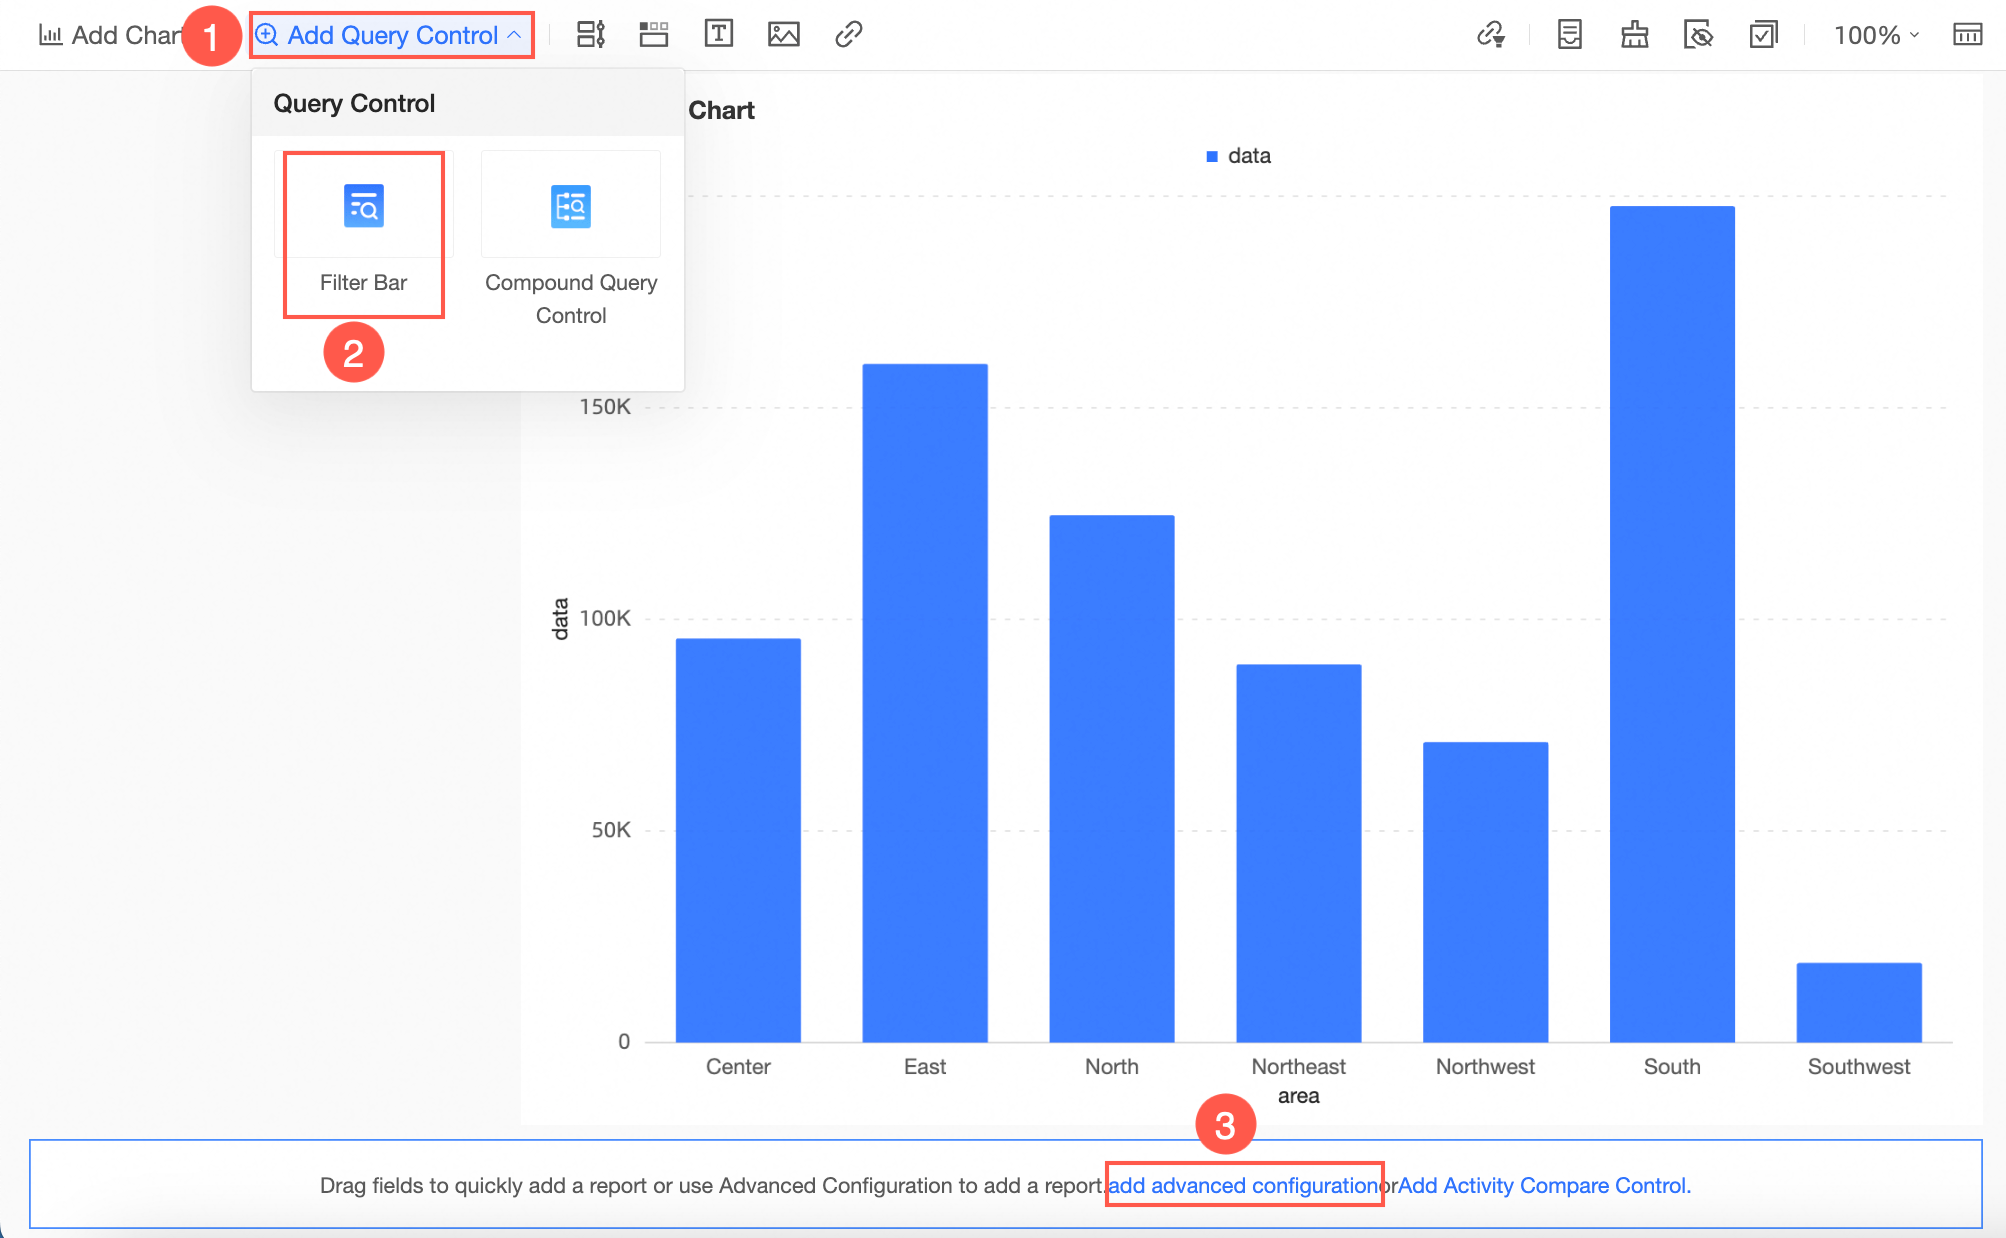
Create a query control as illustrated.
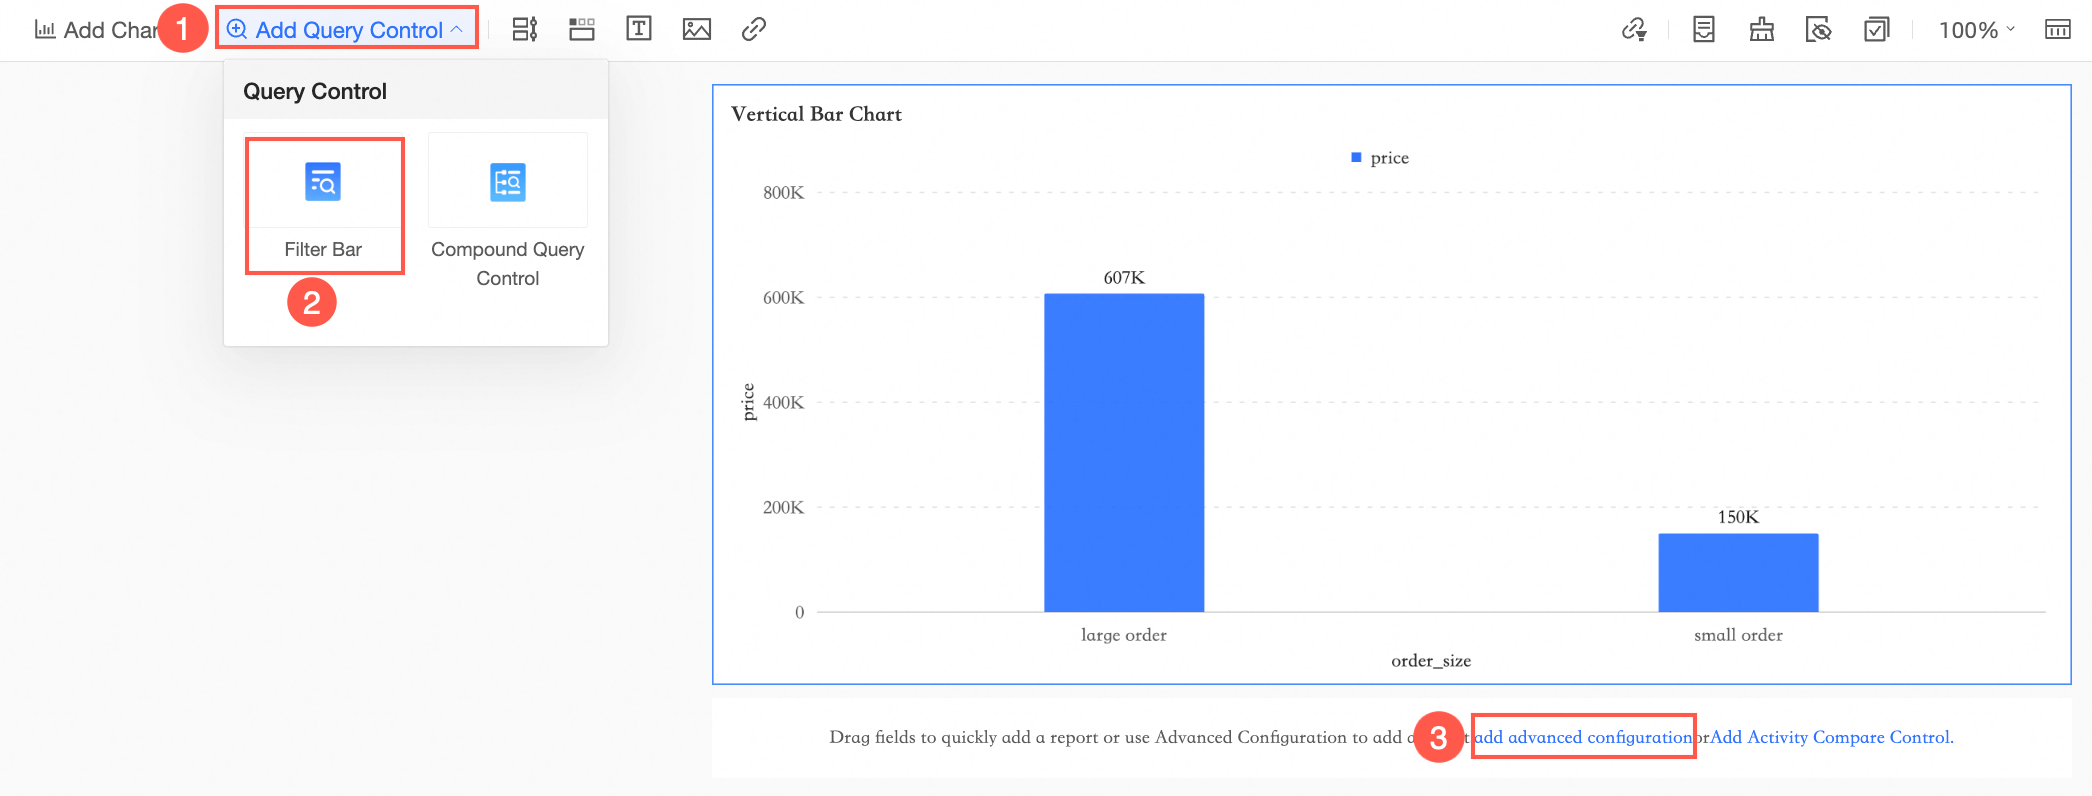
In the query condition settings interface, designate the placeholder Price as the query condition.
View the effect.
You can now adjust the criteria for large and small orders by entering values in the query control.
For example, when the query control value is set to 100, the large order amount is 607,200. If the query control value is changed to 150, the large order amount becomes 525,000.
Scenario 2 - Flexibly Switch Indicators or Analysis Dimensions
Scenario description
Utilize this feature to switch between multiple indicators and dimensions on a chart, avoiding clutter or redundancy from creating multiple charts.
Consider the example of switching indicator dimensions.
Procedure
Create Placeholder.
On the custom SQL editing page or dataset editing page, click Placeholder Management -> Create Placeholder.

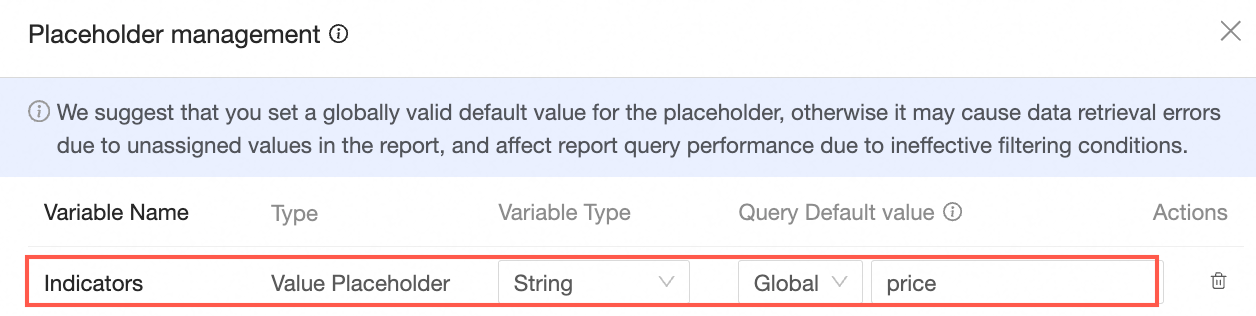
Enter the variable name Indicator, set the type to Value Placeholder, choose Text for the variable type, set the query default value to Global Effectiveness, and the default value to Unit Price.
Create Calculated Field.
Click Create Field and establish the Data field as shown in the image.

Field expression example:
case when '$val{Indicator}'='Order Amount' then [Order Amount] when '$val{Indicator}'='Profit Amount' then [Profit Amount] when '$val{Indicator}'='Unit Price' then [Unit Price] when '$val{Indicator}'='Shipping Cost' then [Shipping Cost] else 0 endNoteText type placeholders should be enclosed in single quotes, such as '$val{Indicator}'.
Click Confirm and Save the dataset.
Create Visualization Chart and Query Control.
Begin analysis by creating a dashboard.
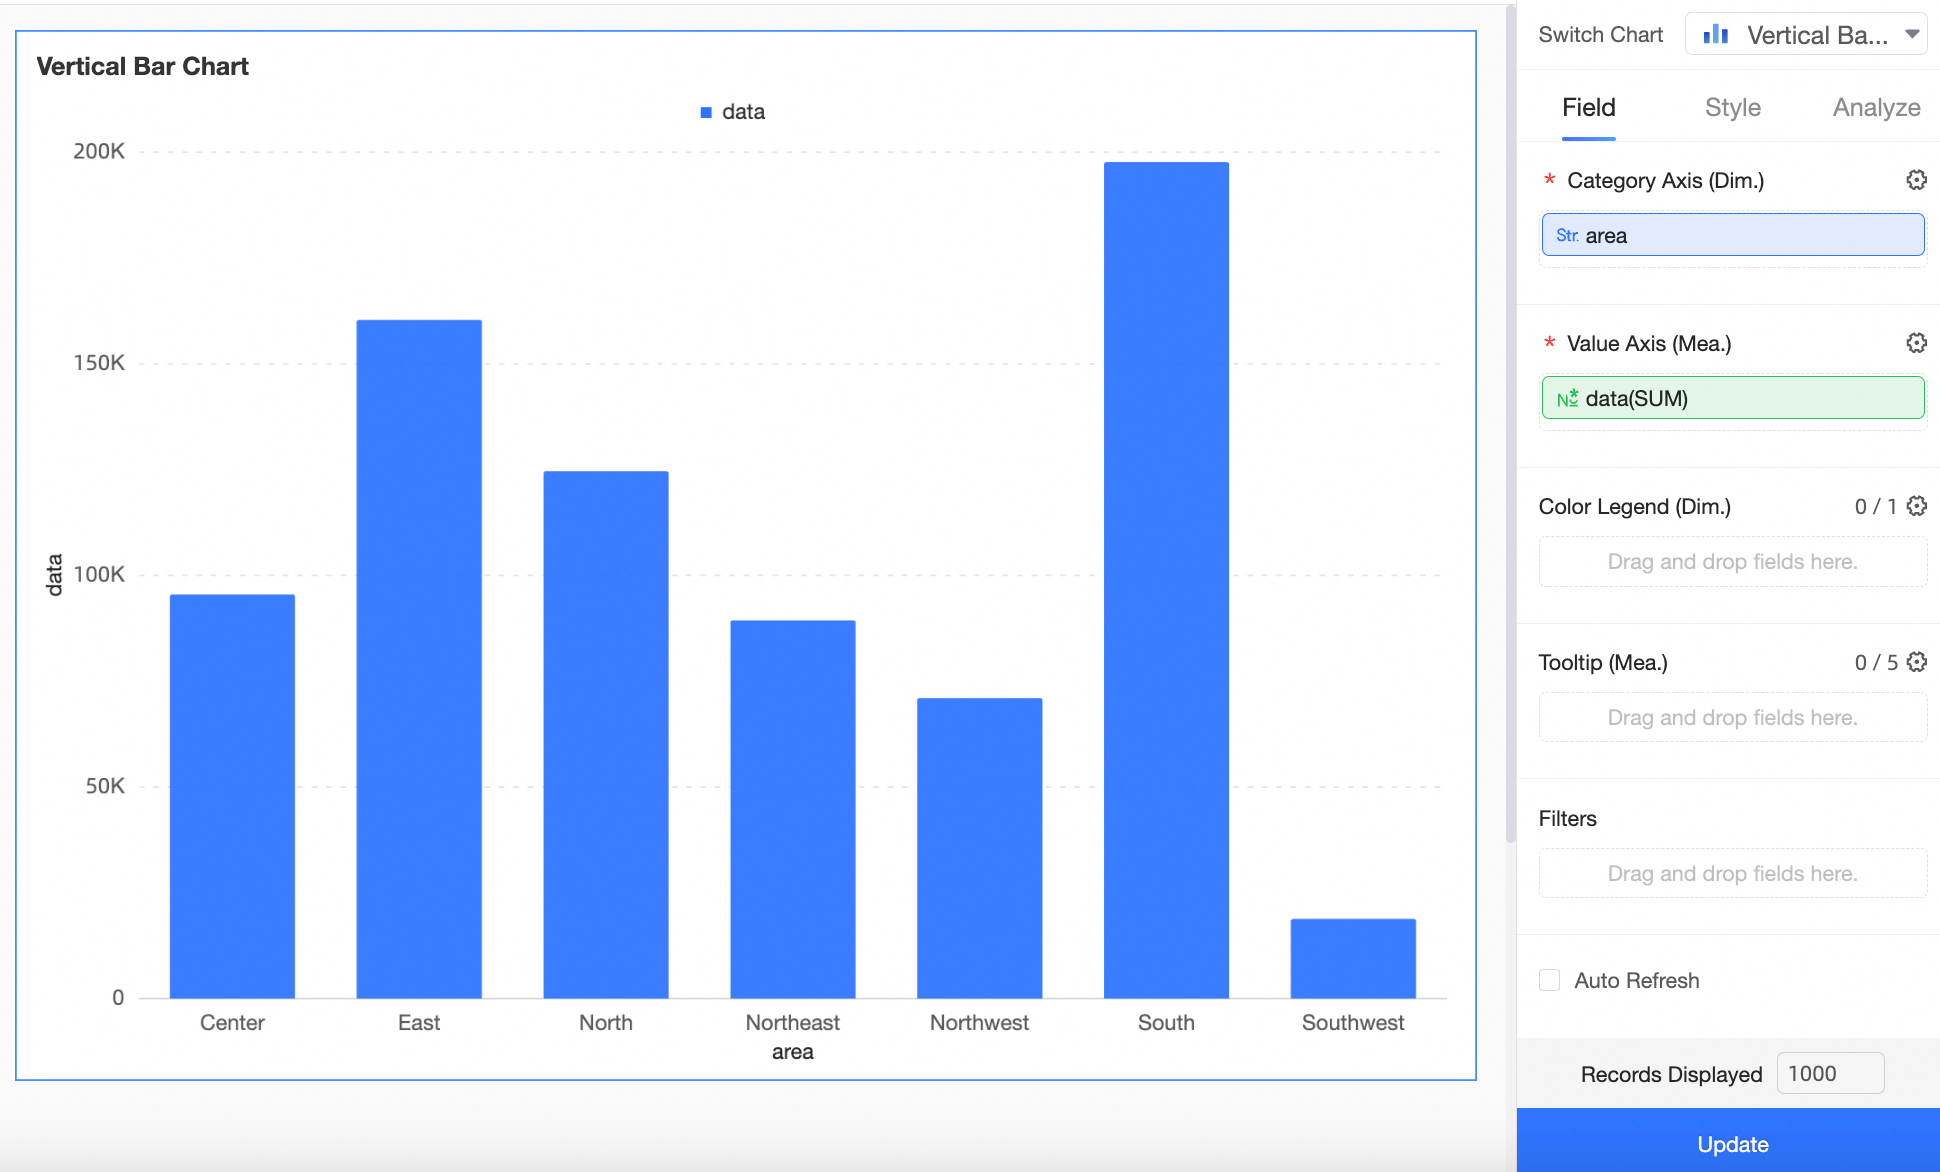
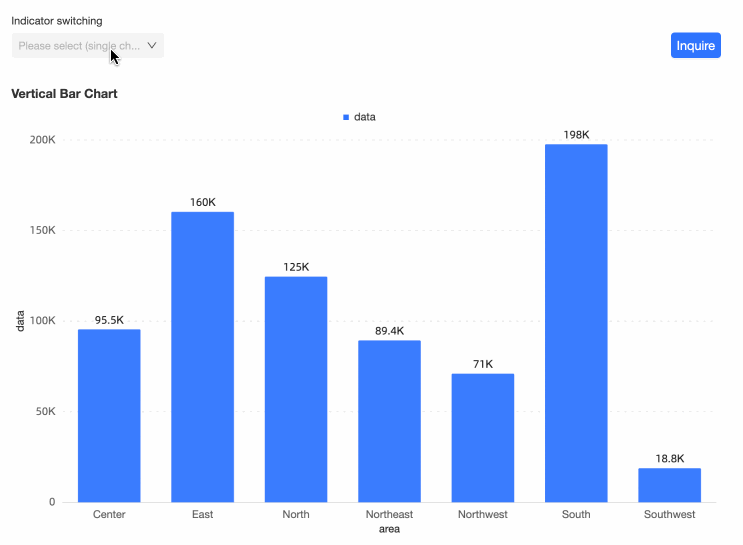
On the dashboard editing page, add a Bar Chart as shown in the image.

Drag the Area field to the Category Axis/Dimension, place the Data segment on the Value Axis/Measure, and click Update. The bar chart will display as follows:
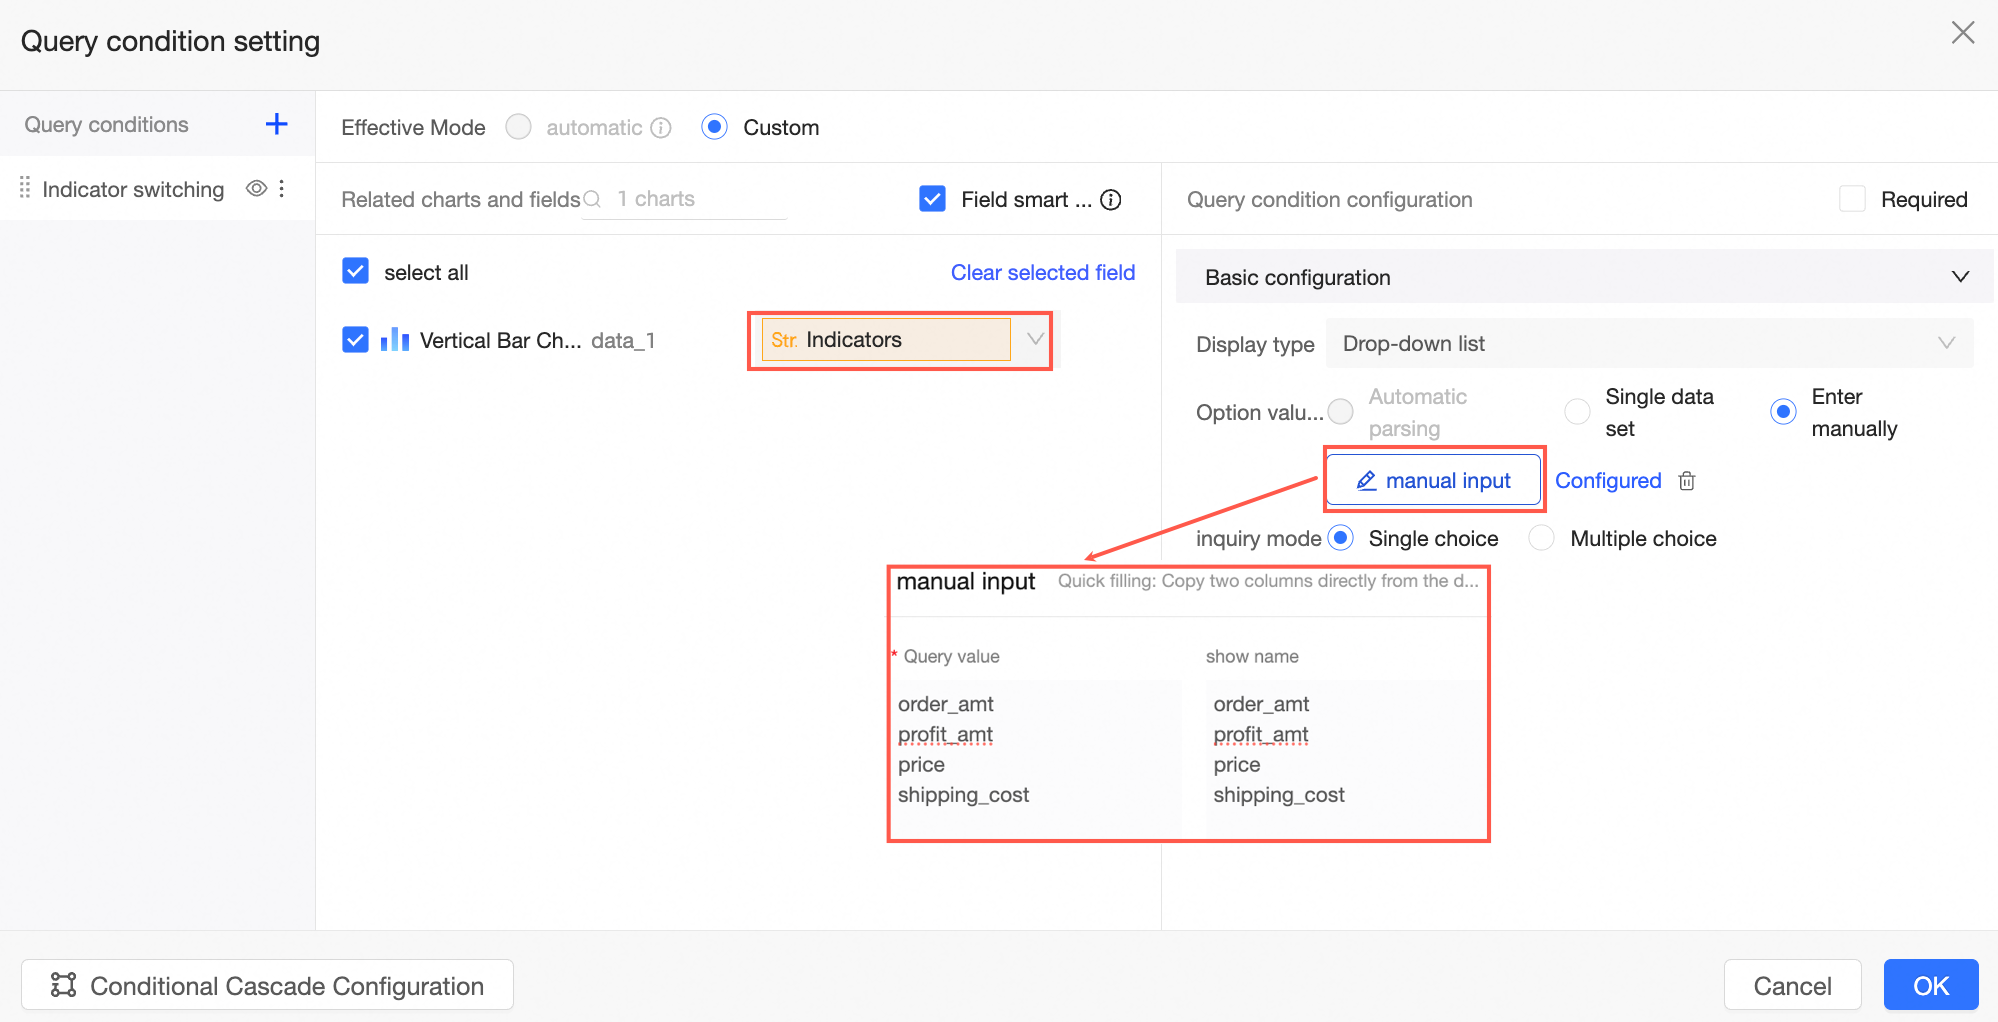
Create a query control as depicted in the image.
In the query condition settings interface, set the placeholder Indicator as the query condition. Opt for Manual Input as the source of option values and configure the Manually Entered values.
View the Effect.
You can now switch between different indicators by filtering the values in the query control.
Scenario 3 - Dynamically Adjust Auxiliary Line
Scenario description
Link the auxiliary line's value to a placeholder so that when the placeholder's value is updated, the auxiliary line adjusts accordingly.
For example, if the auxiliary line represents a monthly sales KPI, you can dynamically update its position each month through the query control without needing to edit the report again.
Procedure
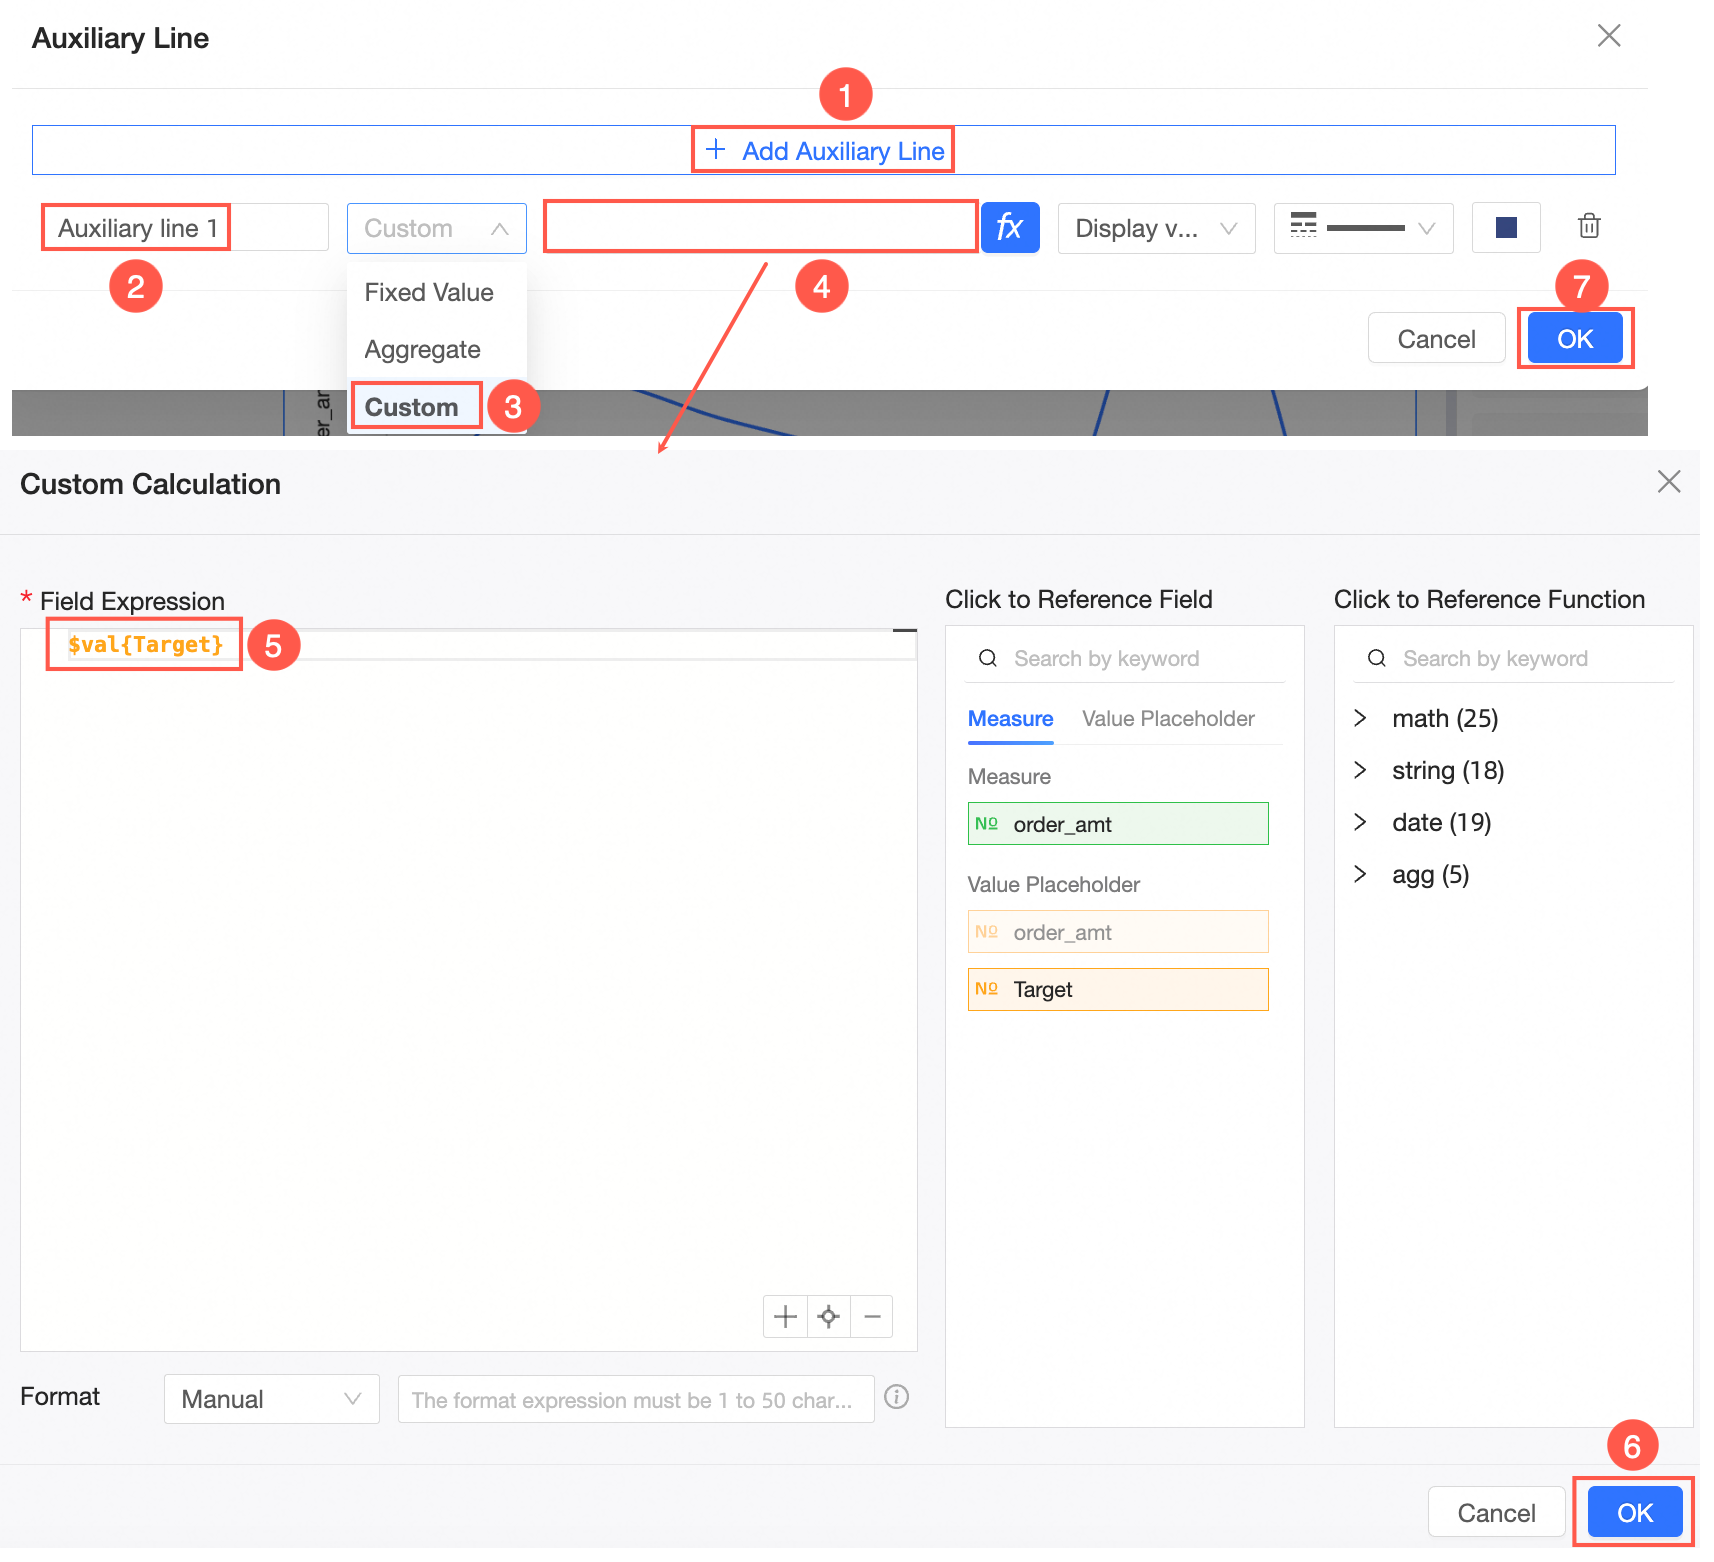
Create a placeholder.
NoteAuxiliary line placeholders only support numeric types.
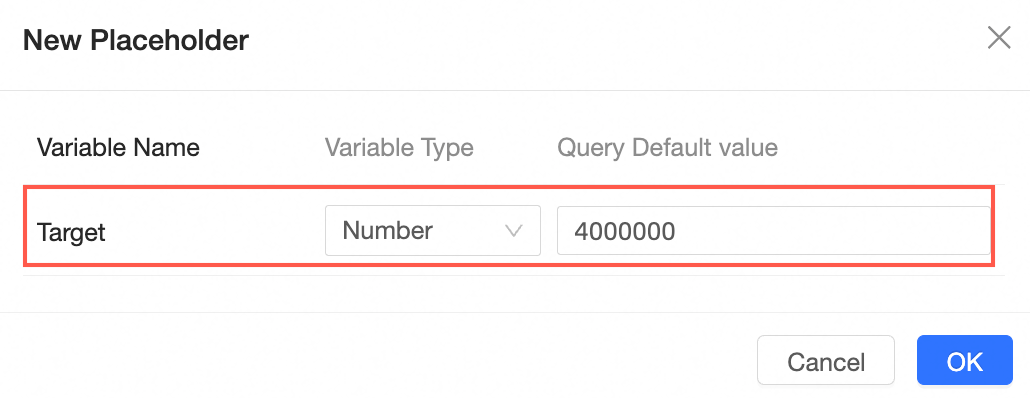
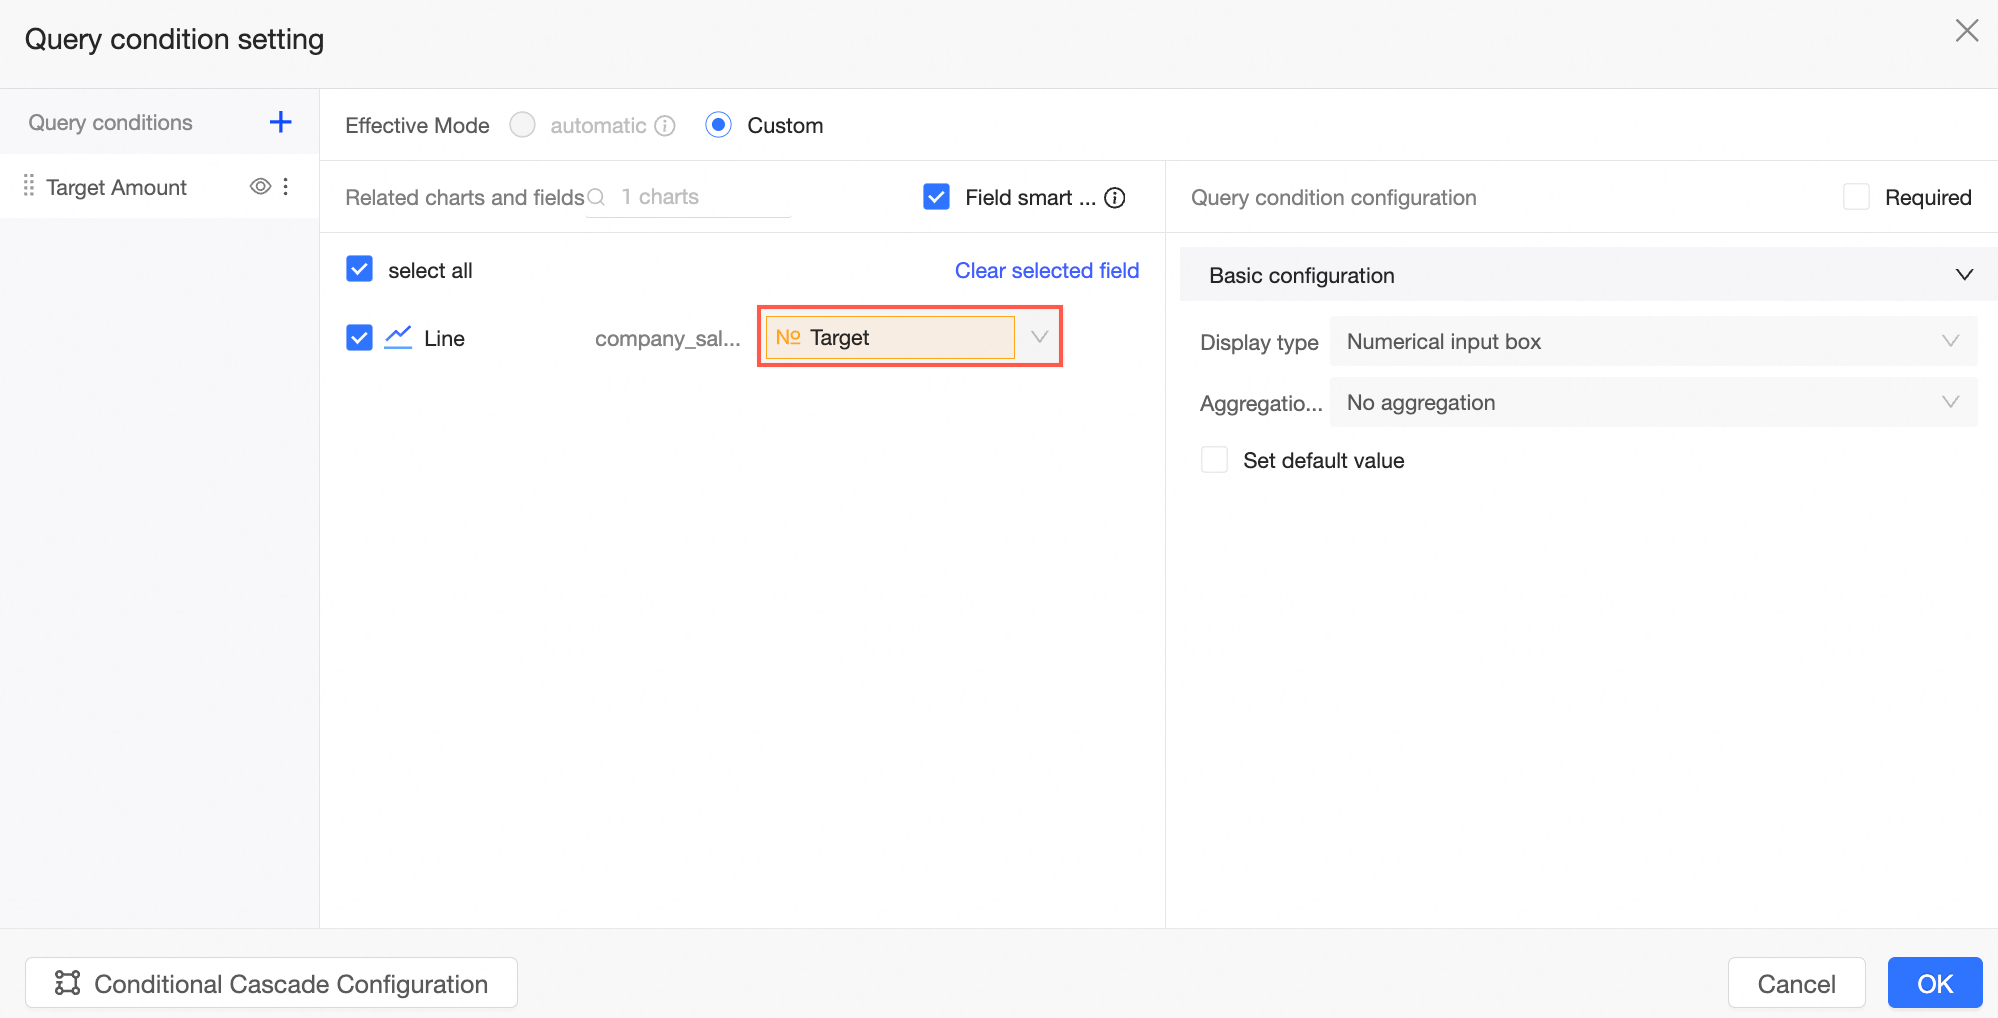
On the dashboard editing page, create a placeholder as illustrated.
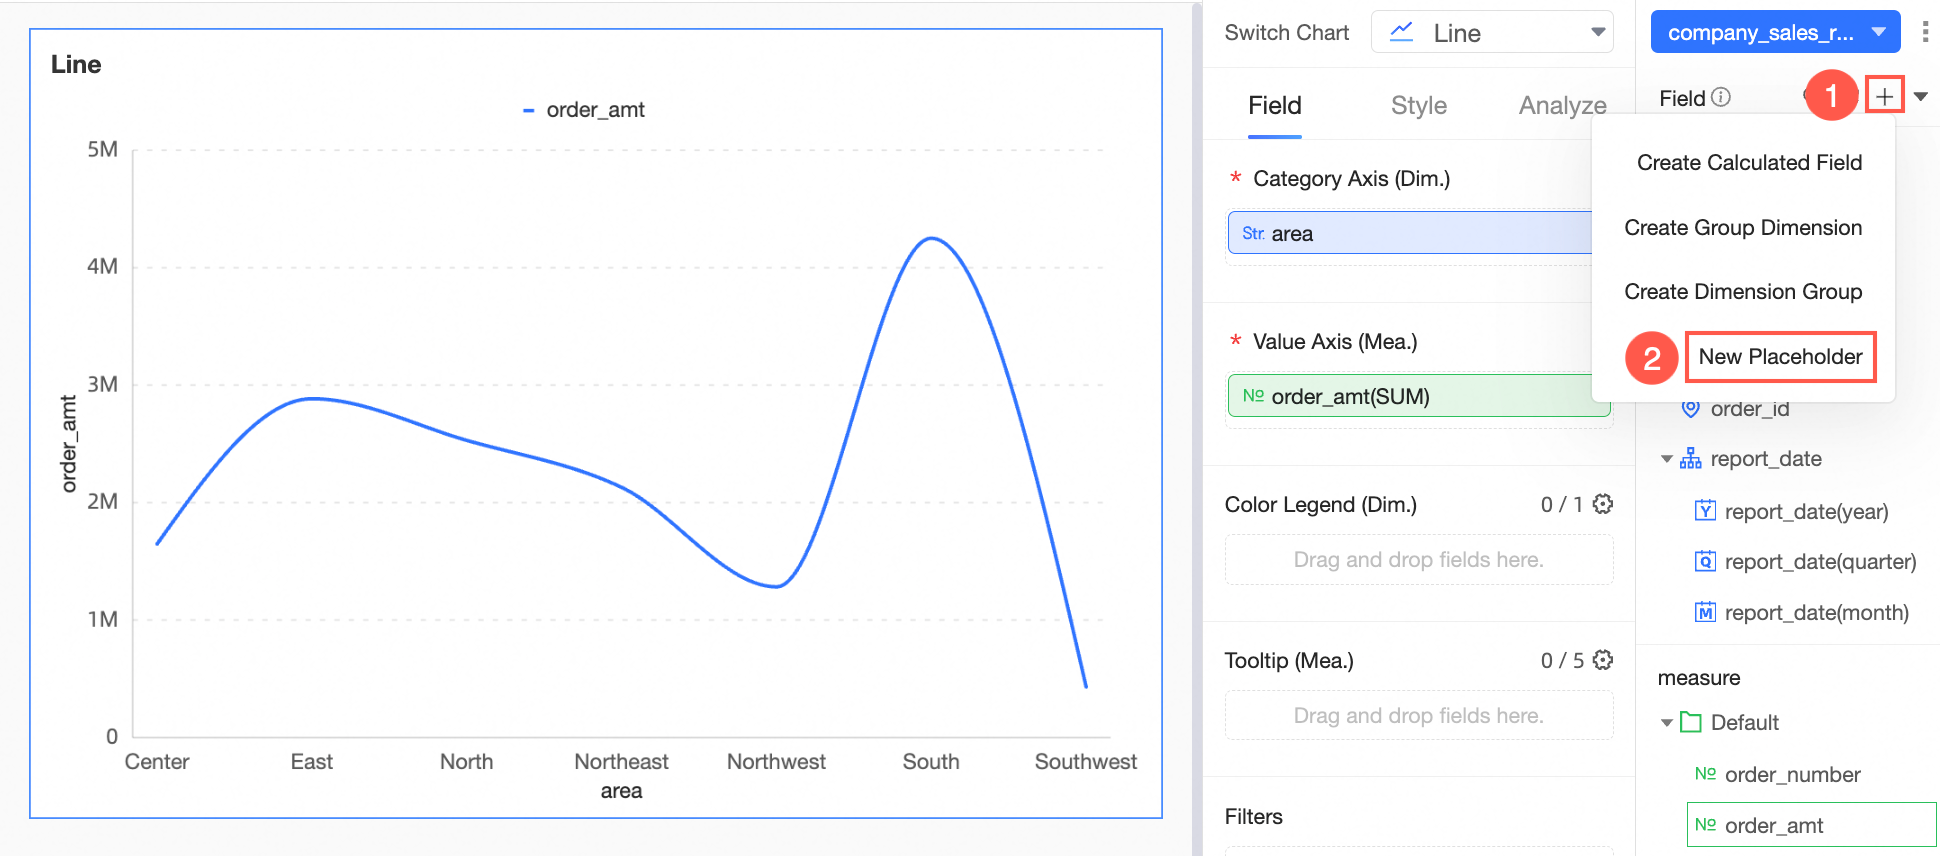
Input the variable name Target, set the variable type to Numeric, the query default value to Global Effectiveness, and the default value to 4,000,000.
NotePlaceholders used in auxiliary lines must have a globally effective default value.
Set Auxiliary Line.
In the Analysis tab, locate the auxiliary line and click the pencil icon to edit.
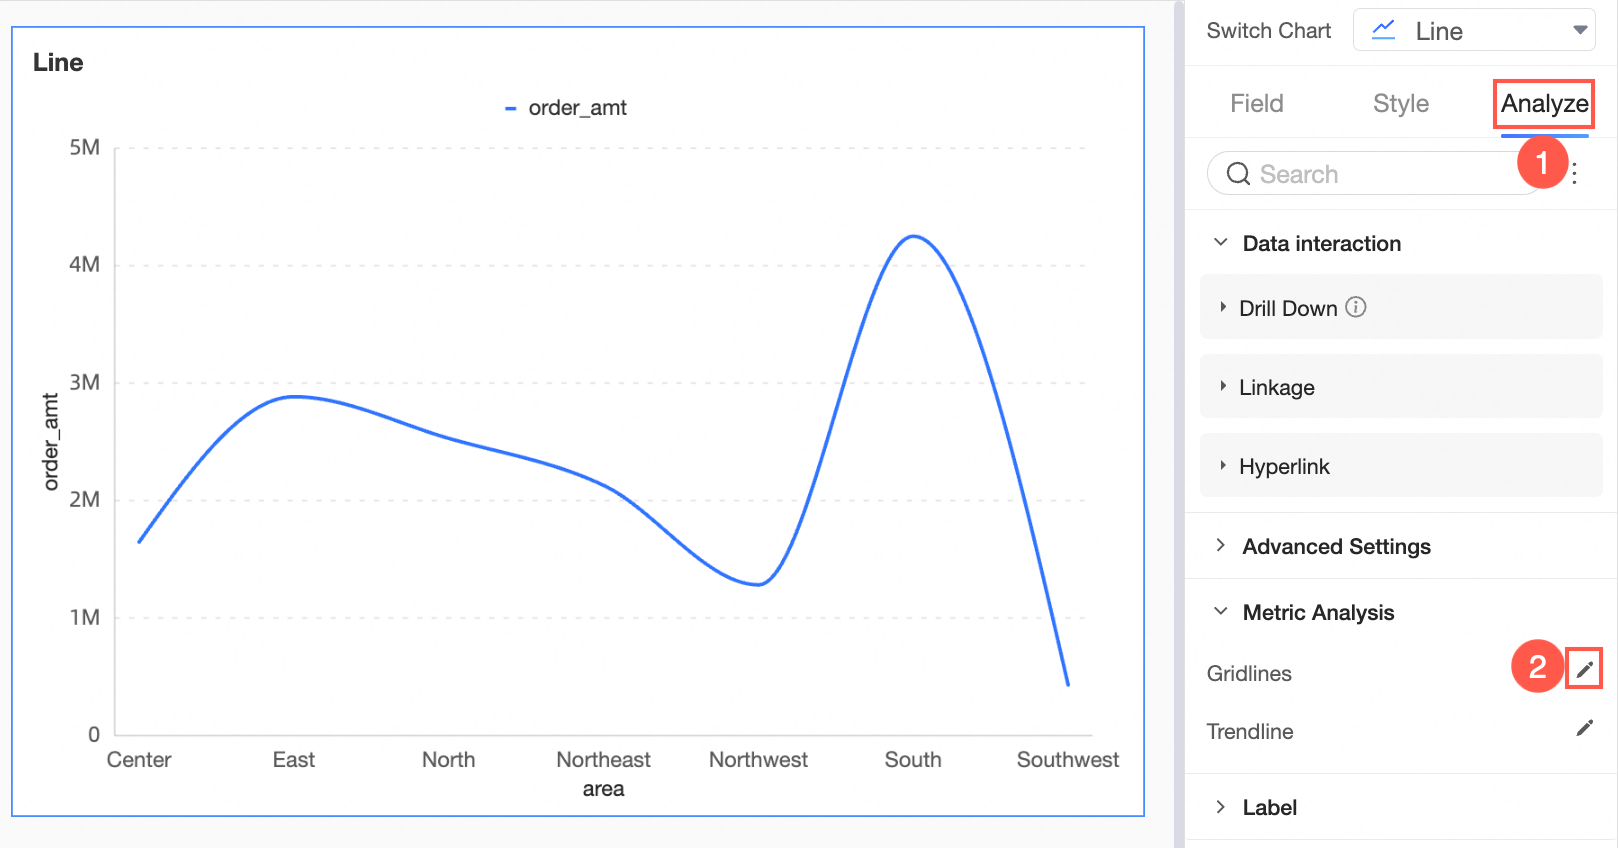
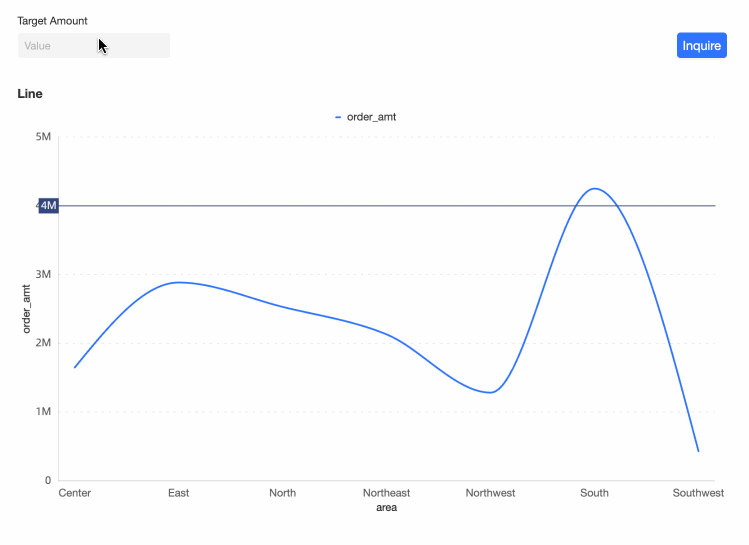
Configure and add the auxiliary line as shown, setting its value to the placeholder Target.
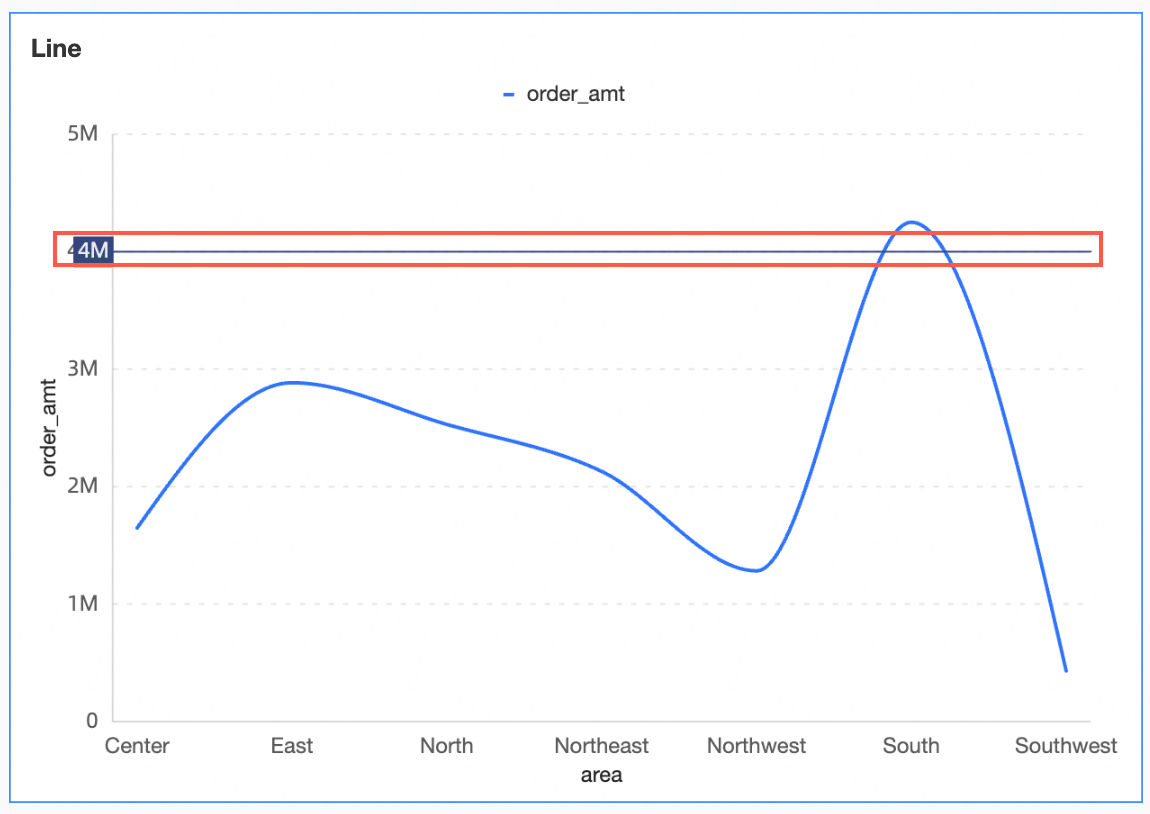
The chart now displays the auxiliary line at the 4 million mark.
Create Query Control.
Generate a query control as shown in the image.
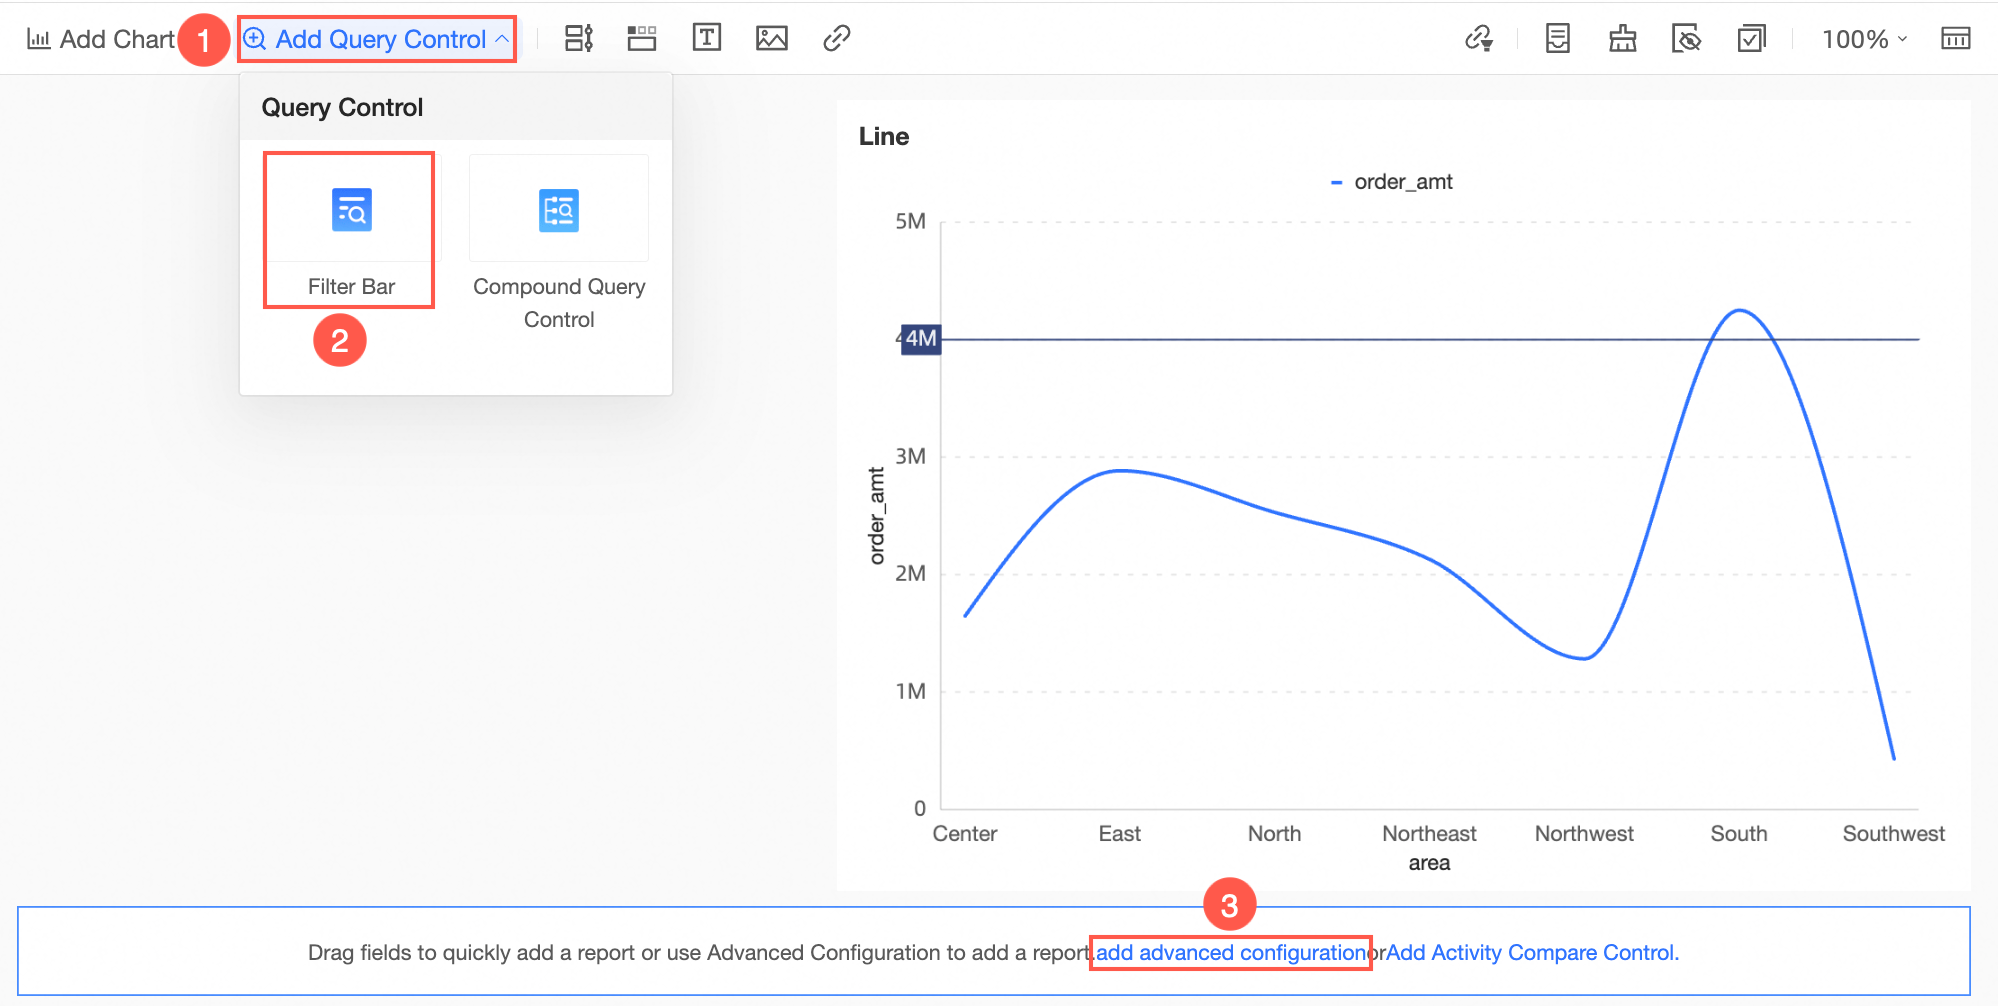
Set the placeholder Target as the query condition and click Confirm.
View the Effect.
Alter the auxiliary line's position by changing the values in the query control.
Scenario 4 - Use Placeholders in SQL Code to Achieve Dynamic Adjustment and Filtering of Field Result Values
Scenario description
Incorporate placeholders into SQL code when creating a dataset to dynamically adjust and filter field result values by modifying placeholder values.
Procedure
On the dataset editing page, click Click To Create Dataset Using SQL Code on the canvas or Create Table with SQL Code on the left panel.

After entering the SQL code
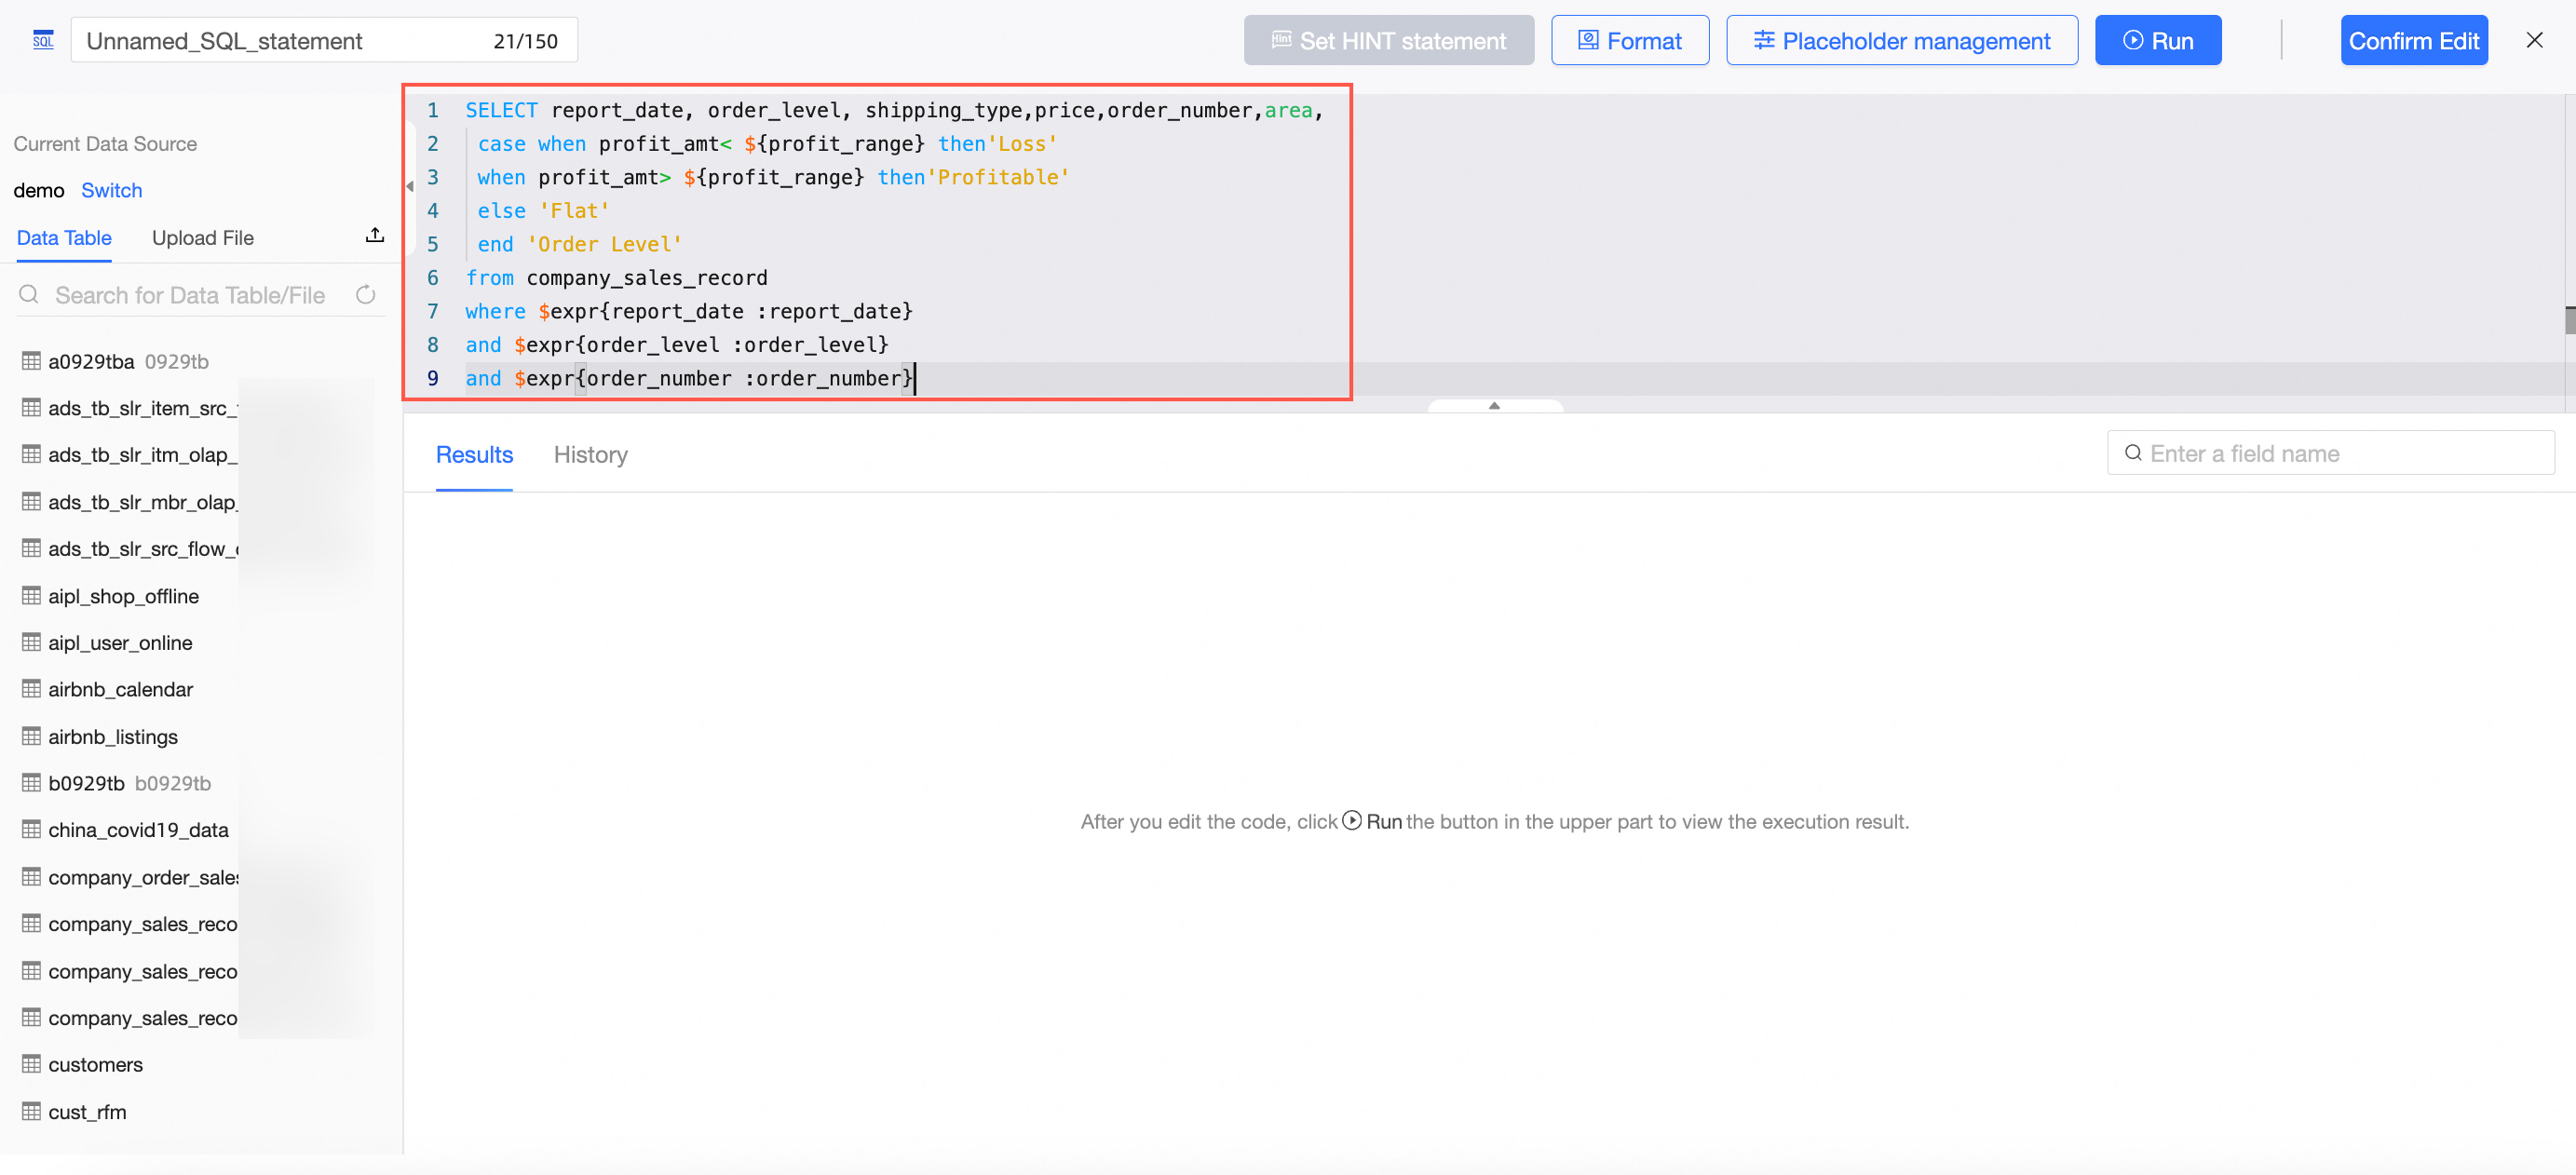
Sample SQL Statement:
SELECT report_date, order_level, shipping_type,price,order_number,area,
 case when profit_amt< ${profit_range} then'Loss'
 when profit_amt> ${profit_range} then'Profit'
 else 'Break-even'
 end 'Order Level'
from company_sales_record
where $expr{report_date :report_date}
and $expr{order_level :order_level}
and $expr{order_number :order_number}
Click Placeholder Management.

Access the placeholder management interface and input the default value.
 Note
NotePlaceholders applied after the select statement must have a globally effective default value.
In this example, the placeholder "profit_range" requires a globally effective default value.
Execute the query by clicking Run to view the results.

Finalize your edits by clicking Confirm Edit and then Save the dataset.
Create Visualization Chart and Query Control.
Begin analysis by creating a dashboard.
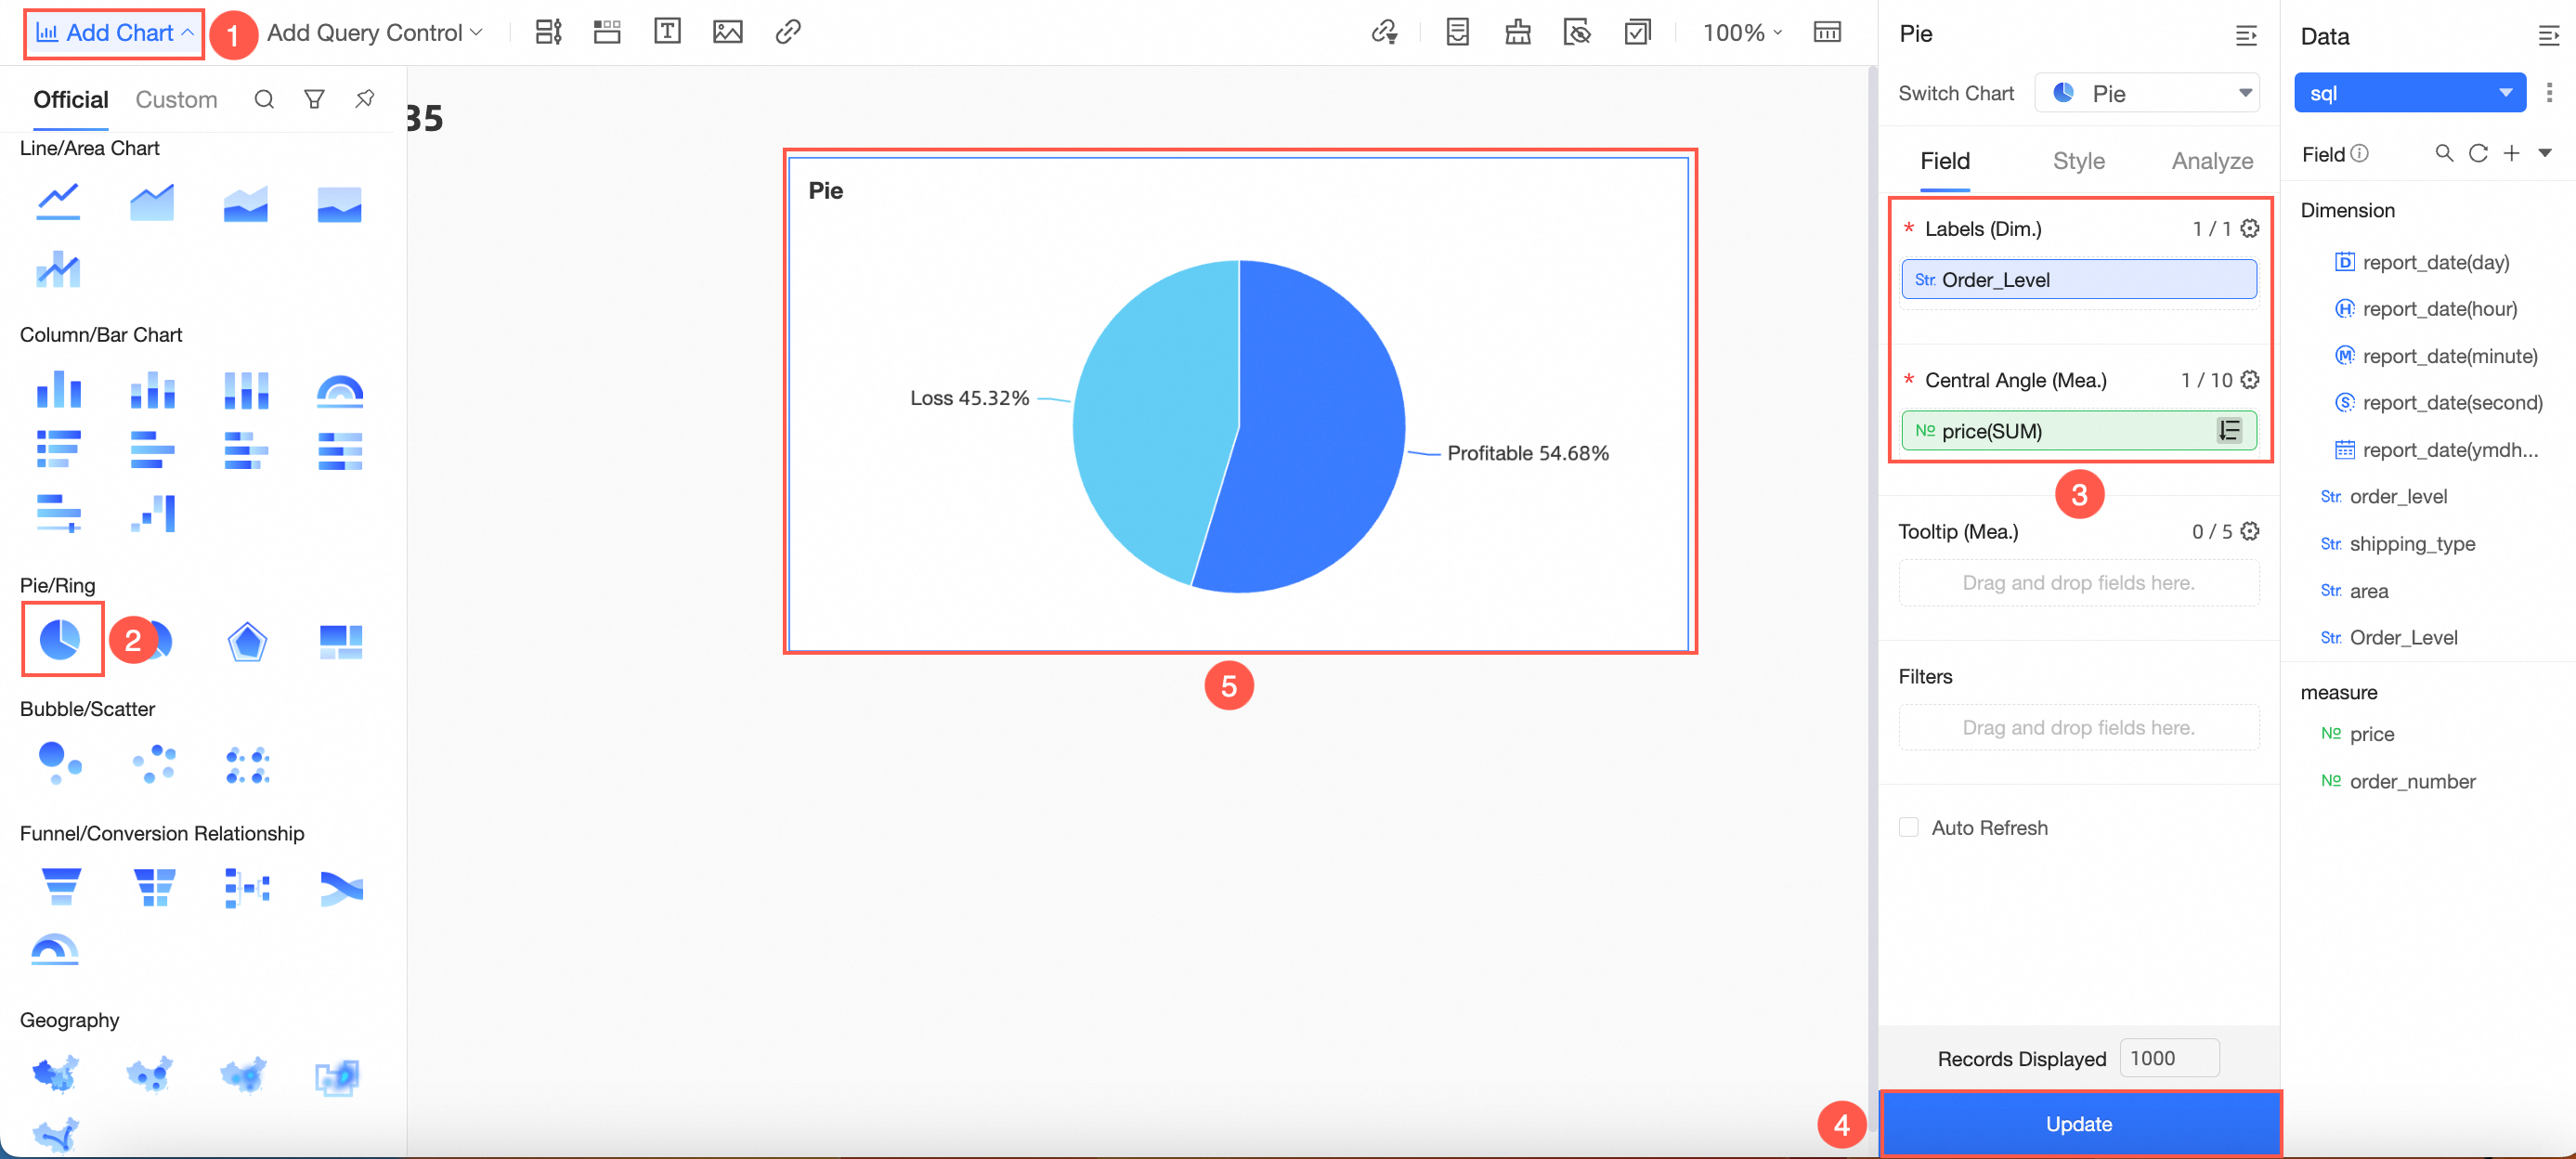
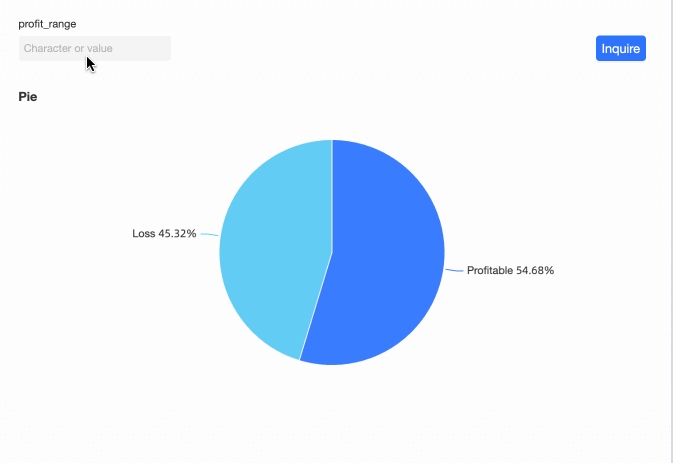
On the dashboard editing page, add a Pie Chart as depicted in the image.
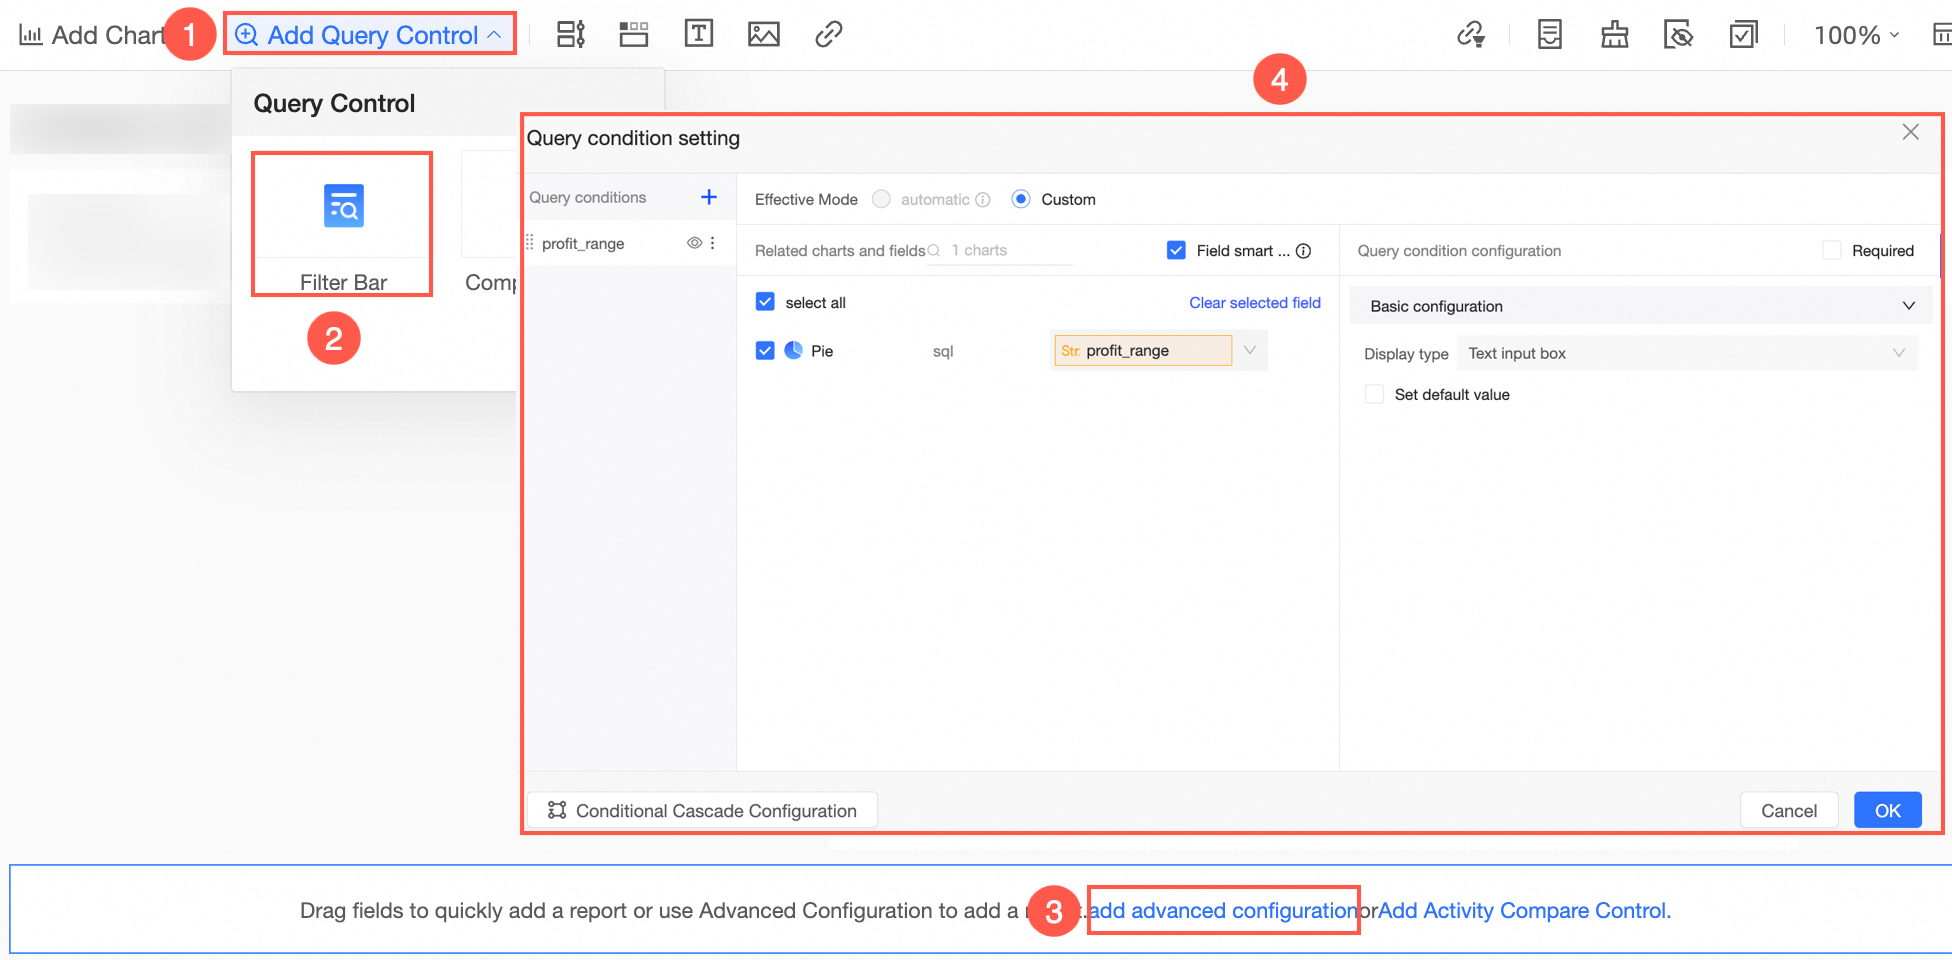
Create a query control as illustrated.
View the Effect
You can now modify the profit range criteria by entering values in the query control.
Scenario 5: Enable extraction acceleration for a dataset that contains an acceleration placeholder
Scenario description
You can add an acceleration placeholder to the WHERE condition of a custom SQL statement and set the partition size in the acceleration settings. This enables dynamic offline data extraction and incremental writing. This method is useful if the source table contains a large volume of data, which causes the original custom SQL query to time out and prevents you from configuring extraction acceleration.
Procedure
Create a placeholder.
Add an acceleration placeholder to the WHERE condition of your custom SQL statement.
Focus on the core query logic and let the placeholder handle time filtering.

Example: Add the report_date acceleration placeholder to the WHERE condition: where $accel{report_date:report_date}.
Set a query default value.
To ensure that the SQL runs quickly during editing and preview, you can set a default value for the placeholder.
In the Placeholder Management panel of the dataset, set a complete expression as the default value for the acceleration placeholder, such as report_date < '2025-04-01'.

Configure extraction acceleration.
After you save the dataset, you can configure extraction acceleration.
Enable the Quick BI engine.

For Extraction Range, select Specify Date Range. For Date Field, select the field that corresponds to the acceleration placeholder, such as report_date.

Configure the extraction date range and incremental range. Then, save and start the acceleration task.
Verify the query and acceleration effect
Use the dataset to create a chart and run a query.
On the Performance Diagnostics page of the chart, check the Widget Loading Duration and see whether the Acceleration Engine is enabled in the Widget Loading Details to confirm that acceleration is working.
