This topic describes how to add an AnalyticDB for MySQL 2.0 data source to connect Quick BI to an Alibaba Cloud AnalyticDB for MySQL 2.0 database over a public network connection. After you add the data source, you can use Quick BI to analyze and visualize data.
Prerequisites
You have created an AnalyticDB for MySQL 2.0 cluster.
If you use the cloud-native data warehouse AnalyticDB for MySQL 2.0, you can add it as a cloud data source to Quick BI for data analytics.
Limits
Only workspace administrators and developers can add data sources.
Procedure
Log on to the Quick BI console.
Add a data source:
Navigate to the page for adding data sources.
On the Alibaba Cloud Databases tab, select AnalyticDB for MySQL.
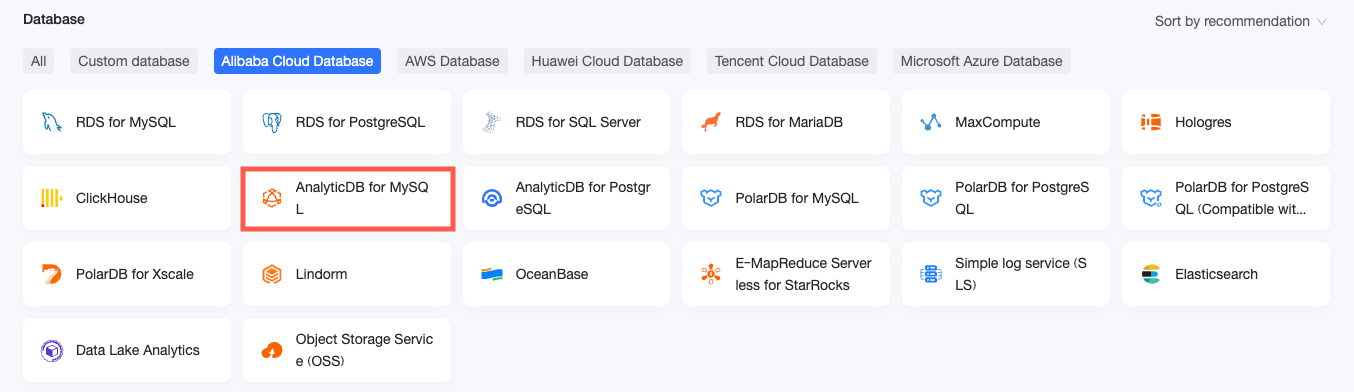
Set Database Version to Alibaba AnalyticDB for MySQL 2.0.
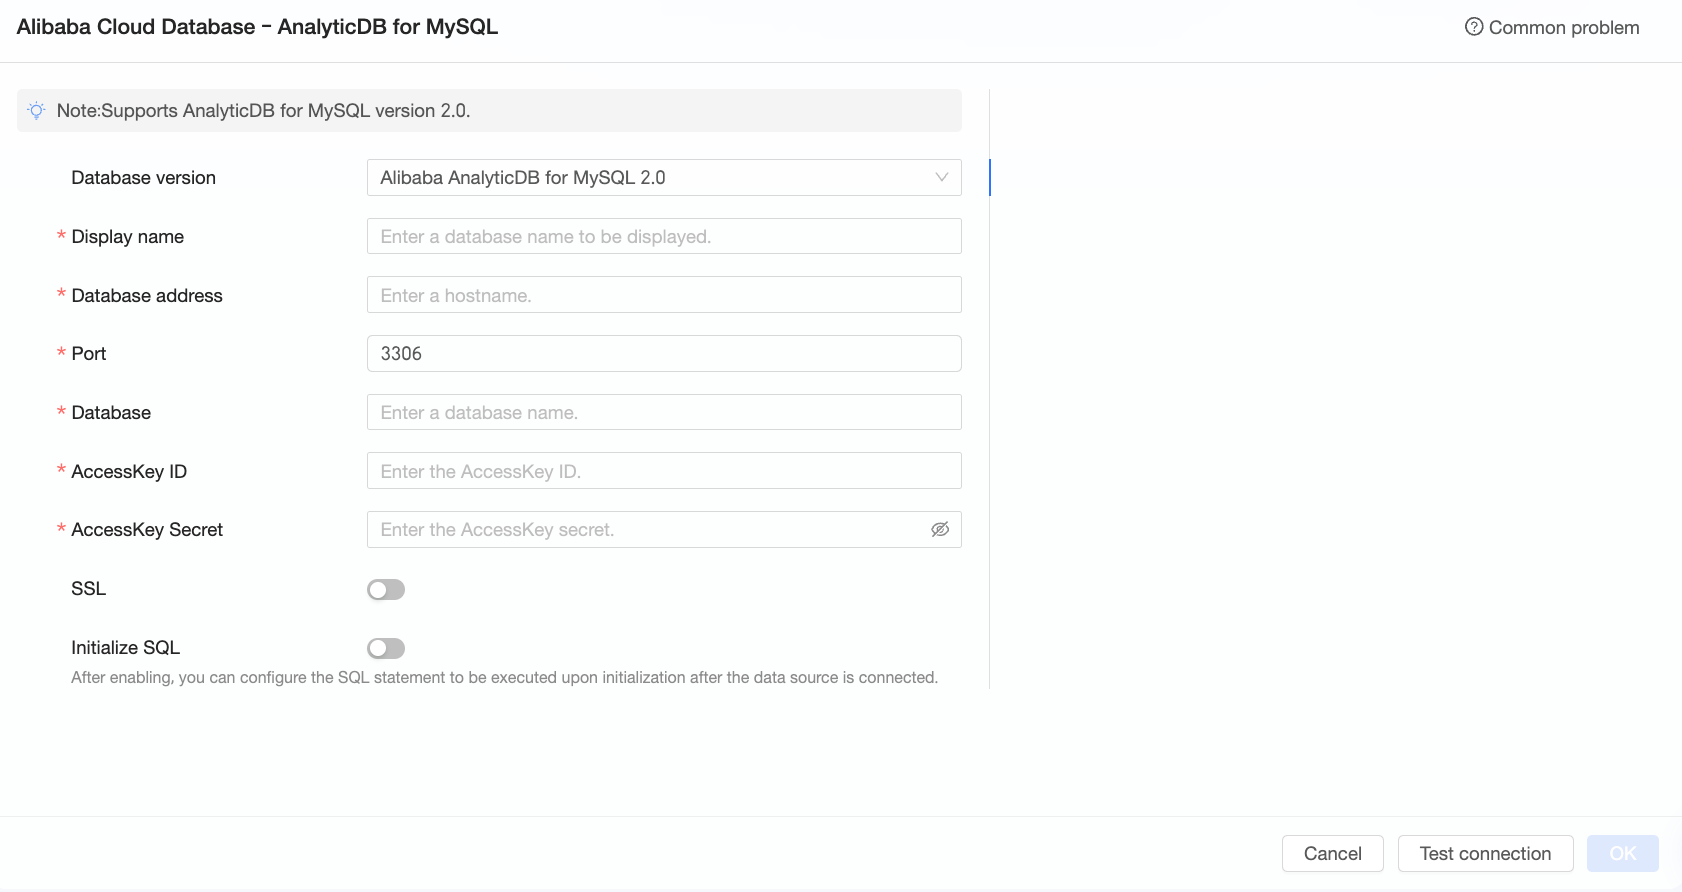
Configure the following parameters in the Add AnalyticDB for MySQL 2.0 Data Source dialog box.
Name
Description
Select Database Version
Select AnalyticDB for MySQL 2.0.
Display Name
The display name of the data source in the data source list.
Enter a valid name. Do not use special characters. The name cannot start or end with a space.
Database Address and Port
The endpoint and port of the AnalyticDB for MySQL 2.0 database.
Database
The name of the database in AnalyticDB for MySQL 2.0 that you want to connect to.
AccessKey ID and AccessKey Secret
The AccessKey ID and AccessKey secret that have access privileges to the target AnalyticDB for MySQL 2.0 database.
Log on to the AccessKey Management console to obtain the AccessKey ID and AccessKey secret.
SSL
If the target data source is configured with SSL, select SSL to protect data security.
Initialization SQL
Enable this option to configure SQL statements that are executed for initialization after a data source connection is established.
The SQL statements are executed for initialization each time a data source connection is established. Only SET statements are allowed. Separate multiple statements with semicolons.
Click Test Connection to test the connection to the data source.

If the test is successful, click OK to add the data source.
What to do next
After you add the data source, you can create datasets and analyze data.
Add data tables or use custom SQL statements from your AnalyticDB for MySQL 2.0 database to create datasets in Quick BI. For more information, see Create a dataset.
Create charts to visualize and analyze data. For more information, see Create a Dashboard and Overview of charts.
Drill down into your data for in-depth analysis. For more information, see Step 3: Drill-down settings and display.