Network Intelligence Service (NIS) provides network topology views and traffic analysis to help you understand your cloud network, optimize resources, and plan architecture.
Scenarios
Use NIS to view global network topologies, examine resource and routing relationships, and analyze traffic volume and distribution.
View global network topologies
Cloud Enterprise Network (CEN) Topology shows your global network structure. VPC Topology shows individual Virtual Private Cloud (VPC) structures. Use these views to understand resource deployment and simplify O&M.
Log on to the NIS console.
-
In the left navigation pane, choose .
-
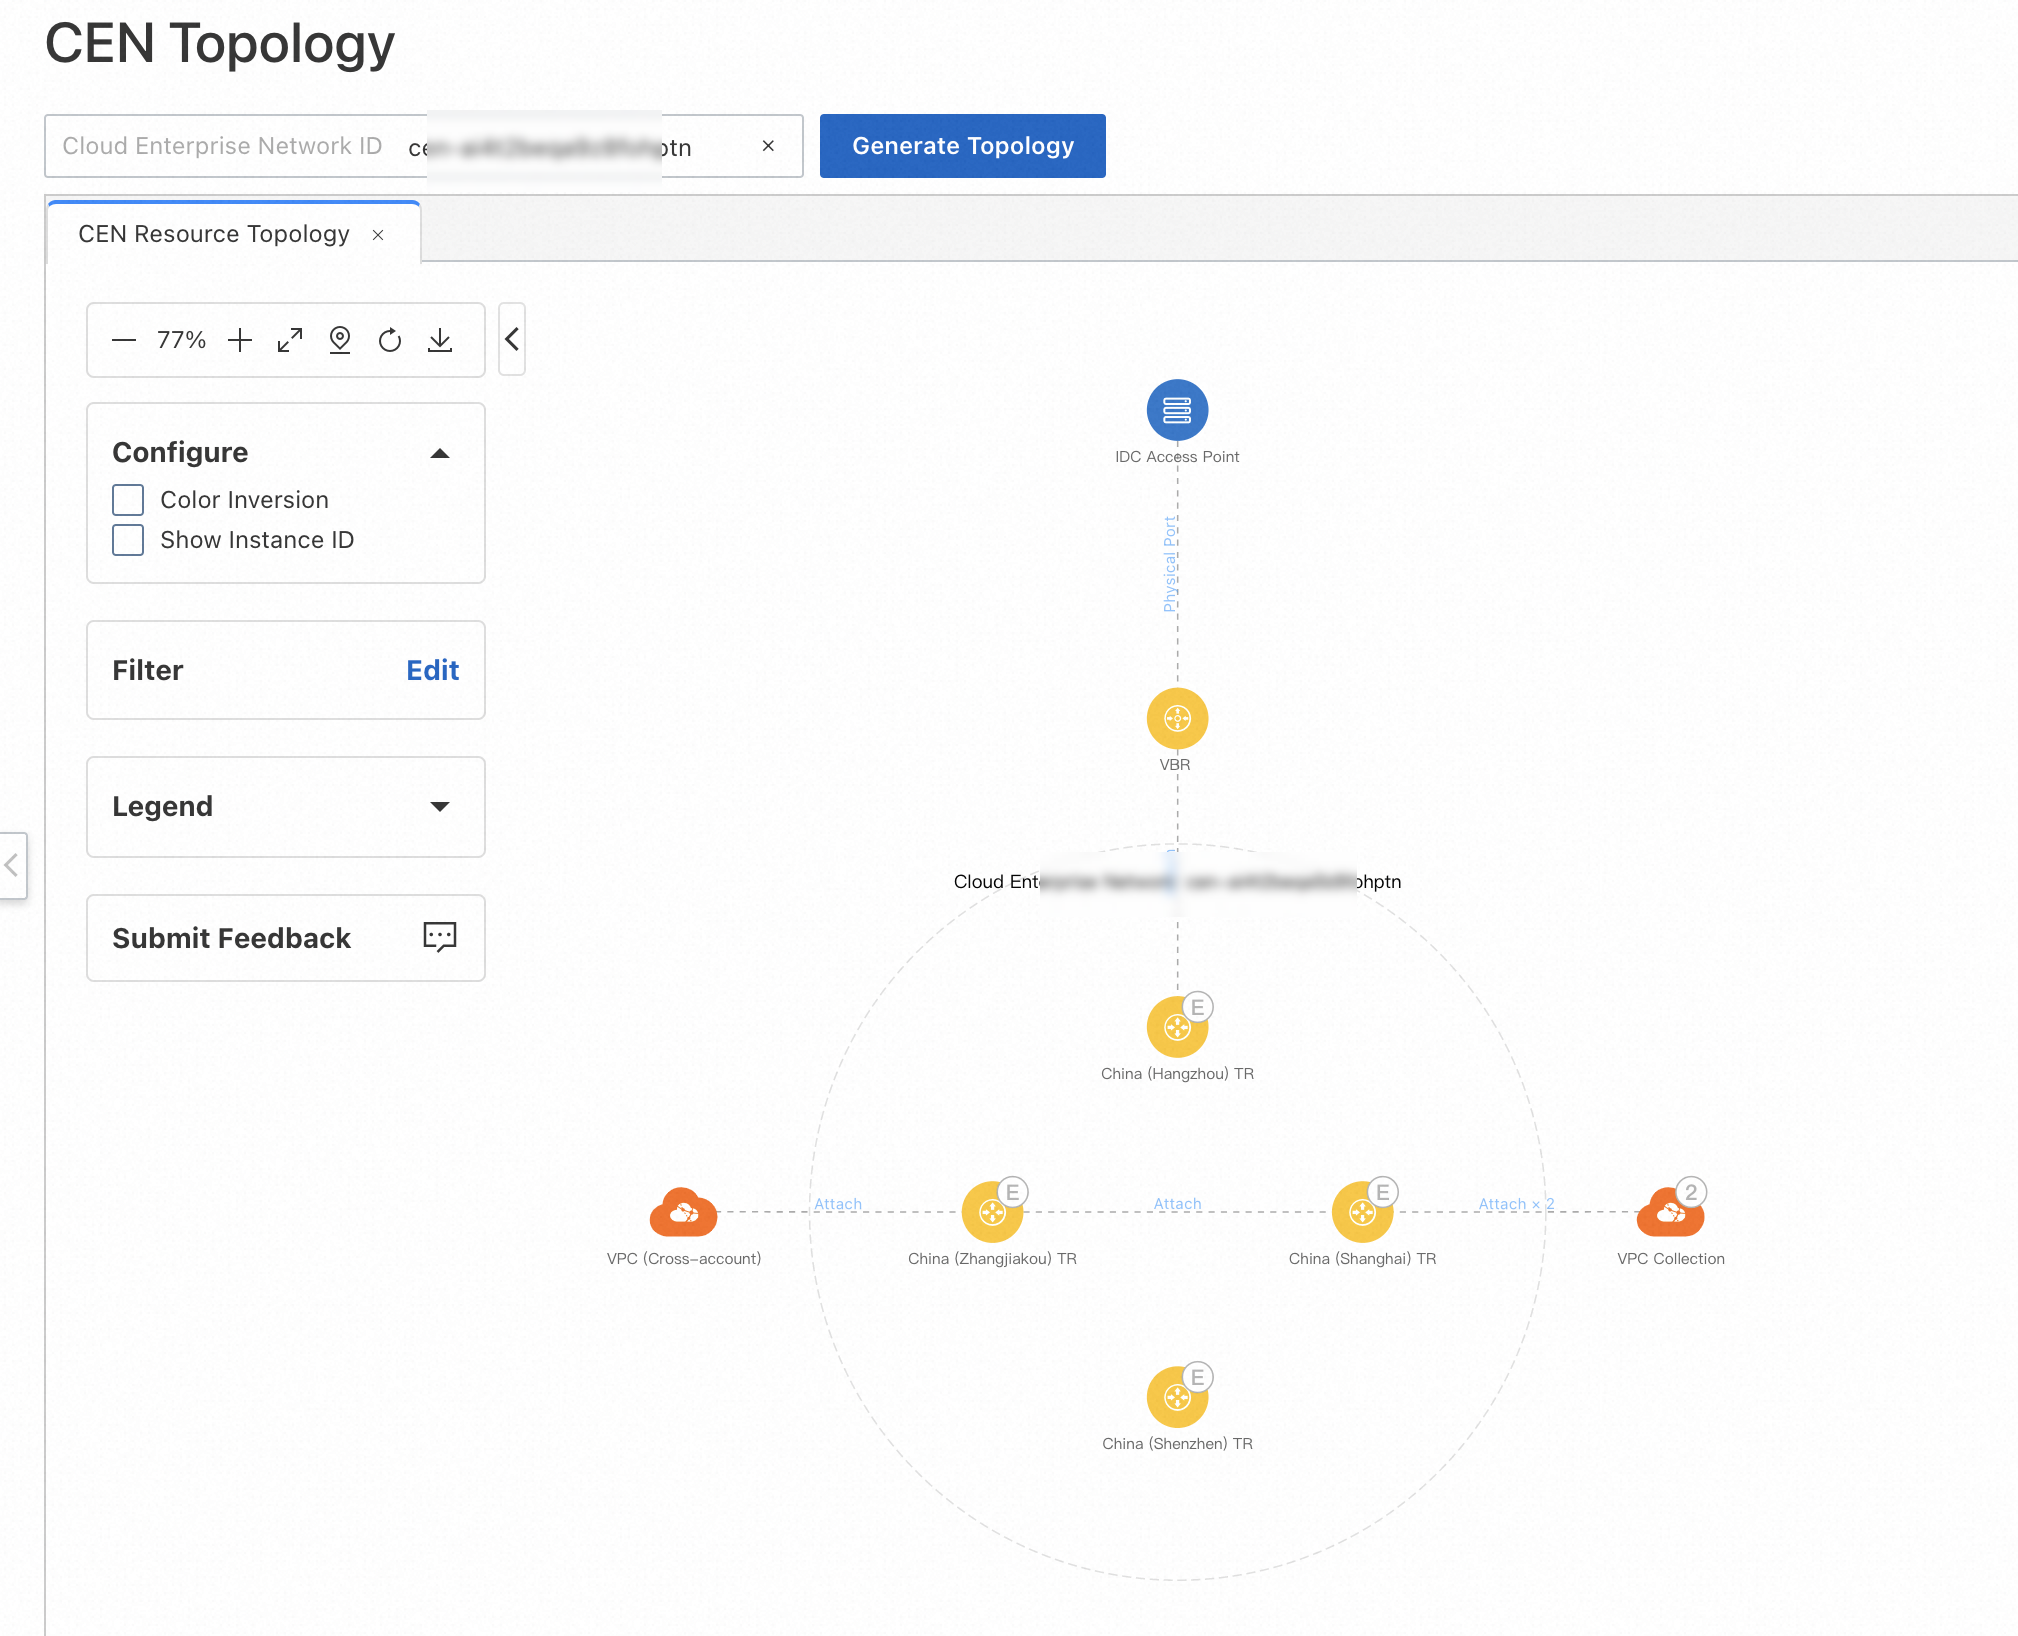
On the Cloud Enterprise Network Topology page, select a Cloud Enterprise Network ID, and click Generate Topology.
-
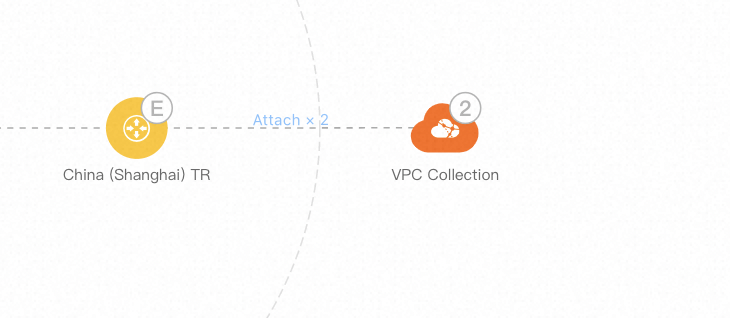
Click a node collection to view the VPC list.
-
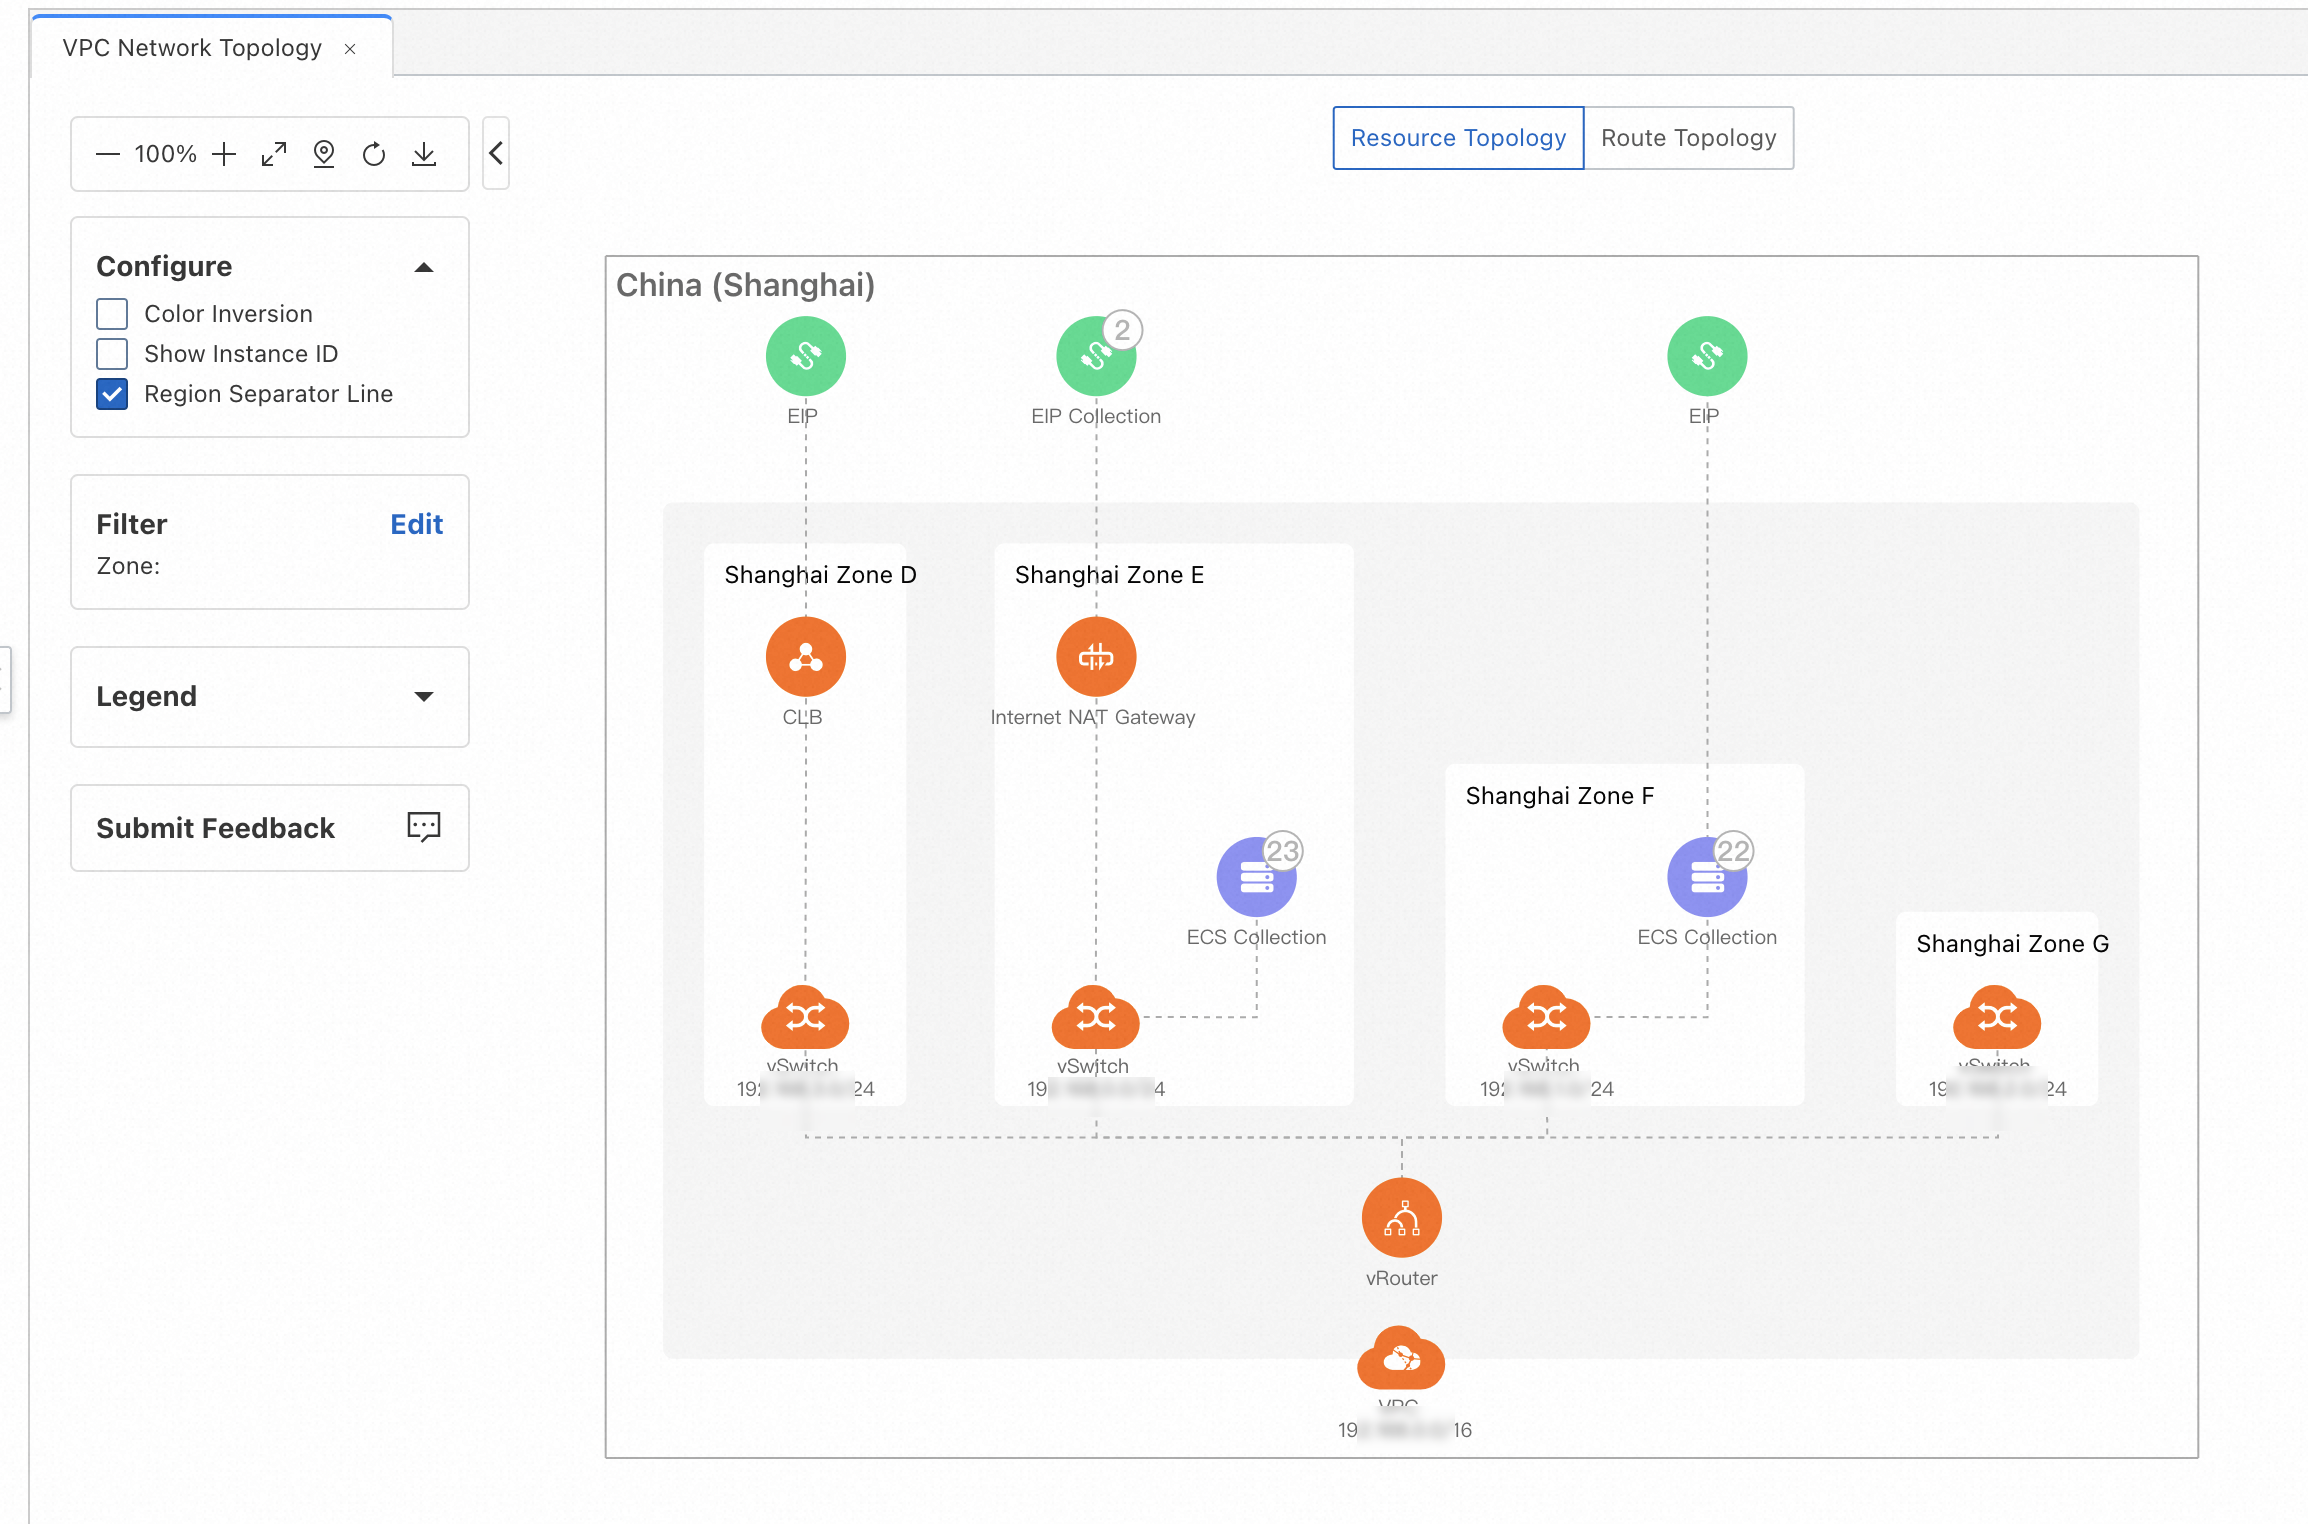
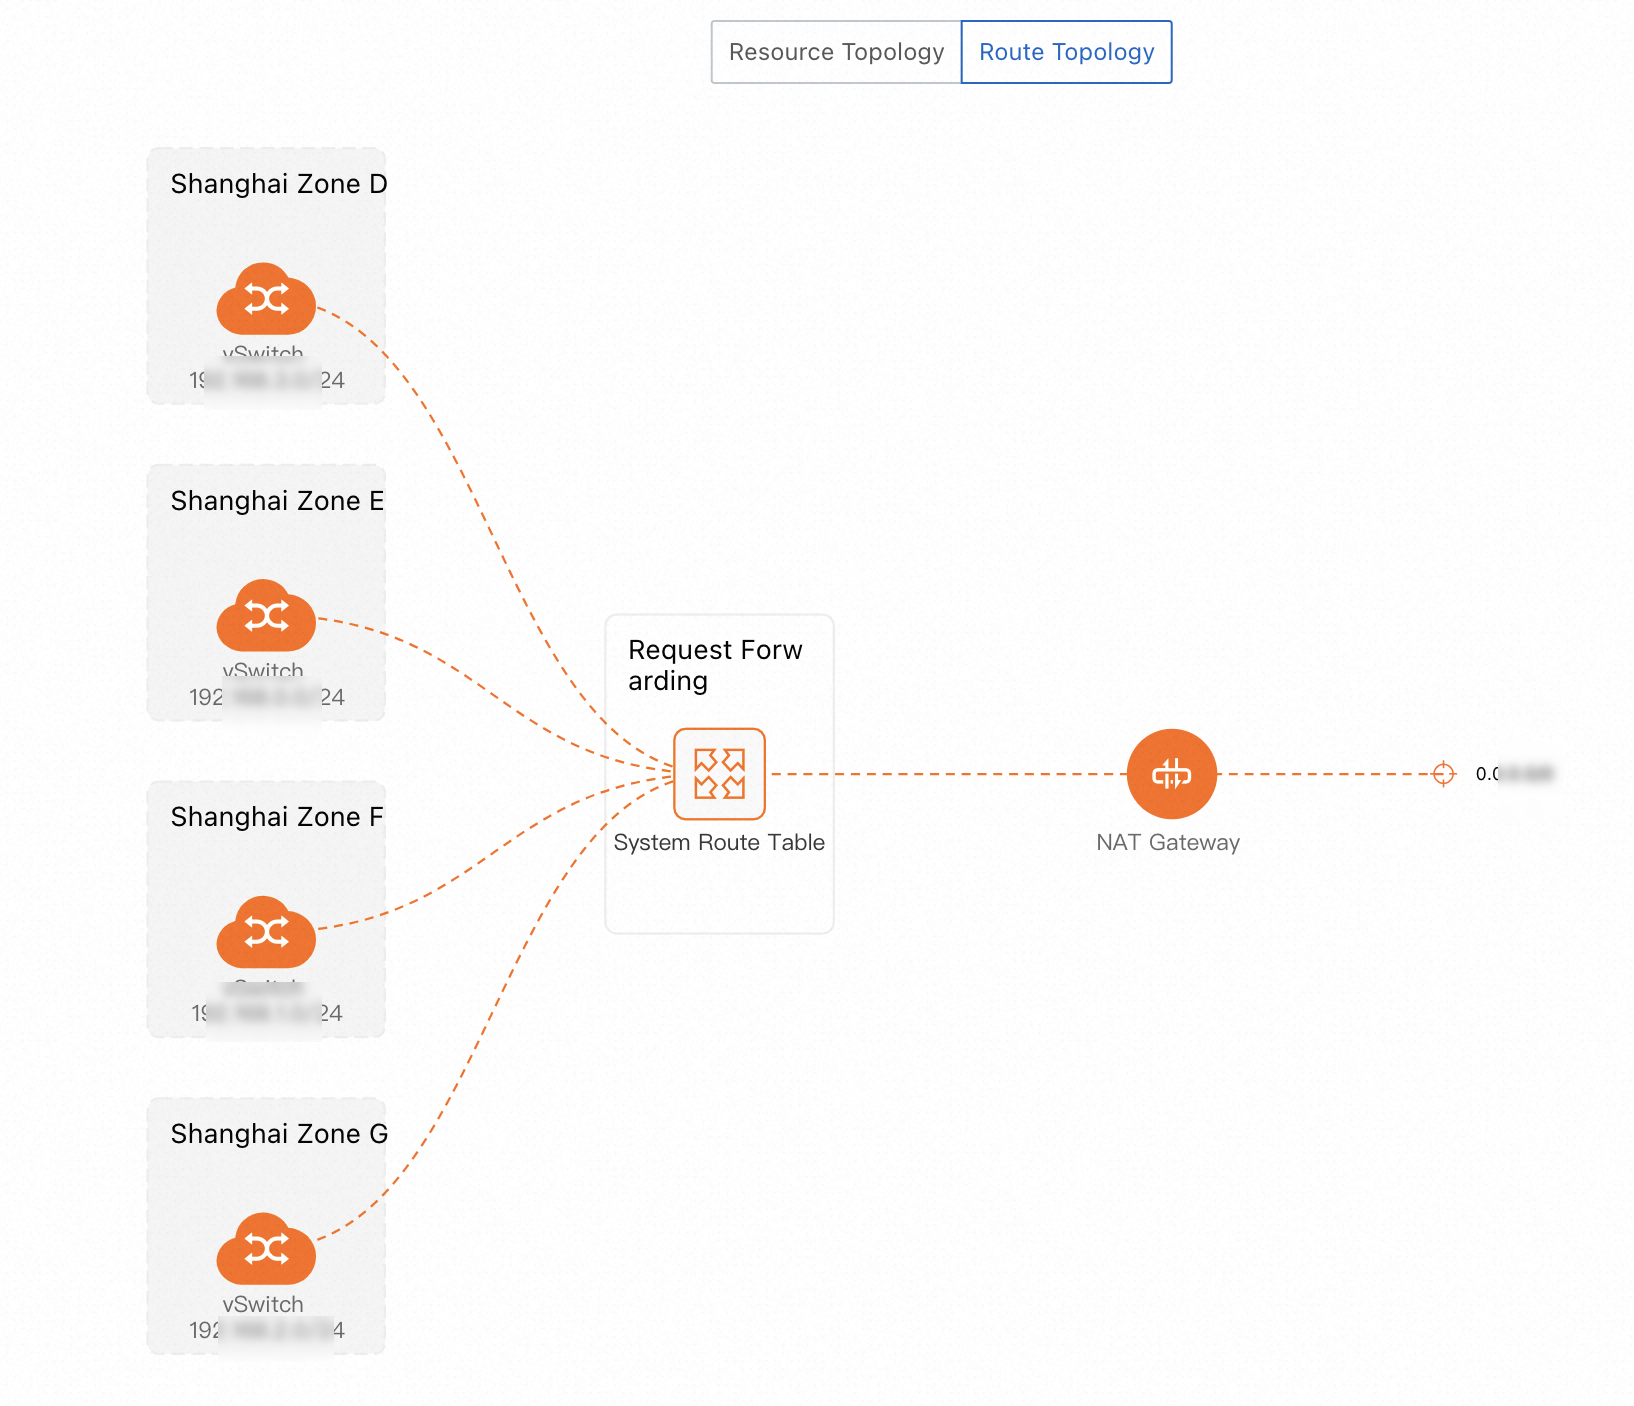
Click a VPC, then click View VPC Topology in the toolbar to view regional topology and resource deployment.
-
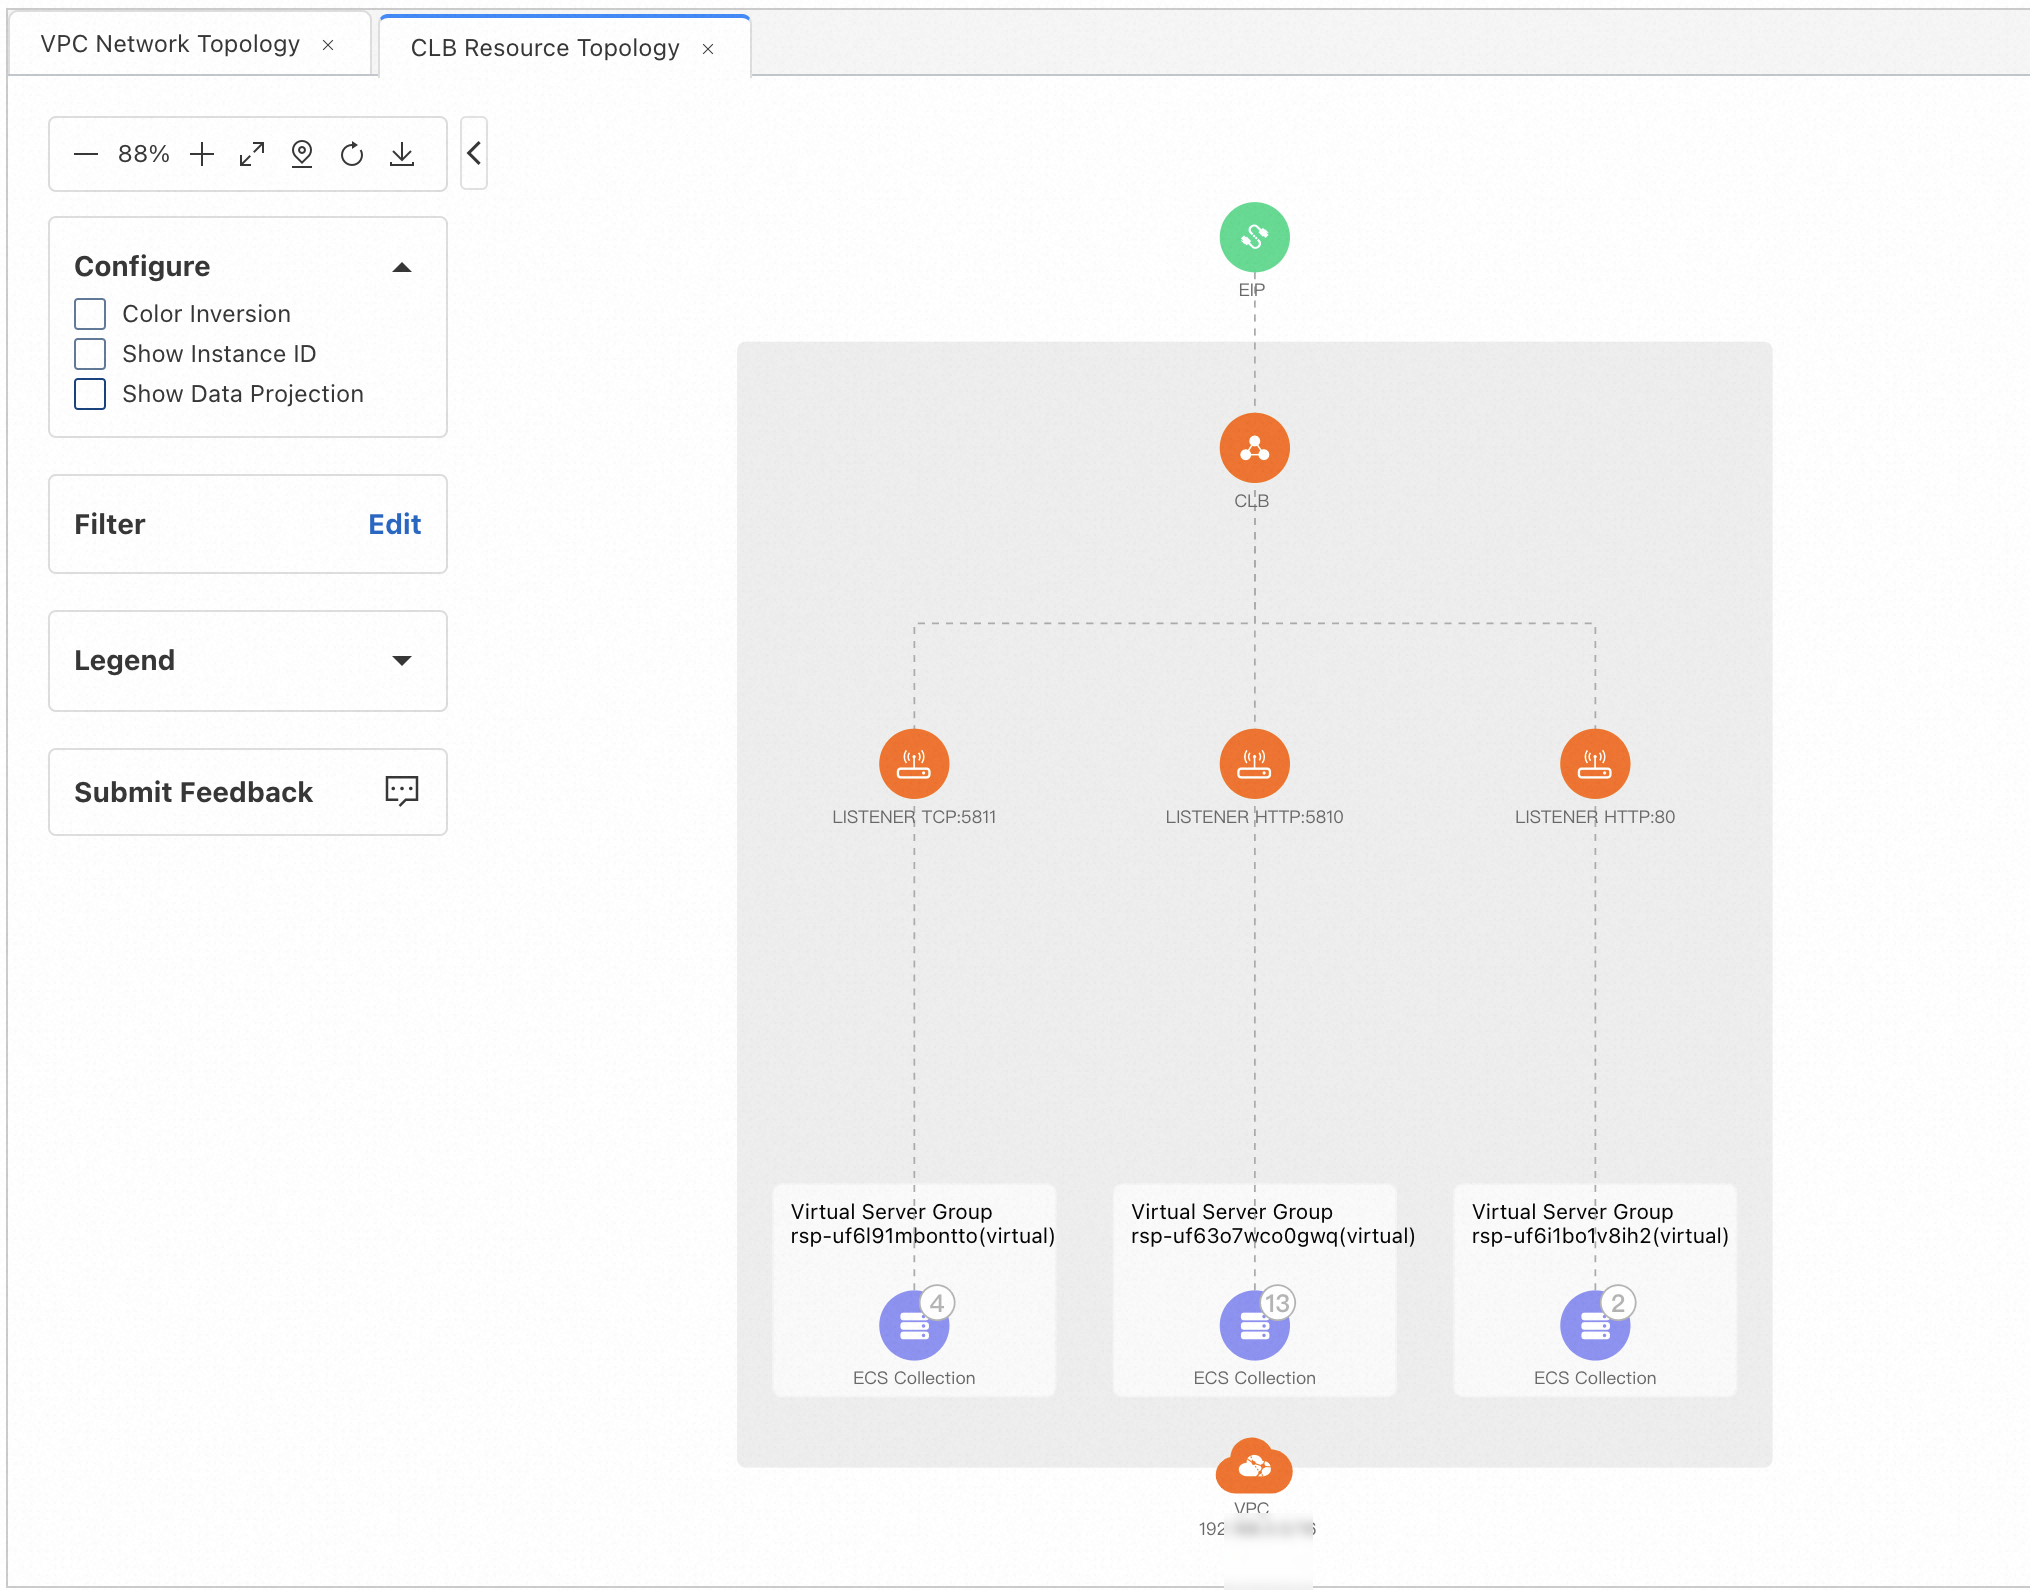
Click a Classic Load Balancer (CLB), then click Resource Topology Analysis in the toolbar to view the CLB topology.

Related topics
Analyze VPC traffic
Connect VPC flow logs to NIS Traffic Analyzer to analyze internal VPC traffic and VPC-to-internet traffic.
-
Create VPC flow logs as a data source
ImportantLimitations of Internet traffic analysis:
-
Traffic Analyzer uses VPC flow logs, which capture traffic only from elastic network interfaces (ENIs). Internet traffic from non-ENI resources, such as IP Target or CLB, is not supported.
-
You can enable flow logs at the VPC, vSwitch, or ENI level to capture both internet and internal traffic:
-
Full internet traffic analysis: Enable VPC-level flow logs. Traffic Analyzer automatically filters internet traffic.
-
Specific internet IP analysis: Enable flow logs for the ENI attached to the target IP.
-
-
Analyze TR traffic
Connect Transit Router (TR) flow logs to NIS Traffic Analyzer to analyze cross-region TR traffic and traffic between TRs and network instances.