After you create an NIS Traffic Analyzer, add a data source to analyze traffic. NIS Traffic Analyzer supports the following data sources: VPC flow logs and TR flow logs.
Add an existing data source
If you have existing data sources, such as VPC flow logs or TR flow logs, you can add them directly to NIS Traffic Analyzer.
Adding a flow log as a data source to NIS Traffic Analyzer incurs processing fees and storage fees. For more information, see Billing of NIS Traffic Analyzer.
Go to the product page of the target NIS Traffic Analyzer. On the Basic Information > VPC Flow Log tab, click Add Data Source.
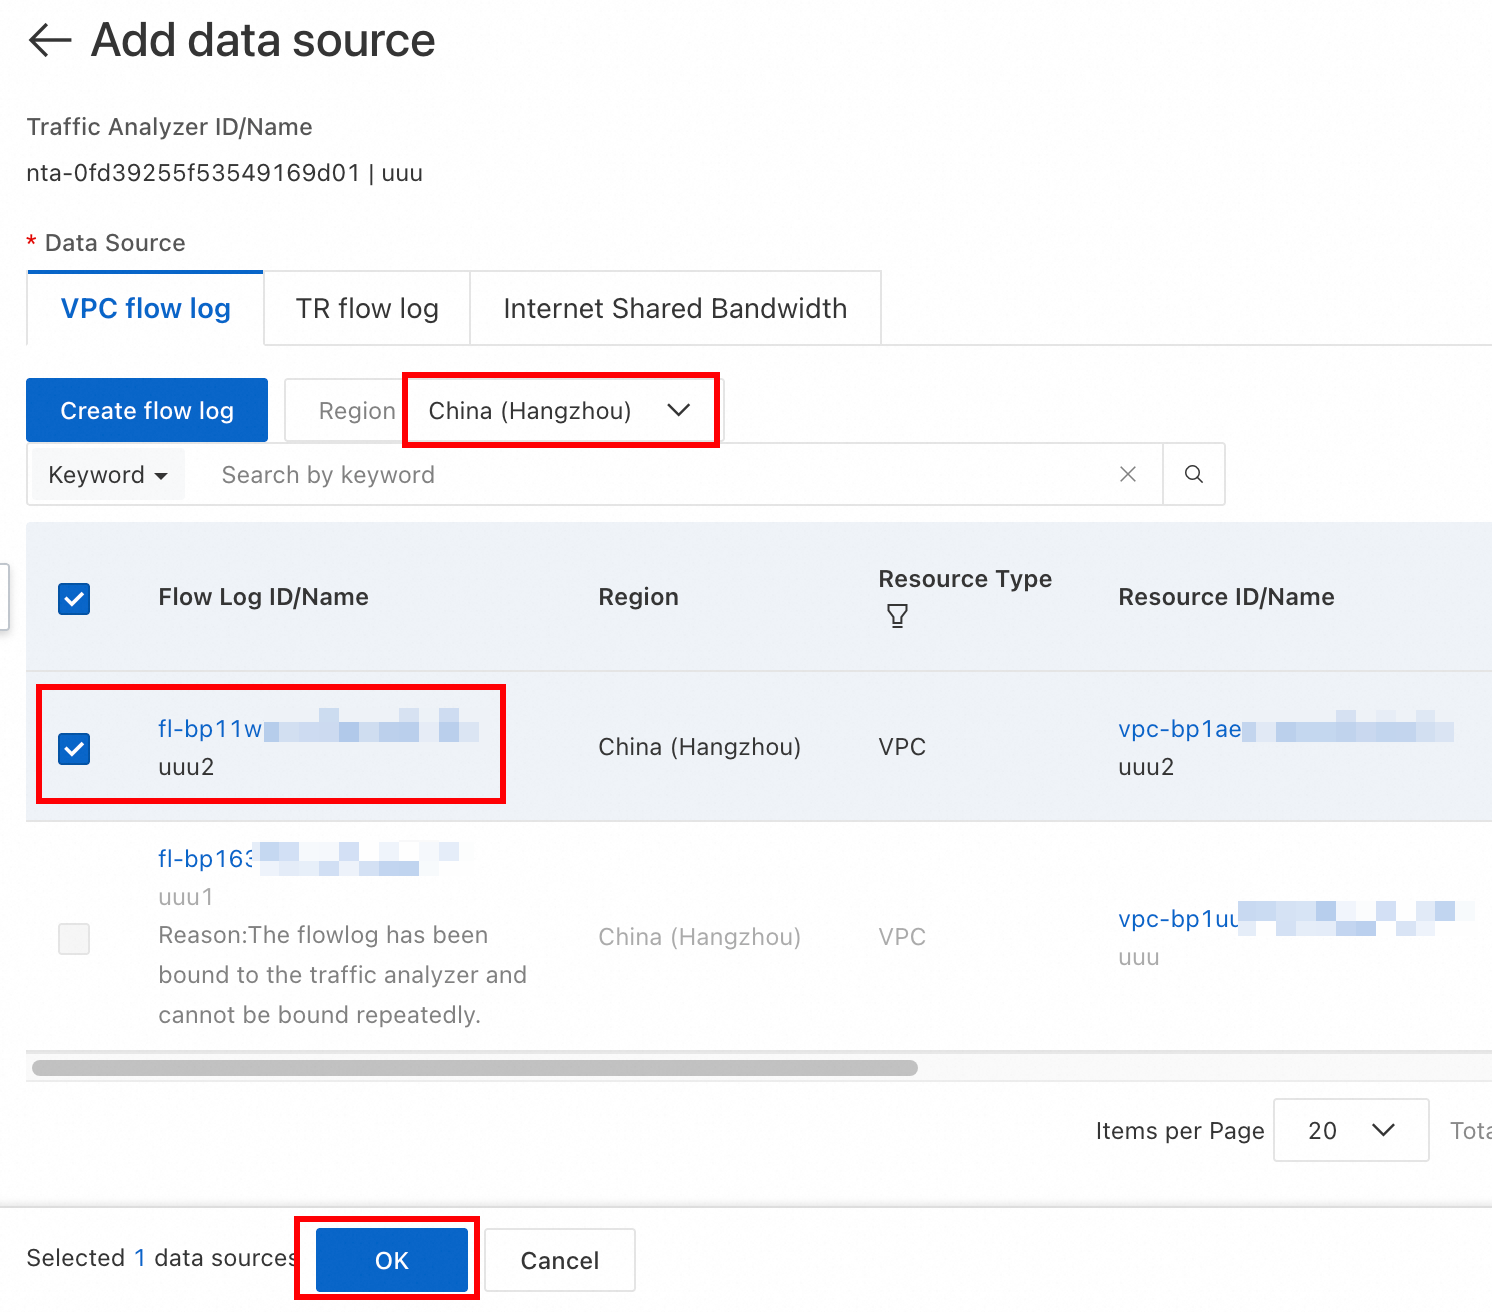
On the Add Data Source page, click the VPC Flow Log or Transit Router Flow Log tab, select the Region where the flow log is located, select the check box next to the target flow log, and then click Confirm.
The sampling interval of the new data source must be less than or equal to the sampling interval of the current NIS Traffic Analyzer.
What to do next
After you add the data source, you can begin analyzing traffic. For more information, see VPC traffic analysis or TR traffic analysis.
Create and add a new data source
If you have not created a VPC or TR flow log, you can create one on the data source page and then add it to NIS Traffic Analyzer.
Fees are incurred when you create a VPC or TR flow log. For more information, see Billing of VPC flow logs and Billing of TR flow logs.
Adding a flow log as a data source to NIS Traffic Analyzer incurs processing fees and storage fees. For more information, see Billing of NIS Traffic Analyzer.
Go to the product page of the target NIS Traffic Analyzer. On the Basic Information > VPC Flow Log tab, click Add Data Source.
On the Add Data Source page, click the appropriate data source tab:
VPC Flow Log
Click Create Flow Log. In the dialog box that appears, set the Collection Configuration:
ImportantThe sampling interval of the new data source must be less than or equal to the sampling interval of the current NIS Traffic Analyzer.
Configuration item
Diagram
Region: Select the region of the resource you want to monitor.
Resource Type and Resource Instance: Set the collection type to ENI, vSwitch, or VPC. If you select VPC or vSwitch, the system monitors the traffic of all ENIs within the selected resource.
Data Transfer Type: Select whether to capture traffic that is allowed or rejected by access control rules, such as security group and network ACL rules.
IP Version: Select IPv4 to capture only IPv4 traffic, or Dual-stack to capture both IPv4 and IPv6 traffic. The following regions support IPv6: China (Hangzhou), China (Shanghai), China (Qingdao), China (Beijing), China (Hohhot), China (Shenzhen), Singapore, US (Silicon Valley), and US (Virginia).
Sampling Interval (Minutes): The duration of the capture window for aggregating traffic information. Set the interval to 1, 5, or 10 minutes. A shorter interval generates flow logs more frequently, letting you locate issues faster. A longer interval provides less timely data but reduces the number of log entries and saves costs.
For example, for a TCP session that maintains a persistent connection, a 1-minute window produces 60 log records per hour, while a 10-minute window produces only 6 log records.
If multiple flow log instances in a VPC collect traffic from the same ENI, the shortest sampling interval among all instances is used as the actual capture window.
Sampling Path: Select specific collection scenarios to reduce usage costs. Deselect the default All Scenarios option first.
You can select traffic that passes through the following network elements: IPv4 Gateway, NAT Gateway, VPN Gateway, Transit Routers (TRs), Gateway Endpoint, virtual border router (VBR), Express Connect Router (ECR), Gateway Load Balancer (GWLB) Endpoint, and traffic to the Internet.
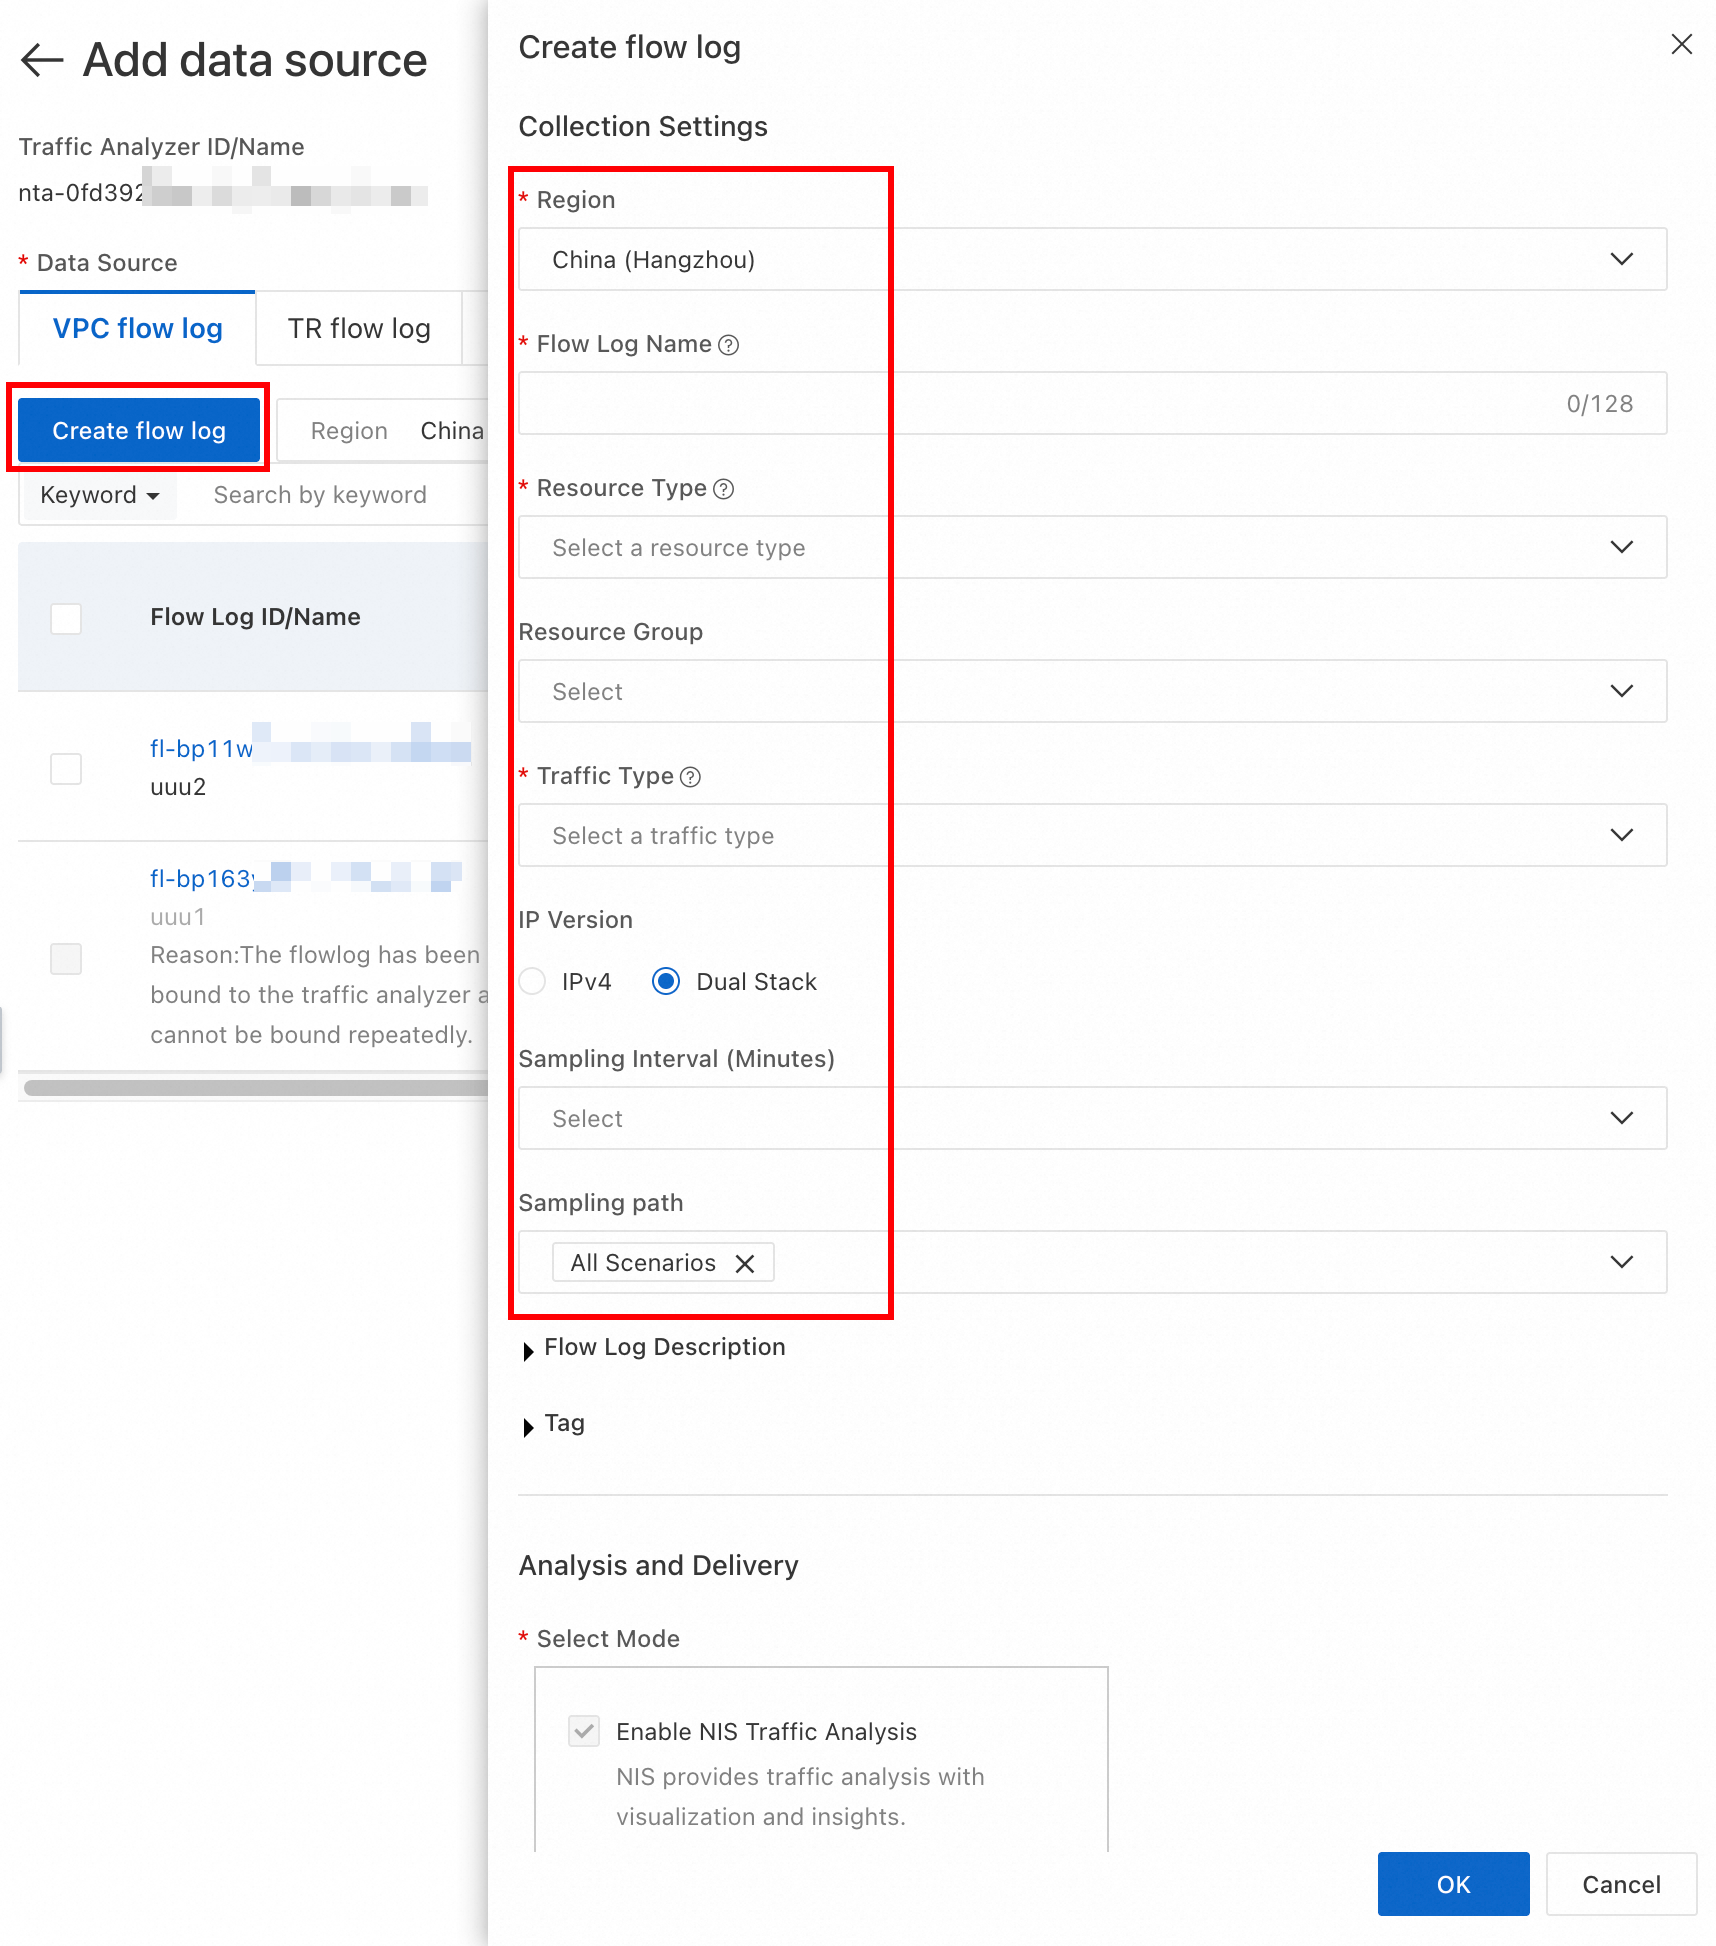
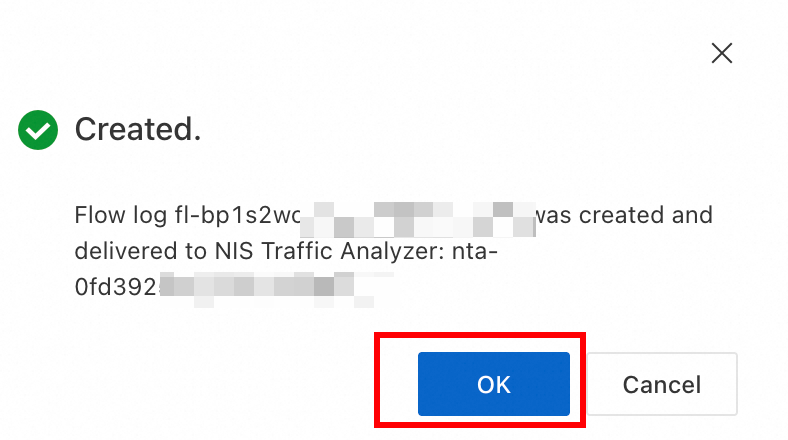
After the flow log is created, the system automatically delivers the VPC flow log to NIS Traffic Analyzer.
Transit Router Flow Log
Click Create Flow Log. In the Create Flow Log dialog box:
Configuration item
Diagram
First, set the Collection Configuration:
Cloud Enterprise Network: Select the Cloud Enterprise Network where the target TransitRouter is located.
Transit Router: Select the target transit router.
Instance: Select the target resource.
When you select Inter-region Connection, only one-way outbound traffic information from the transit router is collected.
When you select VBR Connection, VPC Connection, VPN Connection, or ECR Connection, the system collects inbound and outbound bidirectional traffic information for the TransitRouter.
When you select TR, the system collects data for all network instance connections that are created on the transit router, including inter-region connections, VBR connections, VPC connections, VPN connections, and ECR connections. The traffic collection direction for each resource is the same as described above.
Sampling Interval: The length of the capture window for aggregating traffic information. The available options are 1 minute, 5 minutes, or 10 minutes. The smaller the window, the more frequently and timely flow logs are generated, which helps you discover and locate issues faster. The larger the window, the lower the timeliness, but the number of log entries also decreases, which saves costs.
ImportantThe sampling interval of the new data source must be less than or equal to the sampling interval of the current NIS Traffic Analyzer.
Next, set Analysis And Delivery Configuration > Log Format:
Default Format: Uses the fields that the system selects by default.
Custom Format: You can customize the fields to include in the logs. This format supports more fields than the default format. Selecting fewer fields simplifies log information and helps reduce costs. The
srcaddr,dstaddr, andbytesfields are required.After you select a log format, the system automatically generates the log format as a string. You can click the Copy Selected Format button to batch create flow logs with the same format when you call an API.
After you confirm the settings, click Confirm.
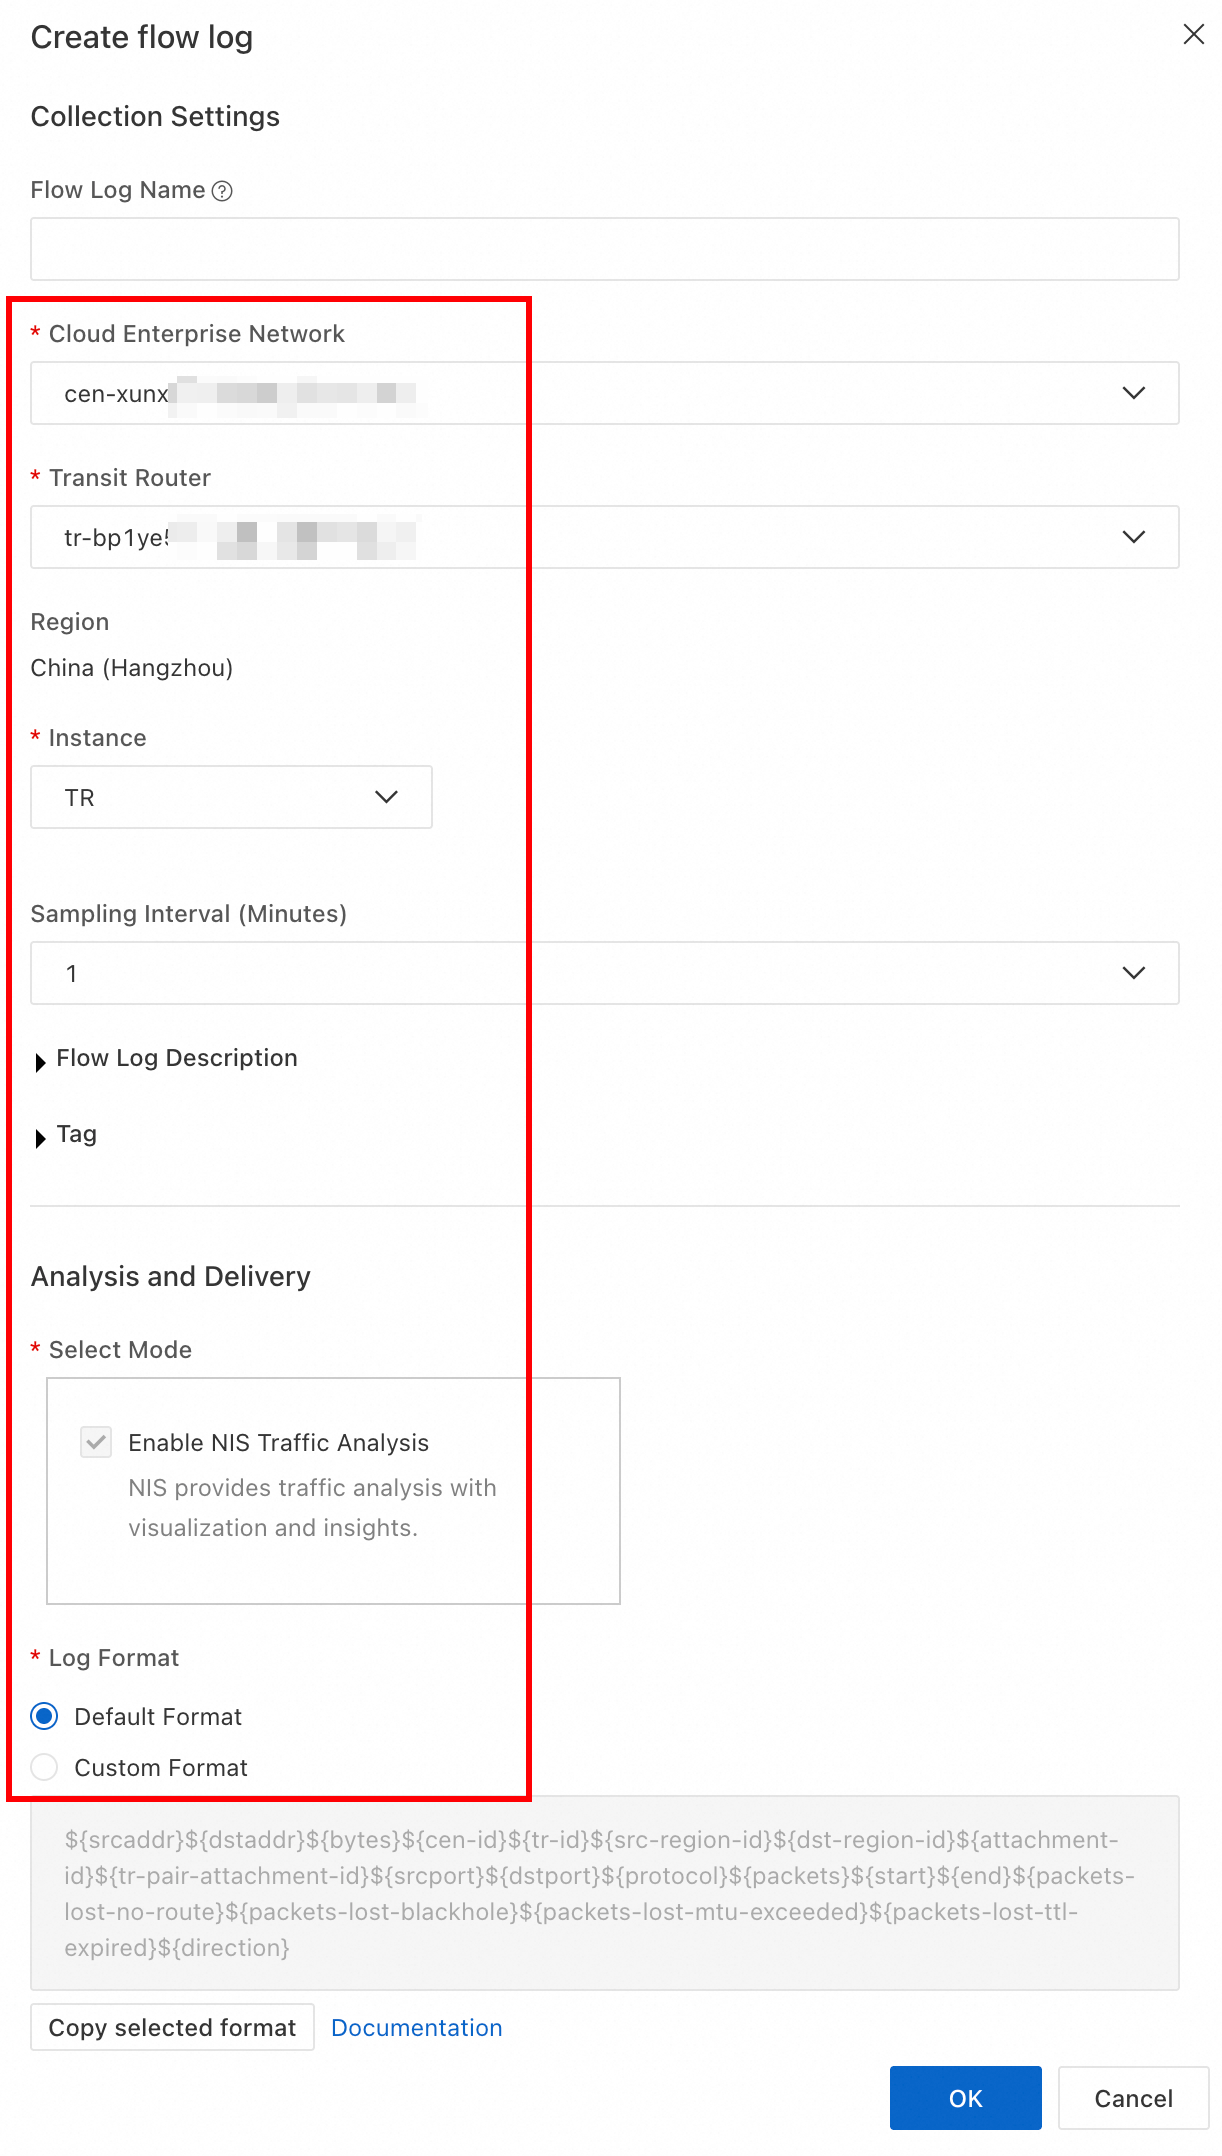
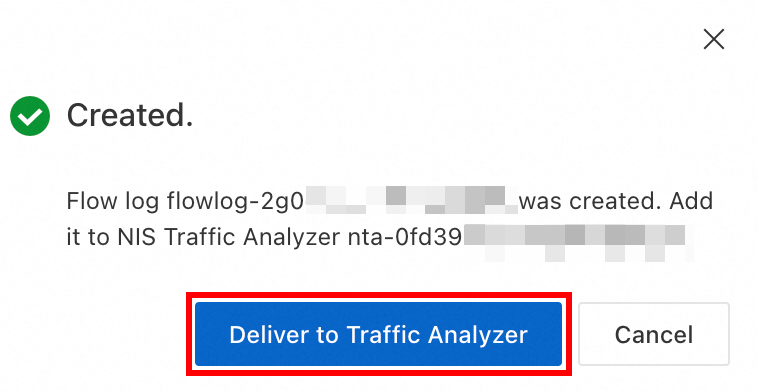
After the flow log is created, click Deliver to NIS Traffic Analyzer to begin analyzing TR traffic.
What to do next
After you add the data source, you can begin analyzing traffic. For more information, see VPC traffic analysis or TR traffic analysis.
Remove a data source
In the Operation column for the target data source, click Remove Data Source.
This operation only removes the data source from NIS Traffic Analyzer. It does not delete the traffic analysis data stored in NIS Traffic Analyzer or the flow log collection task for the data source. To delete the collection task, see Delete a VPC flow log and Delete a TR flow log.
