The Jobs page in the MaxCompute console lets you monitor and manage job execution across your projects. Use it to track running and historical jobs, investigate failures, identify resource bottlenecks, and stop jobs consuming excessive resources.
Data developers can find a specific job, check its status, view execution details in LogView, or stop a runaway job.
Administrators can analyze resource load across quota groups at a point in time, identify which jobs are competing for compute resources, and adjust allocations accordingly.
What you can do
| Action | How |
|---|---|
| Filter jobs by time range, project, quota, and job type | Use the global filters above the job list |
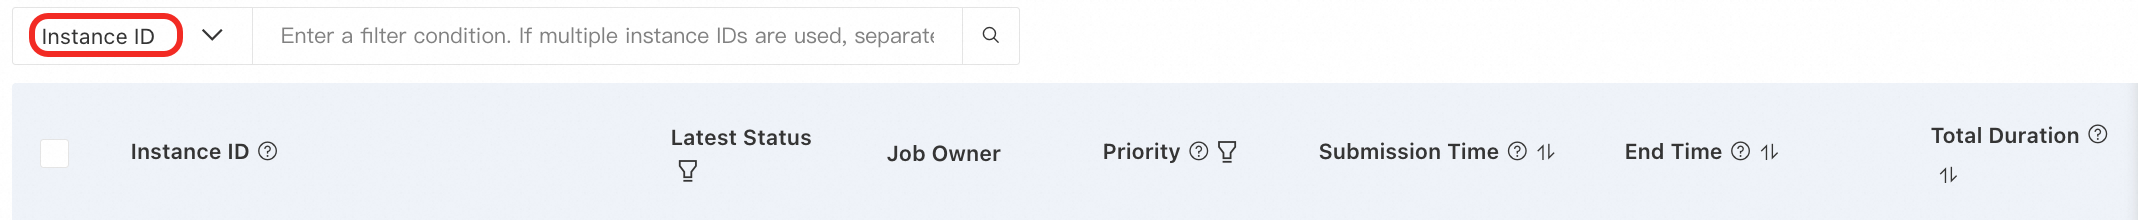
| Narrow results within the job list | Use the Instance ID, Job Owner, ExtNodeId, ExtNodName, or Signature search fields above the list |
| Filter by status, priority, or diagnostic tag | Click the filter icon next to a column header |
| Sort by a single column | Click the sort button in a column header |
| Sort by multiple columns | Click Advanced Sorting, add columns, and set the order for each, then click OK. When advanced sorting is active, basic single-column sorting is disabled. To return to single-column sorting, click Advanced Sorting, click Reset, and then click OK. |
| View execution details | Click LogView in the Actions column |
| Analyze resource consumption and quota allocation | Click Insights in the Actions column |
| Stop a running job | Click Terminate or Batch Terminate for jobs with Latest Status Running |
By default, jobs are sorted by end time in descending order, with running jobs listed first.
Usage notes
Keep the following in mind when using the Jobs page:
-
Snapshot collection frequency: Snapshot data is collected every 3 minutes. Jobs that start within the 3-minute window before a collection run may not appear in the Snapshot List.
-
PAI jobs: Some MaxCompute jobs initiated through PAI — especially those submitted by RAM users — cannot be collected.
-
Developer Edition projects: Jobs in Developer Edition projects (to be discontinued) cannot be collected.
-
Status lag: The job list is refreshed at a fixed frequency. A job shown as
Runningmay have already completed in LogView, especially for short-lived jobs. The status in LogView is the most accurate. -
Smart diagnosis: Smart diagnosis is supported for SQL jobs only. Job-level resource consumption data is not available for jobs that run for less than 2 minutes or for non-SQL, non-MapReduce, non-Spark, and non-Mars jobs.
Job statistics chart
The stacked column chart above the job list shows job counts grouped by time and status, based on your current filter settings. It gives you a quick visual overview of job activity across a time window.
The time interval per column depends on the selected Time Range:
| Time Range | Column interval | Max columns |
|---|---|---|
| Within 24 hours | 2 minutes (minimum) | 24 |
| More than 24 hours, up to 48 hours | 2 hours (fixed) | 24 |
| More than 48 hours, up to 7 days | 6 hours (fixed) | 29 |
Statuses shown in the chart:
-
Running: snapshot status is Running at the collection time
-
Finished: the job succeeded, failed, or was terminated
Drag over the chart to select a shorter time window and zoom in.
Job list
The job list shows jobs matching your filter criteria. Two views are available:
-
Regular Job List: Shows all jobs that finished or were running within the specified time range, with cumulative metrics such as total CPU and memory usage.
-
Snapshot List: Shows jobs captured at a specific point in time, with point-in-time metrics such as CPU and memory usage at the snapshot moment. Use this view to investigate resource contention at a specific time or to sort by resource usage percentage.
Global filter parameters
These filters affect both the job statistics chart and the job list.
|
Parameter |
Description |
|
Time Range |
Required. Filters the job list and chart by time. Two methods:
The time range has two meanings:
Default: last 1 hour. Maximum span: 7 days. Minimum span: 2 minutes. Lookback period: last 45 days. |
|
Choose Project |
Filters by MaxCompute project name. Select one or more projects. Leave blank to include all projects. |
|
Select Quota |
Filters by quota group — useful when investigating resource contention within a specific quota. Only subscription quota groups are supported. Leave blank when querying pay-as-you-go jobs. For more information, see Compute resources - Quota management. |
|
Job Type |
Filters by job type. Available types:
|
Job list search parameters
These parameters filter the job list only — they do not affect the statistics chart. Use them to narrow down to a specific job or set of related jobs.
| Parameter | Description |
|---|---|
| Instance ID | Search by the instance ID of a specific MaxCompute job. For more information, see View instance information. |
| Job Owner | Filter by the account that submitted the job — useful for identifying who owns a resource-heavy job. Enter the complete account name in ALIYUN$xxx or RAM$xxx format. Fuzzy search is not supported. |
| ExtNodeId | Search by the source job ID from the orchestration tool that triggered the MaxCompute job — for example, a DataWorks node ID. For more information, see Configure basic properties. |
| ExtNodName | Search by the source job name from the orchestration tool that triggered the MaxCompute job. |
|
ExtNodeName |
The task Name that corresponds to the job initiator, such as the Name of a DataWorks scheduling node. The requester needs to pass this information when initiating the job. For more information about the conventions for passing information, see General job identification conventions. |
| Signature | Search by SQL job signature to find all instances that ran the same SQL logic. Available for SQL jobs only. |
Job list item filter parameters
Click the filter icon ![]() next to a column header to apply these filters within the job list.
next to a column header to apply these filters within the job list.
| Parameter | Description |
|---|---|
| Latest Status | Filter by job status to focus on running, failed, or completed jobs. Statuses: Running (not yet finished), Success, Failed, Canceled, Submitted (waiting for compute resources). This is the overall job status; individual tasks within a job may have different sub-statuses — check LogView for details. See Use LogView 2.0 to view job run information. |
| Priority | Filter by job priority (0–9). Lower value means higher priority. High-priority jobs get compute resources first. |
| Intelligent Diagnostics | Filter by smart diagnosis tags — useful for quickly finding jobs flagged with specific issues. For tag descriptions, see Smart diagnosis result tag description. |
Regular Job List columns
| Column | Description |
|---|---|
| Instance ID | Each MaxCompute job generates an instance with a unique instance ID. The project, compute quota, and job type are also shown. Click LogView in Actions to view execution progress. Click Insights in Actions to open the Job Insights page. |
| Latest Status | The current status of the job. |
| Job Owner | The Alibaba Cloud account that submitted the job. If a job is consuming excessive resources, contact the owner or terminate the job. See Instance operations. |
| Priority | Job priority from 0 (highest) to 9 (lowest). See Job priority. |
| Submission Time | When the job was submitted. |
| Start Running Time | When the job received its first compute resources. For jobs with very short runtimes or jobs that consume no compute resources (such as DDL statements), the submission time is used instead. Hidden by default — enable in list settings. |
| Waiting Duration | Time from submission to when the job started running. If the job has no start time, the duration from submission to snapshot time is shown. Hidden by default — enable in list settings. |
| Execution Duration | Time from job start to job end. Hidden by default — enable in list settings. |
| End Time | When the job ended. |
| Total Duration | Total time from submission to termination. |
| Total Used CPU Resources | Total CPU consumed during the job. Unit: 100*Core*s. |
| Total Amount of Used Memory Resources | Total memory consumed during the job. Unit: MB*s. |
| CPU Utilization Percentage Snapshot | CPU usage percentage captured 1 minute before the end of the time range. Formula: CPU Cores in Use / (CPU Lower Limit for Reserved CUs + Elastically Reserved Minimum CPU Utilization). Not available for pay-as-you-go jobs or jobs without snapshot data. Sorting not supported — use the Snapshot List to sort by this metric. |
| Memory Usage Percentage Snapshot | Memory usage percentage captured 1 minute before the end of the time range. Formula: Memory Size Occupied / (Minimum Reserved CU Memory + Minimum Elastically Reserved CU Memory). Not available for pay-as-you-go jobs or jobs without snapshot data. Sorting not supported — use the Snapshot List to sort by this metric. |
| Input Size | Amount of input data processed by the job. |
| Intelligent Diagnostics | Tags from the smart diagnosis results for the job. |
| ExtPlatformId | The client that initiated the job (for example, DataWorks). The caller must pass this when submitting the job. See General job identification conventions. |
| ExtNodeId | The task ID from the orchestration tool that initiated the job (for example, a DataWorks scheduling node ID). The caller must pass this when submitting the job. See General job identification conventions. |
| ExtNodeName | The task name from the orchestration tool. The caller must pass this when submitting the job. See General job identification conventions. |
| ExtNodeOnDuty | The task owner from the orchestration tool. The caller must pass this when submitting the job. See General job identification conventions. |
| Signature | The signature of the SQL job. Use this to find all instances that ran the same SQL logic. |
Snapshot List columns
| Column | Description |
|---|---|
| Instance ID | Each MaxCompute job generates an instance with a unique instance ID. The project, compute quota, and job type are also shown. Click LogView in Actions to view execution progress. Click Insights in Actions to open the Job Insights page. |
| Snapshot Time | When the snapshot was collected for the job. |
| Snapshot Status | The job status at the snapshot time. |
| Job Owner | The Alibaba Cloud account that submitted the job. See Instance operations. |
| Priority | Job priority from 0 (highest) to 9 (lowest). See Job priority. |
| CPU Cores in Use | Number of CPU cores the job was using at the snapshot time. |
| Requested CPU Cores | Number of CPU cores the job requested at the snapshot time. |
| CPU Satisfaction Rate | CPU Cores in Use / Requested CPU Cores at the snapshot time. |
| CPU Utilization Percentage Snapshot | CPU usage percentage captured 1 minute before the end of the time range. Formula: CPU Cores in Use / (CPU Lower Limit for Reserved CUs + Elastically Reserved Minimum CPU Utilization). Not available for pay-as-you-go jobs or jobs without snapshot data. |
| Memory Size Occupied | Memory the job was using at the snapshot time. The unit is automatically adjusted for display. |
| Requested Memory Size | Memory the job requested at the snapshot time. The unit is automatically adjusted for display. |
| Memory Satisfaction Rate | Memory Size Occupied / Requested Memory Size at the snapshot time. |
| Memory Usage Percentage Snapshot | Memory usage percentage at the observation time. Formula: Amount of used memory / (Amount of reserved memory + Amount of elastically reserved memory). Not available for pay-as-you-go jobs or jobs without snapshot data. |
| Submission Time | When the job was submitted. |
| Total Duration | Total time from submission to termination. |
| ExtPlatformId | The client that initiated the job. See General job identification conventions. |
| ExtNodeId | The task ID from the orchestration tool. See General job identification conventions. |
| ExtNodeName | The task name from the orchestration tool that initiated the job (for example, a DataWorks scheduling node name). See General job identification conventions. |
| ExtNodeOnDuty | The task owner from the orchestration tool. See General job identification conventions. |
| Signature | The signature of the SQL job. Use this to find all instances that ran the same SQL logic. |
Common O&M scenarios
View the run details of a specific job
Use this approach when you need to audit a specific MaxCompute job or investigate a job triggered by an orchestration tool such as DataWorks.
-
Log on to the MaxCompute console and select a region.MaxCompute console
-
In the left navigation pane, choose Observation O&M > Jobs.
-
Set a Time Range and click Search.
-
Above the job list, select ExtNodeId or Instance ID and enter the corresponding value.
-
Click the
 icon to apply the filter.
 -
In the results, click LogView in the Actions column to open the LogView page and view detailed execution information. For more information, see Use LogView 2.0 to view job run information.
View jobs from a specific time period
Use this approach to review all jobs across multiple projects over a past period — for example, to identify which jobs failed over the last day.
-
Log on to the MaxCompute console and select a region.MaxCompute console
-
In the left navigation pane, choose Observation O&M > Jobs.
-
Set Time Range to 1d, or set a custom range from
00:00:00on the current day to the current time. -
In Choose Project, select the target projects (for example, Project_1 and Project_2).
-
Click Search.
-
In the results, click LogView in the Actions column to view execution details for any job. For more information, see Use LogView 2.0 to view job run information.
Identify which jobs are consuming a subscription quota
Use this approach when resource usage for a quota group is high and jobs are queuing — you need to find out which specific jobs are responsible.
-
Log on to the MaxCompute console and select a region.MaxCompute console
-
In the left navigation pane, choose Observation O&M > Jobs.
-
Set Time Range to 1h or a custom range.
-
Set Select Quota to the target quota group (for example,
Default Subscription Quota) and click Search. -
In the results, check CPU Utilization Percentage Snapshot and Memory Usage Percentage Snapshot for jobs with Latest Status
Running. Identify jobs with the highest usage and compare them against your business expectations to decide whether to terminate them. -
Click LogView in the Actions column to view execution details for any job. For more information, see Use LogView 2.0 to view job run information.
View the run details of an accelerated query job
Use this approach to check the status and execution details of SQLRT (Query Acceleration) jobs from the last day.
-
Log on to the MaxCompute console and select a region.MaxCompute console
-
In the left navigation pane, choose Observation O&M > Jobs.
-
Set Time Range to 1d and Job Type to SQLRT (Query Acceleration), then click Search.
-
In the results, click LogView in the Actions column to view execution details. For more information, see Use LogView 2.0 to view job run information.
How accelerated query jobs appear in the list: For SQLRT jobs, multiple SQL commands may run within the same session, and one session corresponds to one instance ID. The LogView for that instance ID shows the status of all SQL commands in the session.
-
If some SQL commands have finished but others are still running (session not yet exited), Latest Status shows Running.
-
If the session expired or the interface was closed, Latest Status shows Cancelled.
Analyze resource consumption and quota allocation for a job
Use this approach when a job has been running longer than expected and you suspect a resource supply issue — either the job isn't getting enough resources, or other jobs are competing for the same quota.
-
Log on to the MaxCompute console and select a region.MaxCompute console
-
In the left navigation pane, choose Observation O&M > Jobs.
-
Set a Time Range and filter by Select Quota, then click Search.
-
Click Insights in the Actions column of the target instance to open the Job Insights page.
-
On the Resource Consumption tab, review the resource usage over the job's lifecycle.
-
The chart shows used CUs and waiting CUs at both the job level and the quota level over time. If the job's CU usage is low while quota-level CU usage is high or at its limit, the quota is oversubscribed and other jobs are competing for resources.
-
Click a time point on the horizontal axis to see the quota's resource allocation at that moment — including job count and priority distribution. Click a priority color block to open the job list and identify which jobs were competing for compute resources. Based on your findings, optimize task scheduling, adjust job priorities, or update compute resource configuration. See Job priority and Compute resources - Quota management.
-
What's next
If a job's resource usage is consistently high and other jobs are queuing:
-
If the job doesn't meet business requirements, stop it.
-
If the job is legitimate, the quota configuration may need adjustment. See Compute resource configuration optimization.
References
To check job status and stop jobs using commands, see Instance operations.