This document describes the causes of and solutions for Out of Memory (OOM) errors in Hologres. An OOM error occurs when a query's memory consumption exceeds available system memory, triggering an exception. This document explains how to monitor memory consumption in Hologres, analyze high memory usage scenarios, identify OOM errors and their causes, and offers solutions.
Analyze memory consumption
View memory consumption
Total consumption: The Hologres console provides a summary of memory consumption for your instance, which aggregates values from all nodes. For more information, see Monitoring metrics.
Per-query consumption: The
memory_bytesfield approximates the memory consumption of a single query. Note that this value is an approximation and may be inaccurate. For more information, see Query and analyze slow query logs.
Handle high memory usage
Monitor your Hologres instance's overall memory usage using the Hologres console metrics (see Monitoring metrics for details). Sustained memory usage exceeding 80% is considered high. Hologres pre-allocates memory for metadata and cache to enhance computing speed, resulting in a normal idle usage of 30-50%. However, usage approaching 100% indicates a problem that affects system stability and performance. The following sections detail the causes, impacts, and solutions for high memory usage.
Causes
High memory consumption from metadata
High metadata memory usage is a key indicator of this issue. As the data volume in tables increases, the metadata required to manage it grows, consuming more memory. This can lead to high memory usage even when no tasks are running. As a best practice, a single Table Group should not exceed 10,000 tables (including partitions, but excluding foreign tables). Additionally, a high number of shards within a Table Group can increase file fragmentation and metadata accumulation, thereby consuming additional memory.
High memory consumption from computation
High query memory usage is a key indicator of this issue, typically occurring when queries scan large data volumes or involve complex computation logic, such as numerous
COUNT DISTINCTfunctions, complexJOINoperations,GROUP BYon multiple columns, or window functions.
Key impacts
Stability
Excessive memory consumption, especially from metadata, directly reduces the memory available for queries. This can lead to sporadic errors such as
SERVER_INTERNAL_ERROR,ERPC_ERROR_CONNECTION_CLOSED, orTotal memory used by all existing queries exceeded memory limitation.Performance
High memory usage, particularly from excessive metadata, depletes the cache space needed for queries. This results in a lower cache hit rate and, consequently, increased query latency.
Solutions
If high memory usage is caused by excessive metadata: Use the
hg_table_infotable to manage your tables. For more information, see Query and analyze table statistics. Consider deleting data or tables that are no longer queried, and reducing unnecessary partitioned table designs to free up memory.If high memory usage is caused by computation: Optimize your SQL for write and query use cases separately. For more information, see How to resolve OOM errors during queries and How to solve OOM errors during data import and export.
General solution: Scale up the compute and storage resources of your instance. For more information, see Instance list.
Identify OOM errors
An OOM error occurs when computation memory exceeds its allocated limit (e.g., 20 GB or more). A typical error message is shown below:
Total memory used by all existing queries exceeded memory limitation.
memory usage for existing queries=(2031xxxx,184yy)(2021yyyy,85yy)(1021121xxxx,6yy)(2021xxx,18yy)(202xxxx,14yy); Used/Limit: xy1/xy2 quota/sum_quota: zz/100
Interpret the error message as follows:
queries=(query_id, memory_used_by_query)This section, such as
queries=(2031xxxx,184yy), indicates the memory consumption of individual queries. For instance,queries=(2031xxxx,18441803528)means the query withquery_id=2031xxxxconsumed approximately 18 GB of memory on a single node during execution. The error message typically lists the top 5 memory-intensive queries, which can help identify the primary culprits. Further details can be found in Query and analyze slow query logs.Used/Limit: xy1/xy2This segment displays the ratio of
compute_memory_used_on_nodetocompute_memory_limit_on_nodein bytes. TheUsedvalue represents the aggregate compute memory consumed by all currently executing queries on that specific node. For example,Used/Limit: 33288093696/33114697728signifies that the total memory used by queries on the node reached 33.2 GB, exceeding the node's elastic memory limit of 33.1 GB, thereby triggering an OOM error.quota/sum_quota: zz/100Here,
zzdenotes the percentage of the instance's total resources allocated to a specific resource group. For example,quota/sum_quota: 50/100indicates that a resource group is configured and utilizes 50% of the total instance resources.
Basic causes of OOM errors
Unlike some systems that "Spill to Disk" when memory is insufficient, Hologres prioritizes in-memory computation by default to ensure optimal query efficiency. This fundamental design choice means that if a query's memory demands exceed the available resources, an OOM error will occur directly, rather than downgrading performance through disk usage.
Memory allocation and limits
A Hologres instance operates as a distributed system, comprising multiple nodes whose quantity varies with instance specifications. For more details, see Instance management.
Each node in a Hologres instance typically features 16 vCPUs and 64 GB of memory. An OOM error is triggered if any single node involved in a query exhausts its memory. This 64 GB is partitioned for various purposes: query computation, backend processes, cache, and metadata. While earlier versions (pre-V1.1.24) imposed a fixed 20 GB memory limit for compute nodes, Hologres V1.1.24 and later versions have removed this constraint. Memory is now dynamically adjusted. The system continuously monitors memory usage and, when metadata consumption is low, intelligently allocates the remaining available memory to query execution, maximizing runtime performance.
How to resolve OOM errors during queries
Causes.
Incorrect execution plans: This can be due to inaccurate statistics, improper join order, or other optimization issues.
High query concurrency: Many queries simultaneously consuming substantial memory.
Complex queries: Inherently complex queries or those scanning large data volumes.
UNION ALLoperations: Queries containingUNION ALLcan increase executor parallelism, leading to higher memory usage.Insufficient resource group allocation: A resource group is configured but allocated inadequate resources.
Data skew or shard pruning: These can cause unbalanced load and high memory pressure on specific nodes.
Analysis and solutions:
Cause: Insufficient resource group allocation
Solution: To address OOM errors stemming from insufficient resource allocation, leverage the Serverless Computing feature. This allows you to utilize abundant serverless computing resources in addition to your instance’s dedicated resources, effectively bypassing resource contention and providing more compute capacity. For an overview and usage instructions, refer to Serverless Computing and Serverless Computing guide.
For Hologres V3.0 and later, Query Queues offer an automated solution: OOM queries can be automatically rerun using serverless computing resources without requiring manual definition. For more information, see Control large queries.
Cause: Incorrect execution plan
Type 1: Inaccurate statistics
Run
EXPLAIN <SQL>to view the execution plan. As shown in the figure below,rows=1000indicates missing or inaccurate statistics, leading to an inefficient execution plan that consumes excessive resources and triggers an OOM error.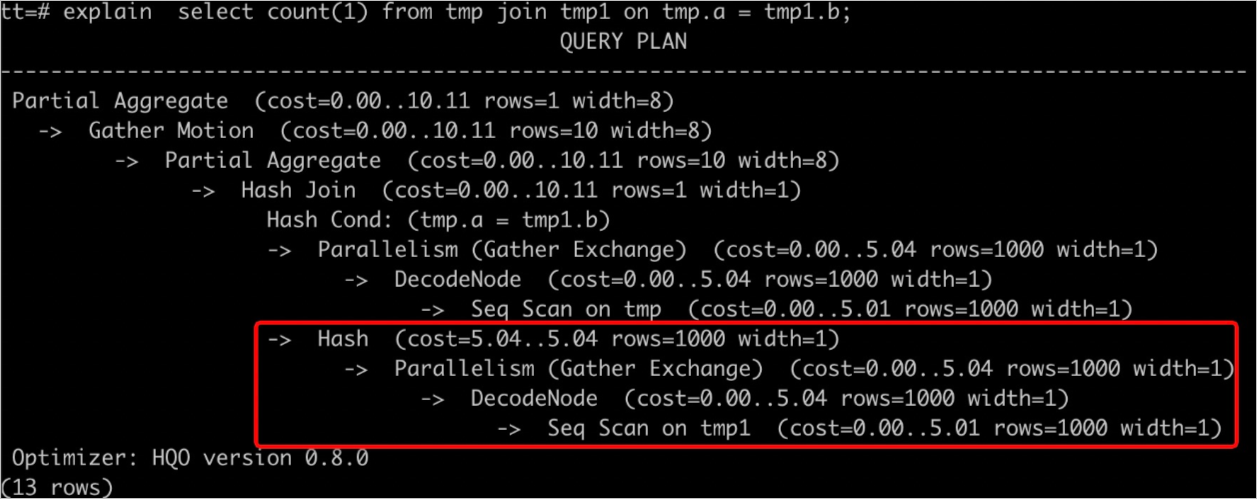
Solutions include the following:
Run the
ANALYZE <tablename>command to update table statistics.Enable auto analyze to automatically update statistics. For more information, see ANALYZE and AUTO ANALYZE.
Type 2: Incorrect join order
When using a Hash Join, the smaller table should ideally be designated as the 'build' side to construct the hash table, optimizing memory usage. Use
EXPLAIN <SQL>to examine the execution plan. If the plan indicates that the larger table is being used to build the hash table, this represents an inefficient join order and can easily lead to an OOM error. Common reasons include the following:Outdated table statistics. For example, in the figure below, the upper table’s statistics were not updated, resulting in
rows=1000.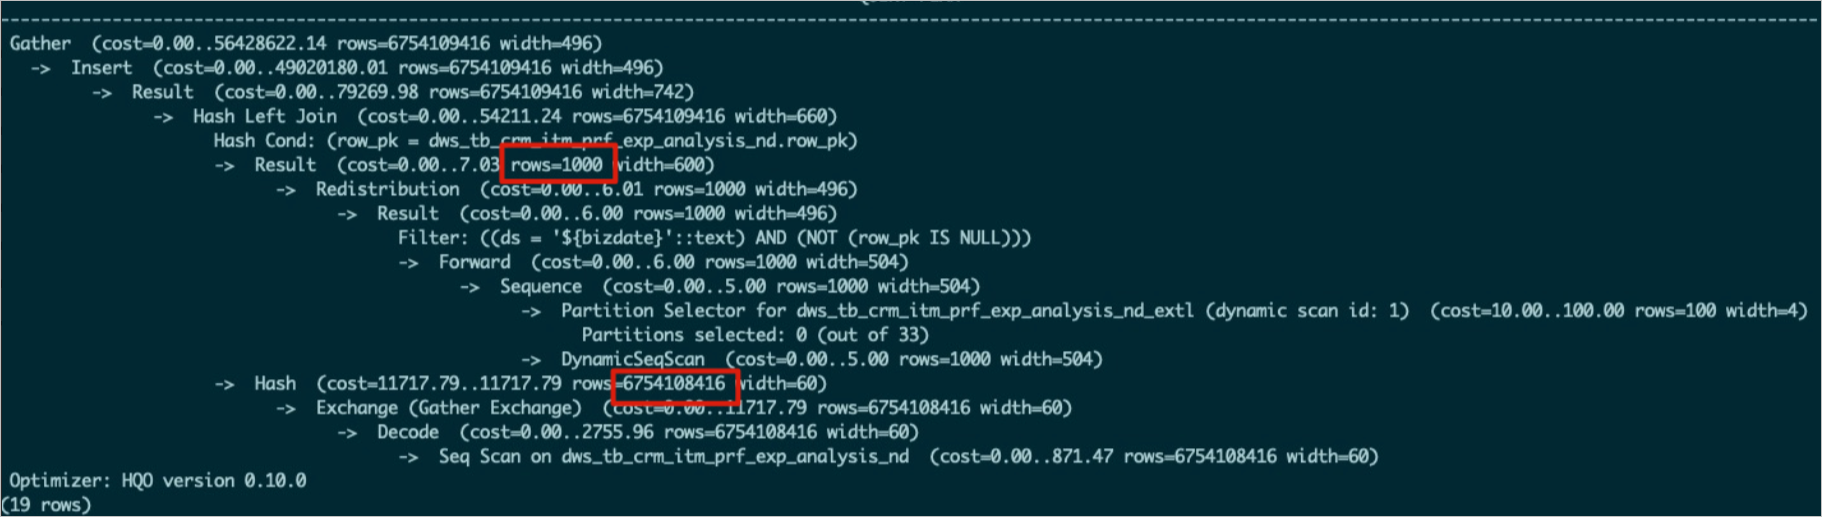
The optimizer failed to generate an optimal execution plan.
Solutions:
Run
ANALYZE <tablename>on all tables involved in the join to ensure up-to-date statistics. This helps the optimizer determine the correct join order.If the join order remains incorrect after running
ANALYZE <tablename>, adjust a GUC parameter. Setoptimizer_join_order = queryto force the optimizer to follow the join sequence specified in the SQL statement. This approach is particularly suitable for complex queries.SET optimizer_join_order = query; SELECT * FROM a JOIN b ON a.id = b.id; -- Table b is used as the build side of the hash table.You can also adjust the join order policy as needed.
Parameter
Description
set optimizer_join_order = <value>
This parameter controls the optimizer's Join Order algorithm. Valid values:
query: Does not perform Join Order transformation. Joins are executed strictly in the order specified in the SQL query. This setting incurs the lowest optimizer overhead.greedy: Employs a greedy algorithm to explore possible Join Orders. This option results in moderate optimizer overhead.exhaustive(default): Uses a dynamic planning algorithm for Join Order transformation. It aims to generate the optimal execution plan but comes with the highest optimizer overhead.
Type 3: Incorrect hash table estimation
During a hash join, the smaller input (table or subquery) is ideally designated as the build input to construct the hash table, optimizing performance and conserving memory. However, due to query complexity or inaccurate statistics, the system may misestimate data volumes and mistakenly select a larger relation as the build input. This results in the construction of an excessively large hash table, consuming significant memory and triggering an OOM error.
As shown in the figure below,
Hash (cost=727353.45..627353.35 , rows=970902134 width=94)represents the build input, androws=970902134indicates the estimated data volume for building the hash table. If the actual table contains less data, the estimation is inaccurate.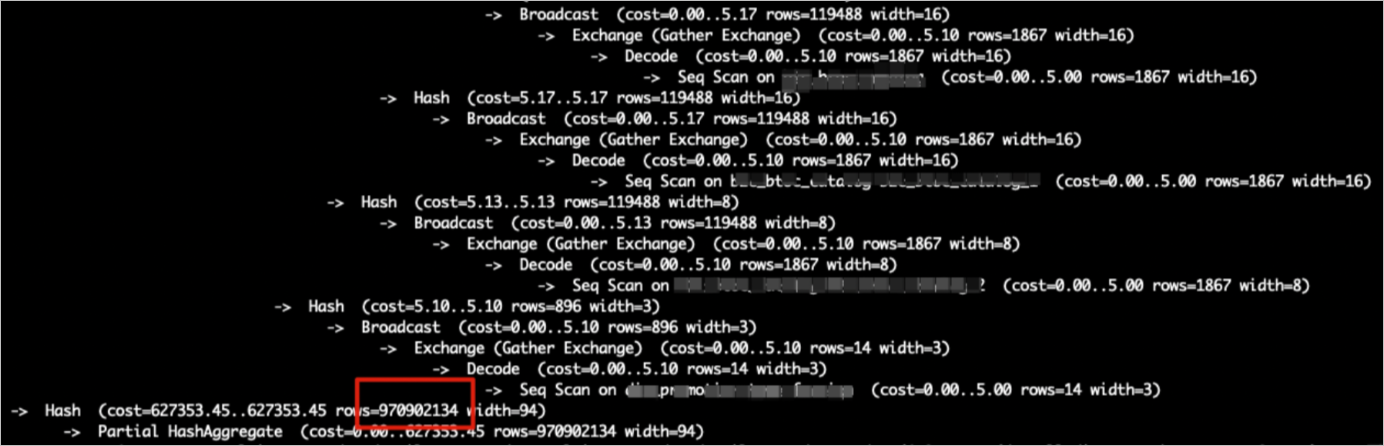
Solutions:
Verify statistics: Check if the subquery’s table statistics are current and accurate. If not, run
ANALYZE <tablename>to update them.Disable hash table estimation: Turn off the execution engine's hash table estimation using the following parameter:
NoteThis parameter defaults to
off. However, it may have been enabled in certain tuning scenarios. If it is currently enabled, ensure you set it back tooff.SET hg_experimental_enable_estimate_hash_table_size =off;
Type 4: Broadcasting a large table
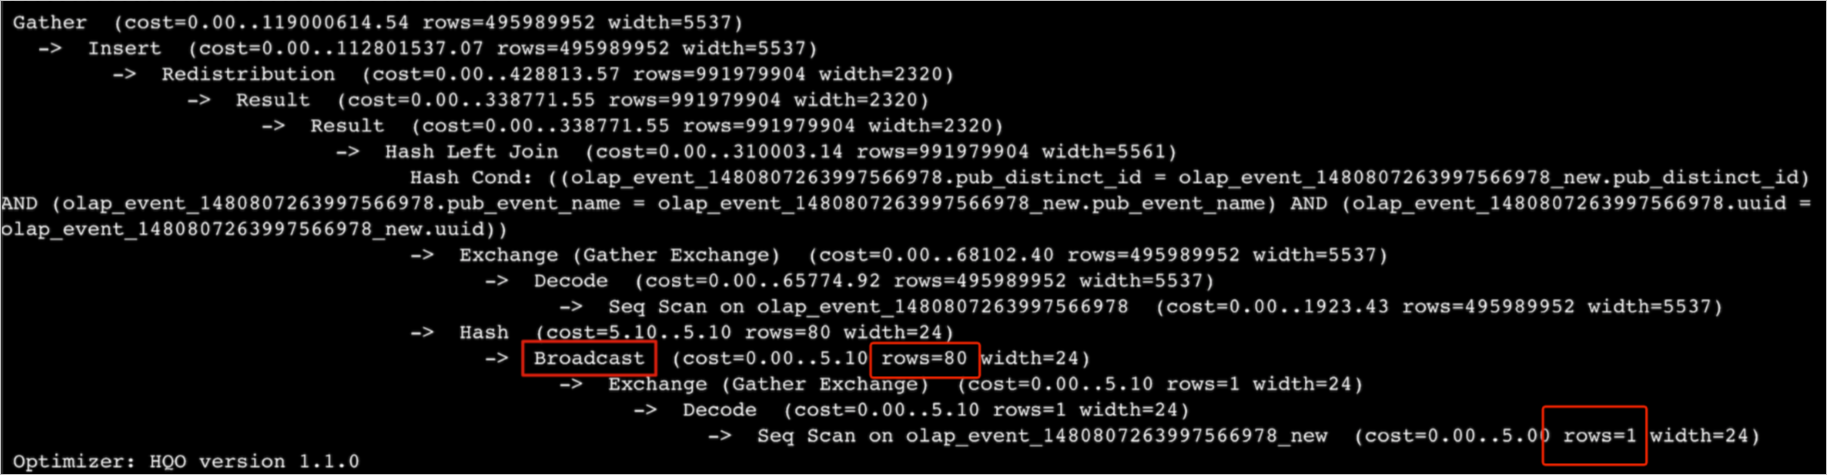
Broadcasting involves copying data to all shards. It is efficient only when the table and overall shard count are small. In join operations, the execution plan firsts broadcasts the build input data and then constructs a hash table. This means every shard receives and processes the entire build input dataset. A large dataset or excessive shard count can consume substantial memory, often leading to OOM errors.
For example, an 80-million-row table might appear in the execution plan as having only 1 estimated row, with just 80 rows supposedly involved in the broadcast—a clear inconsistency. Actual execution, however, broadcasts all 80 million rows, consuming excessive memory and triggering an OOM error.
Solutions:
Check whether the estimated row count in the execution plan matches reality. If not, run
ANALYZE tablenameto update statistics.Disable broadcasting and rewrite it as a redistribution operator using the following GUC parameter.
SET optimizer_enable_motion_broadcast = off;
Cause: High query concurrency
If the Queries Per Second (QPS) metric spikes significantly, or if the OOM error reports
HGERR_detl memory usage for existing queries=(2031xxxx,184yy)(2021yyyy,85yy)(1021121xxxx,6yy)(2021xxx,18yy)(202xxxx,14yy);with each query using relatively minimal memory, high query concurrency is the probable cause. Solutions:Reduce write concurrency: If write operations are contributing, reduce their concurrency. For more information, see How to solve OOM errors during data import and export.
Implement read/write splitting: Deploy a read/write splitting architecture with primary and secondary instances (shared storage).
Increase the compute specifications of your instance.
Cause: Complex query
If a single query triggers an OOM error due to its inherent complexity or the large volume of data it scans, consider the following approaches:
Pre-compute data: Perform pre-computation and write cleansed data into Hologres to avoid large-scale ETL operations directly within Hologres.
Add filter conditions.
Optimize the SQL: Optimize the SQL statement itself—for example, by using techniques like Fixed Plan or Count Distinct optimization. For more information, see Optimize query performance.
Cause: UNION ALL
As shown below, when an SQL statement contains many
UNION ALLsubqueries, the executor processes them concurrently. This can overload memory and cause an OOM error.subquery1 UNION ALL subquery2 UNION ALL subquery3 ...Solution: Force serial execution using the following parameters to mitigate OOM errors. Be aware that this will result in slower query performance.
SET hg_experimental_hqe_union_all_type=1;
SET hg_experimental_enable_fragment_instance_delay_open=on;
Cause: Unreasonable resource group configuration
An OOM error reports:
memory usage for existing queries=(3019xxx,37yy)(3022xxx,37yy)(3023xxx,35yy)(4015xxx,30yy)(2004xxx,2yy); Used/Limit: xy1/xy2 quota/sum_quota: zz/100. If zz is small—for example, 10 (indicating only 10% of the instance's total resources are allocated to the resource group)—this limited allocation significantly restricts the memory available to queries executed within that group, increasing the likelihood of OOM errors.
Solution: Reset the resource group quota. Each resource group should receive at least
30%of the instance’s total resources to ensure adequate memory capacity.Cause: Data skew or shard pruning
If overall instance memory usage is low but an OOM error still occurs, the cause is typically data skew or shard pruning, which concentrates memory pressure on one or a few nodes.
NoteShard pruning is a query optimization technique that scans only a subset of shards, rather than all of them.
Check for data skew: Use the following SQL query. The
hg_shard_idis a built-in hidden field in every table that indicates the shard where each row resides.SELECT hg_shard_id, count(1) FROM t1 GROUP BY hg_shard_id;Inspect shard pruning: Inspect the execution plan for indications of Shard Pruning. For example, if the shard selector shows
l0[1], it means only one specific shard's data was selected for the query.-- The distribution key is x. Based on the filter condition x=1, you can quickly locate the shard. SELECT count(1) FROM bbb WHERE x=1 GROUP BY y;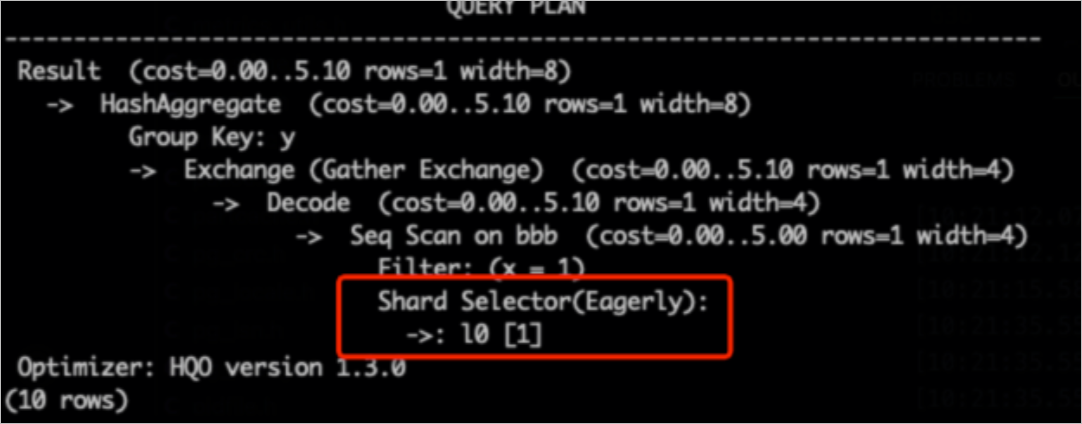
Solutions:
Design an appropriate distribution key to prevent data skew.
If business logic inherently causes data skew, modify the application logic accordingly.
Cause: High-cardinality multi-stage GROUP BY
Starting with Hologres V3.0, multi-stage aggregations on high-cardinality data are prone to OOM errors. This often occurs when the
GROUP BYcolumns do not align with the data distribution (i.e., the distribution key is not a subset of theGROUP BYkey). In these situations, each concurrent instance in the initial aggregation stage must maintain a very large hash table for grouping, creating high memory pressure. To mitigate this, enable staged aggregation by setting the following parameter:-- Use a GUC parameter to set the maximum number of rows in the aggregation hash table. The following SQL statement indicates that the partial_agg_hash_table can have a maximum of 8192 rows. The default value is 0, which indicates no limit. SET hg_experimental_partial_agg_hash_table_size = 8192;
How to solve OOM errors during data import and export
OOM errors may be encountered during data transfer operations within Hologres. This applies to transfers between internal tables as well as interactions with foreign tables. A frequent scenario where such errors occur is during the import of data from MaxCompute into Hologres.
Solution 1: Use Serverless Computing for imports and exports
The Serverless Computing feature allows you to leverage additional Serverless resources for import and export tasks, supplementing your instance’s dedicated resources. This provides greater compute capacity and helps avoid resource contention, making it an effective solution for resolving OOM issues during data transfers. For an overview, see Serverless Computing. For detailed usage instructions, see Serverless Computing guide.
Solution 2: Control scan concurrency for wide tables or columns
In MaxCompute import scenarios, OOM errors during writes can arise when wide tables or columns are combined with high scan concurrency. Use the following parameters to control import concurrency and mitigate these OOM errors.
Control scan concurrency for wide tables (common scenario)
NoteApply the following parameters along with your SQL statement. Prioritize the first two parameters. If an OOM error persists, reduce their values further.
-- Set the maximum concurrency for accessing foreign tables. The default value equals the instance's vCPU count. The maximum value is 128. Do not set a large value to prevent queries on foreign tables, especially in data import scenarios, from affecting other queries and causing system busy errors. This parameter is effective in Hologres V1.1 and later.
SET hg_foreign_table_executor_max_dop = 32;

-- Adjust the batch size for each read from a MaxCompute table. The default value is 8192.
SET hg_experimental_query_batch_size = 4096;

-- Set the maximum concurrency for executing DML statements when accessing foreign tables. The default value is 32. This parameter is optimized for data import and export scenarios to prevent import operations from consuming excessive system resources. This parameter is effective in Hologres V1.1 and later.
SET hg_foreign_table_executor_dml_max_dop = 16;

-- Set the split size for accessing MaxCompute tables. This parameter can adjust concurrency. The default value is 64 MB. If the table is large, increase this value to prevent too many splits from affecting performance. This parameter is effective in Hologres V1.1 and later.
SET hg_foreign_table_split_size = 128;
Control scan concurrency for wide columns
If you’ve already tuned parameters for wide tables but still encounter OOM errors, check whether your data includes wide columns. If so, adjust the following parameters to resolve the issue.
-- Adjust the shuffle parallelism for wide columns to reduce data accumulation.
SET hg_experimental_max_num_record_batches_in_buffer = 32;

-- Adjust the batch size for each read from a MaxCompute table. The default value is 8192.
SET hg_experimental_query_batch_size=128;
Cause: Excessive duplicate data in a foreign table
When a foreign table contains a substantial amount of duplicate data, import performance can degrade significantly, often leading to OOM errors. The definition of "substantial duplicate data" is context-dependent and varies by use case. For example, a table of 100 million rows with 80 million duplicates would typically be considered highly duplicated. You should assess this based on your specific business context.
Solution: Deduplicate the data before importing it, or import it in smaller batches to avoid loading large volumes of duplicate data simultaneously.