Realtime Compute for Apache Flink offers flexible monitoring with Cloud Monitor (free) and Managed Service for Prometheus. Set up alerts for job metrics, events, and workflows to quickly detect and resolve anomalies. This guide covers configuring monitoring and alerts across both services.
Limitations
Alert rules are not supported for Flink jobs running on session clusters.
Alert rules are not supported for batch jobs.
Workflow alerts are exclusively available with Cloud Monitor.
Overview
Choose your configuration method based on your workspace's monitoring service type. See How do I check the monitoring service type for my workspace?.
Cloud Monitor
Metric-based alerts: Set up alert rules for key metrics like CPU usage, latency, or data volume. Apply to: single jobs or batches of jobs.
Event-based alerts (including workflows): Set up alerts for specific events, such as job failures. Apply to: jobs and workflow events.
Managed Service for Prometheus (ARMS)
Metric-based alerts: Set up alerts for six key metrics.
Event-based alerts: Set up alerts for only job failure events. To configure alerts for other events, use Cloud Monitor. See Event-based alerts (including workflows).
Switch the monitoring service for a workspace
Realtime Compute for Apache Flink allows you to switch the monitoring service for your workspace. Procedure:
Log on to the Management Console, click ![]() in the Actions column of your workspace and switch the monitoring service.
in the Actions column of your workspace and switch the monitoring service.
You'll be prompted with the notes. Read them carefully before you confirm the change.
For details, see Configure alert rules.
Configure alert rules with Cloud Monitor
Metric-based alerts
To set alert rules with Cloud Monitor, you must log on with your Alibaba Cloud account or as a RAM identity with necessary permissions in the target namespace.
Log on to the Cloud Monitor console.
In the left navigation pane, choose .
Click Create Alert Rule and configure the rule.
Parameter
Description
Product
Choose Flink.
Resource Range
Select Instances. The alert rule applies to a specific Flink workspace.
Associated Resources
Click Add Instance. In the dialog, select your destination region and your workspace (How do I view information such as the workspace ID?), and click OK.
Rule Description
Click +Add Rule > Simple Metric or Combined Metrics to open the Configure Rule Description panel.
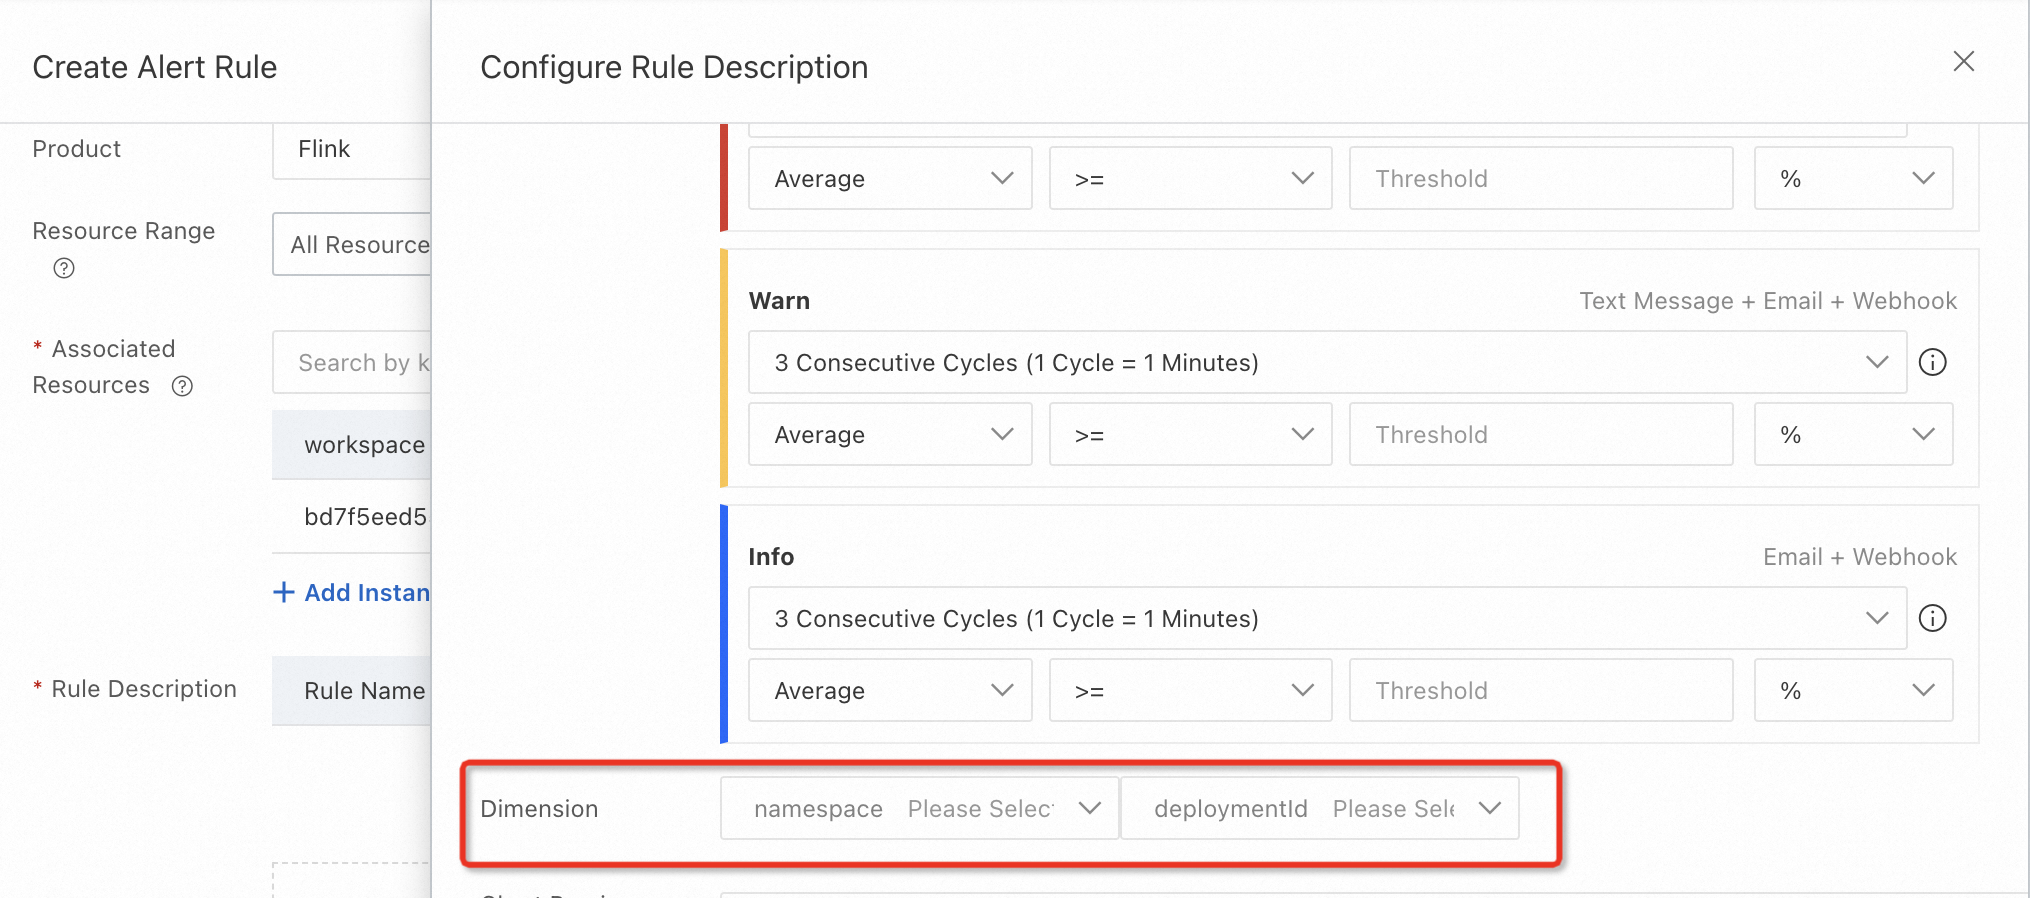
(Optional) After a metric is selected, the Dimension section displays. Here you can configure namespace and deploymentId to specify the job deployment to monitor.
NoteIf the drop-down lists are empty, enter the namespace and deployment ID manually.
Leaving these fields blank will monitor all job deployments across all namespaces.
NoteSingle metric alerts can cause false positives or negatives in production. Composite metric alerts provide a more accurate reflection of actual business anomalies. For details, see Best practices for monitoring and alerting.
For details on other parameters, see Create an alert rule.
Event-based alerts (including workflows)
To set alert rules with Cloud Monitor, you must log on with your Alibaba Cloud account or as a RAM identity with necessary permissions in the target namespace.
System event alerts
Subscribe to system events for single or batches of jobs.
Log on to the Cloud Monitor console.
In the left navigation pane, choose .
On the Subscription Policy tab, click Create Subscription Policy.
On the Create Subscription Policy page, configure the subscription details. For configuring parameters not listed below, see Manage event subscriptions (Recommended).
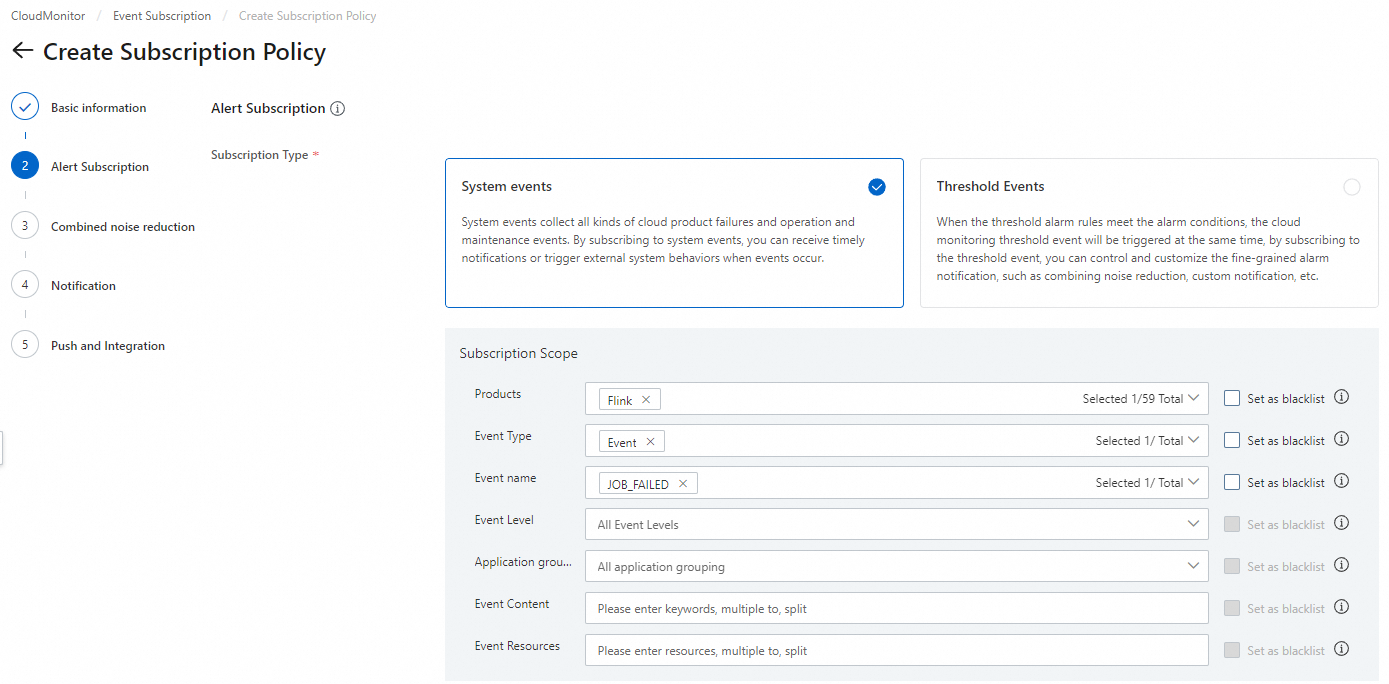
Subscription Type: Select System Events.
Products: Select Flink.
Event name: Supported events include JOB_FAILED, ECS.SystemFailure, and ECS.SystemMaintenance.
Event Content: Fill in the following information as needed.
Workspace ID: Enter a workspace ID, and the alert rule applies to all jobs across all namespaces within the target workspace. For viewing the workspace ID, see How do I view information such as the workspace ID?.
Namespace name: Enter a namespace name, and the alert rule applies to all jobs in the target namespace.
Deployment name: Enter a job deployment name, and the alert rule applies to specific job deployments. Separate multiple names using commas (
,). When duplicate deployment names exist, use the deployment ID.Deployment ID: Enter a job deployment ID, and the alert rule applies to specific job deployments. Separate multiple IDs using commas (
,). To get a deployment ID, go to your deployment details page
NoteLeaving Application group, Event Content, or Event Resources empty will apply the subscription to all workspaces within your account.
Workflow event alerts
Subscribe to workflow events. For workflow details, see Manage workflows.
Obtain the resource ID of the workflow task.
Log on to the Cloud Monitor console.
In the left navigation pane, choose .
On the Event Monitoring tab, set SelectProduct to Flink, set SelectEvent Name to
flink:Workflow:TaskStateChange, and click Search.Filter for the workflow task's resource ID.

The resource ID's format:
acs:flink:cn-hangzhou:<AlibabaCloudAccountID>:resourceId/workspaceId/<workspaceId-namespaceId>#workflowDefinitionName/<workflowDefinitionName>#taskDefinitionName/<taskDefinitionName>. You can also use this format to directly construct the resource ID for your workflow task.Parameter
Description
<AlibabaCloudAccountID>The ID of the Alibaba Cloud account that owns the Flink workspace.
<workspaceId-namespaceId>Consists of the
workspaceIdandnamespaceId, joined by a hyphen (-).workspaceId: Your workspace ID. For more information, see How do I view the information about a workspace, such as the workspace ID?.namespaceId: Your namespace name.<workflowDefinitionName>The workflow name.
<taskDefinitionName>The name of the workflow task.
NoteState changes for workflow tasks typically appear in Cloud Monitor with a delay of a few minutes.
Subscribe to event notifications.
In the left navigation pane of the Cloud Monitor console, choose .
On the Subscription Policy tab, click Create Subscription Policy.
On the Create Subscription Policy page, configure the policy. For details, see Manage event subscriptions (Recommended).
Subscription Type: Select System Events.
Products: Select Flink.
Event name: Select flink:Workflow:TaskStateChange.
Event Content: Filter by the desired transition state, e.g.,
toState: FAILED,toState: SUCCESS, andfromState: SCHEDULED, toState: RUNNING.Event Resources: Enter the resource ID obtained in the previous step. Separate multiple IDs with commas (
,).Event Type, Event Level, and Application group: Leave these parameters unset.
Configure monitoring and alerts with Managed Service for Prometheus
Metric-based alerts
To monitor multiple metrics using Prometheus, you must use a custom PromQL statement to create an alert rule. For a simpler setup, configure alert rules with Cloud Monitor.
Single job configuration (Development Console)
You can create alert rules for target jobs from ground up or templates.
The Development Console displays only alert events from the last 48 hours. For older alert histories, check Alert Management in the ARMS console.
Go to the alert configuration page.
Log on to Realtime Compute for Apache Flink's Management Console and click Console in the Actions column of your workspace.
In the left navigation menu, choose . Click your job deployment.
Select the Alarm tab.
Switch to the Alarm Rules subtab, and choose .
Alternatively, choose .
Enter the alert rule information.
Section
Label
Description
Rule
Name
Enter a rule name. It must start with a letter and can contain lowercase letters, digits, and underscores (
_). Length: 3 to 64 characters.Description
Enter your remarks about the rule.
Content
Configure the conditions that trigger the alert. Realtime Compute for Apache Flink periodically compares actual metric values against the threshold and triggers an alert if a condition is met. Configure the alert logic:
Metric:
Restart Count in 1 MinuteCheckpoint Count in 5 MinutesEmit Delay: Business latency from data generation to source egress, in seconds.ImportantThe accuracy of
Emit Delaydepends on accurate timestamps from external systems. If external systems lack timestamps or record incorrect ones,Emit Delaywill be inaccurate, failing to reflect true latency. To reflect actual latency more accurately, configure alert rules for composite metrics. For details, see Best practices for monitoring and alerting.IN RPS: Input records per second.OUT RPS: Output records per second.Source Idle Time: Duration the source operator was not processing data, in milliseconds.Job Failed
Time Interval: The length of the historical data time window the system queries backwards from the current time during each check, in minutes.
Comparator: Supports >= and <=.
Thresholds: The value compared against the metric.
Comparator (
>=): Compares the maximum metric value against the threshold. Alert ifmax_value >= threshold.Comparator (
<=): Compares the minimum metric value against the threshold. Alert ifmin_value <= threshold.
Assume you are monitoring the
Checkpoint Count in 5 Minutesmetric, with a time interval of 10 minutes and a threshold of 2, using the<=comparator.Flink checks every minute, evaluating the metric over a 10-minute window. An alert is triggered if the minimum successful checkpoint count within any 5-minute period drops to 2 or fewer.
Effective Time
The time frame when the alert rule is enabled. Defaults to all day. You can restrict alerts to specific times, like during business hours (9 AM to 6 PM).
Alarm Rate
The interval at which alerts are sent within a specified number of minutes. Supports 1 minute to 1440 minutes (24 hours).
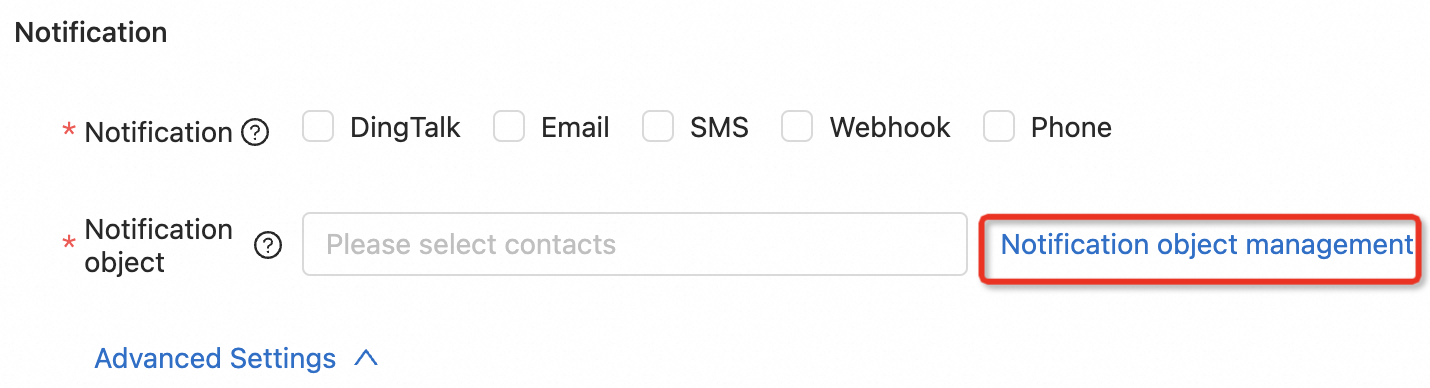
Notification
Notification
Select one or more notification methods. Options include:
DingTalk
Email
SMS
Webhook
Phone
Ensure the recipient's phone number is verified; otherwise, the notification will not be effective. You can click Notification object management below. If the Unverified tag appears in the Phone column for the target contact on the Contacts tab, click it to complete verification.

ImportantEnsure your chosen notification method has a corresponding notification object configured. For DingTalk, this means adding a DingTalk robot notification object after selecting DingTalk as the method.
Notification object
Choose one or more notification objects. Click Notification object management to create notification objects. For details, see Workspace and namespace management.
Alarm Noise Reduction
Click Advanced Settings and switch on Alarm Noise Reduction.
When this option is enabled, alerts are sent only when the threshold is met continuously. This prevents alerts for temporary issues, such as brief failovers caused by cluster scheduling or auto-tuning.
No Data Alarms
Click Advanced Settings, turn on the No Data Alarms switch, and specify the duration.
Triggers an alert if no monitoring data is reported within the selected time period. Typical causes: JobManager exceptions, job stops, or reporting link failures.
Click OK.
After you save an alert rule, it is automatically enabled and appear in the alert rule list. You can choose to stop, edit, or delete them.
Event-based alerts
Only job failure events are supported. To configure an alert for this event, follow instructions in the metric-based alert configuration and select the Job Failed metric. To configure alerts for other events, Configure event-based alerts (including for workflows) with Cloud Monitor.
FAQ
How do I check the monitoring service type for my workspace?
You select the monitoring service type when creating a workspace. To verify it after creation, go to and click your job deployment name. If the Alarm tab is displayed, the workspace uses Managed Service for Prometheus as its monitoring service. If the tab is not displayed, the workspace uses Cloud Monitor.

How do I add a DingTalk robot for alerts in the Realtime Compute for Apache Flink's Development Console?
Add a custom DingTalk robot and obtain its webhook address.
ImportantFor Security Settings, select Custom Keywords and set at least one keyword to Alert to receive alert information.
Add a notification object.
Navigate to , click the name of your job deployment, and click the Alarm tab.
Click or Create Rule by Template.
On the Create Rule or Create Rule Template panel, click Notification object management.
In the dialog, select the DingTalk tab, click Add DingTalk.
Enter the name and URL of the DingTalk robot, and click Submit.
In the Create Rule or Create Rule Template panel, set Notification to DingTalk and set Notification object to your DingTalk robot.
For details, see Single job configuration (Development Console).
Click OK.