Realtime Compute for Apache Flink provides the Prometheus service for workspaces. To reduce monitoring costs, you can disable the Prometheus service for an entire workspace or discard individual metrics for specific deployments. Discarded metrics can be restored based on your business requirements.
Prerequisites
Before you begin, make sure that you have:
-
A workspace with Managed Service for Prometheus enabled
-
(If using a RAM user or RAM role) Permissions to access Application Real-Time Monitoring Service (ARMS). For details, see Overview
Disable or enable the Prometheus service
Disabling the Prometheus service uninstalls the Prometheus instance for the workspace and discards all metrics in that workspace.
-
In the Realtime Compute for Apache Flink console, find your workspace and select
 > Monitoring Indicator Configuration in the Actions column. You are redirected to the Service Discovery page for the Prometheus instance in the ARMS console. The instance name appears in the upper-left corner of the page.
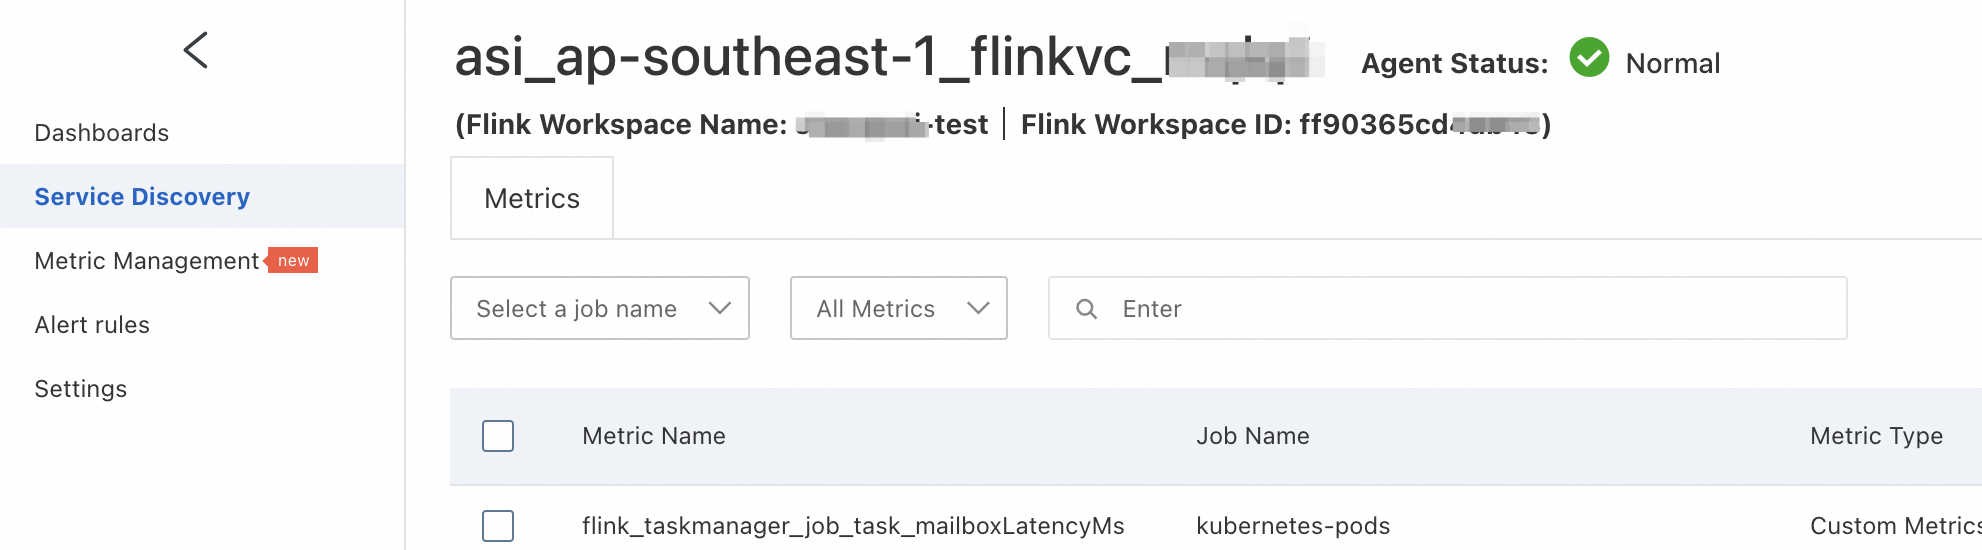
-
Click the
 icon in the upper-left corner to go to the Managed Service for Prometheus page.
 -
Find the Prometheus instance and, in the Actions column, click Uninstall to disable the service or Install to enable it.
-
Click OK.
Discard a metric
Discarding a metric removes it from collection for the selected deployment. You can restore a discarded metric based on your business requirements.
-
In the Realtime Compute for Apache Flink console, find your workspace and select
> Monitoring Indicator Configuration in the Actions column. You are redirected to the Service Discovery page for the Prometheus instance in the ARMS console. -
In the left-side navigation pane, click Service Discovery.
-
On the Metrics tab, find the metric to discard. Search by metric name, or use the keyword
flinkto list all metrics for Flink job deployments. -
In the Actions column for the target metric, click Discard.
-
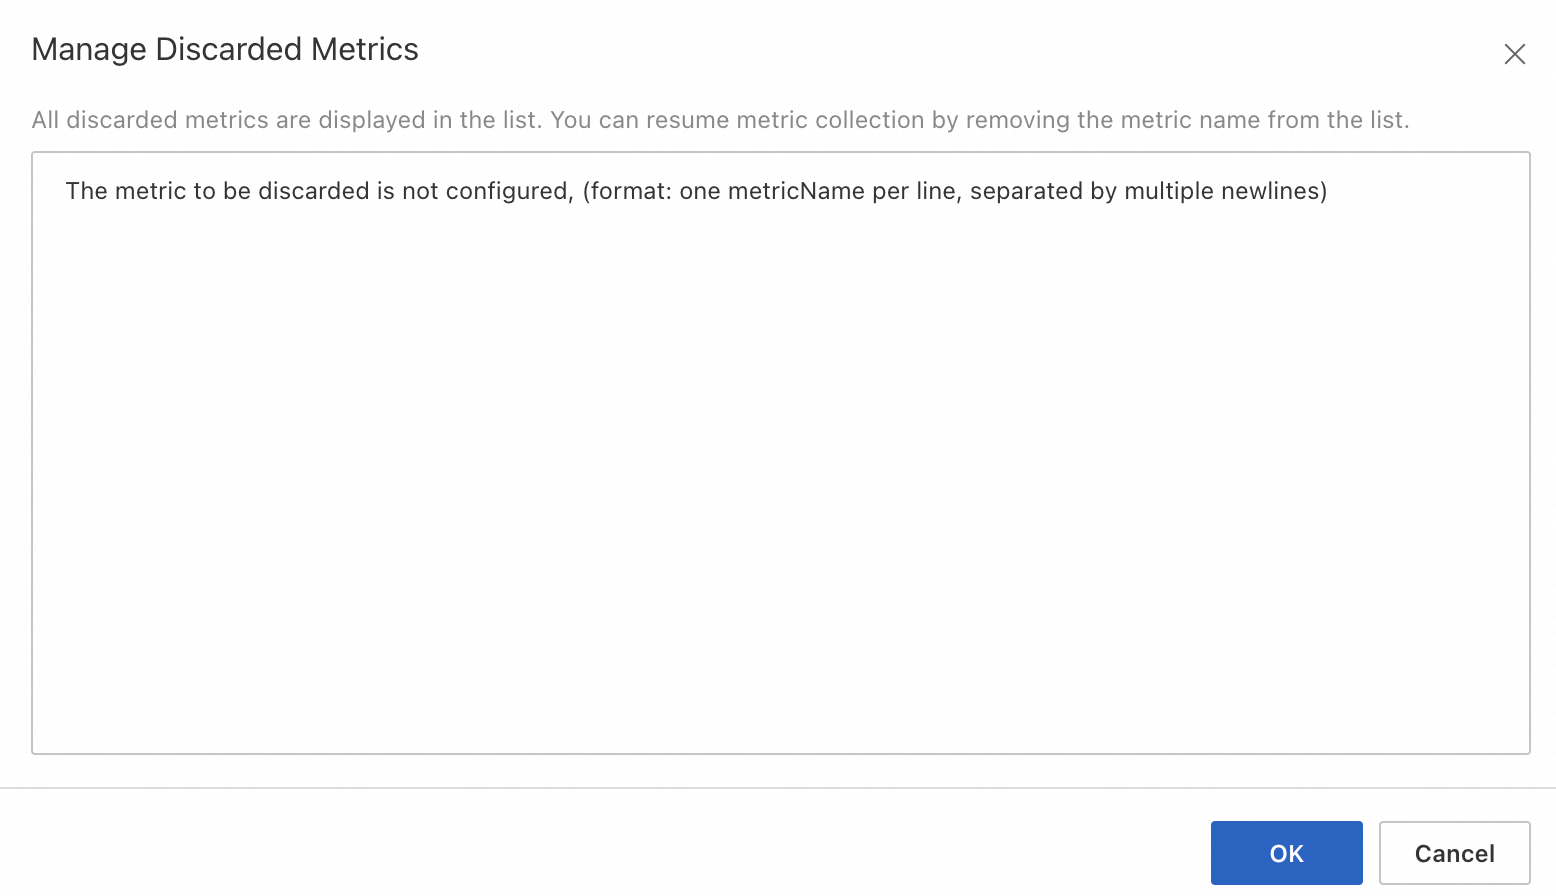
In the Manage Discarded Metrics dialog box, confirm the metric name and click OK.
Restore a metric
-
In the Realtime Compute for Apache Flink console, find your workspace and select
> Monitoring Indicator Configuration in the Actions column. You are redirected to the Service Discovery page for the Prometheus instance in the ARMS console. -
In the left-side navigation pane, click Service Discovery.
-
Click Manage Discarded Metrics.
-
In the Manage Discarded Metrics dialog box, delete the metric entry to restore it.
-
Click OK.
What's next
-
Metrics — View deployment metrics to check whether your job data is normal.
-
Report metrics of Realtime Compute for Apache Flink to other platforms — Configure parameters to report metrics to external monitoring systems.
-
Configure monitoring and alerts — Set up alert rules for running deployments.